
Using the Function Histogram in Function Summary and Callgraph Captures
Transient Spikes
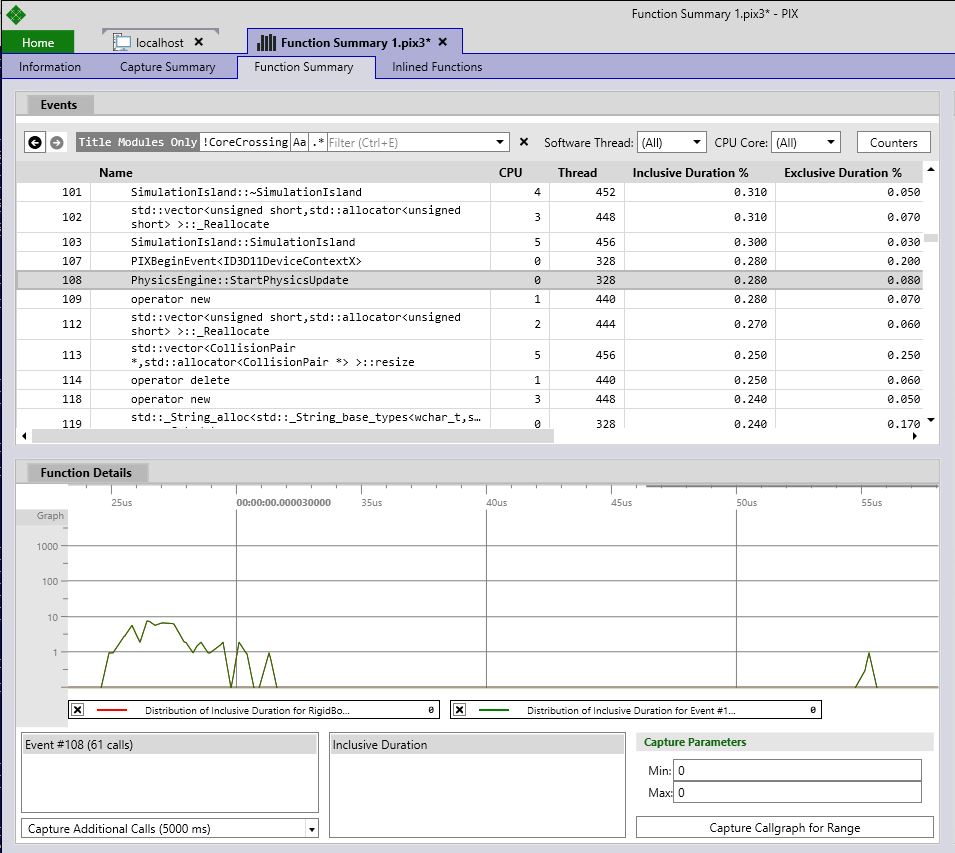
The Y axis of the histogram shows the number of calls and the X axis shows the amount of time that each call took.
The Y axis is derived from a histogram with bucket sizes set at 1% of the range between min and max recorded values. While you can’t see the exact duration for each individual call because similar calls will aggregate into the same bucket, you can see the relative distribution of behavior between groups of similarly behaving calls.
The data in the histogram shows you the distribution of the calls recorded during the capture and the time spent in each call. As you scan the graph from left to right you’ll find the calls that took the most amount of time. For example, in the figure above you can see a large group of calls that took less than 30us and an outlier that took almost 55us.
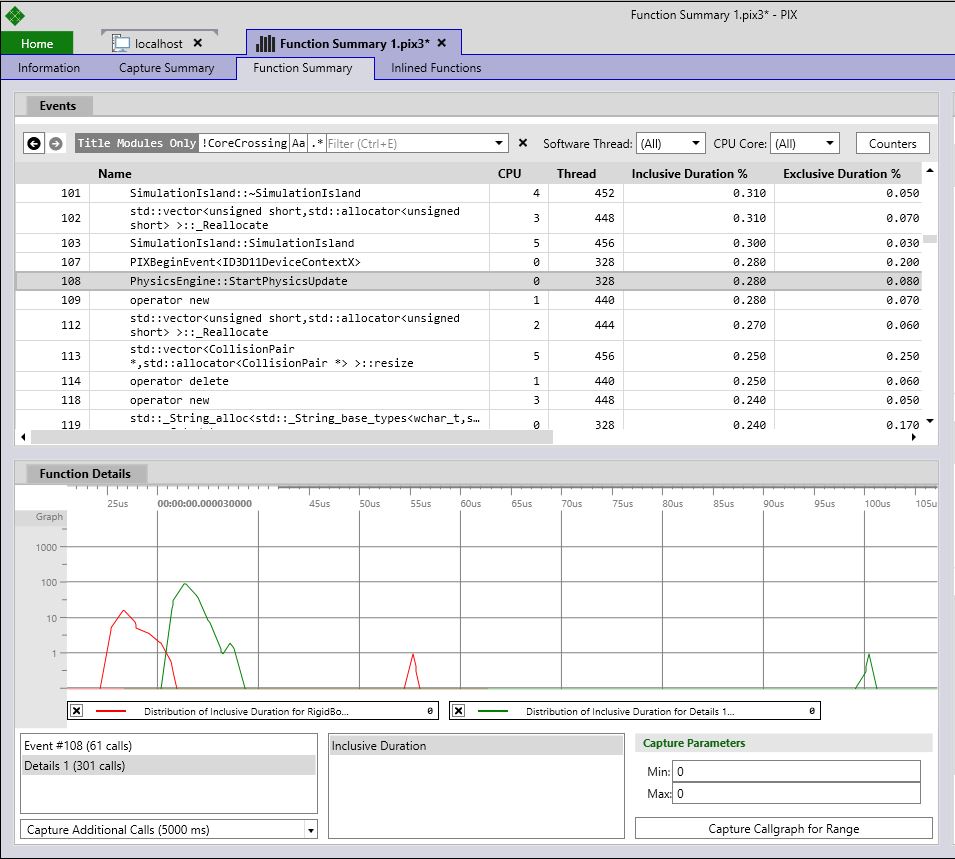
By default, a function summary capture gathers a relatively small amount of profiling data for each function. This is done to minimize the amount of memory used during the capture. When analyzing transient spikes, you may often want to gather data on more calls in order to confirm the trends you’ve seen initially and to get more data with which to do analysis. Clicking the Capture Additional Calls button in the lower left corner of the window will perform another capture that gathers more data. The amount of time the additional capture should run is configurable.
The data for the detailed capture is represented by an additional row labeled Details # in the lower left list box. You can take multiple function detail captures. Each will be represented by an entry in the list box. Selecting a Details capture will display the data for that capture in the histogram. The original capture is graphed in red while the more detailed captures are graphed in green. Typically, the distribution for the original capture will be very similar to that of the detailed captures. The figure below shows the histogram for an original capture that contains 61 calls and a detail capture that contains 301 calls.
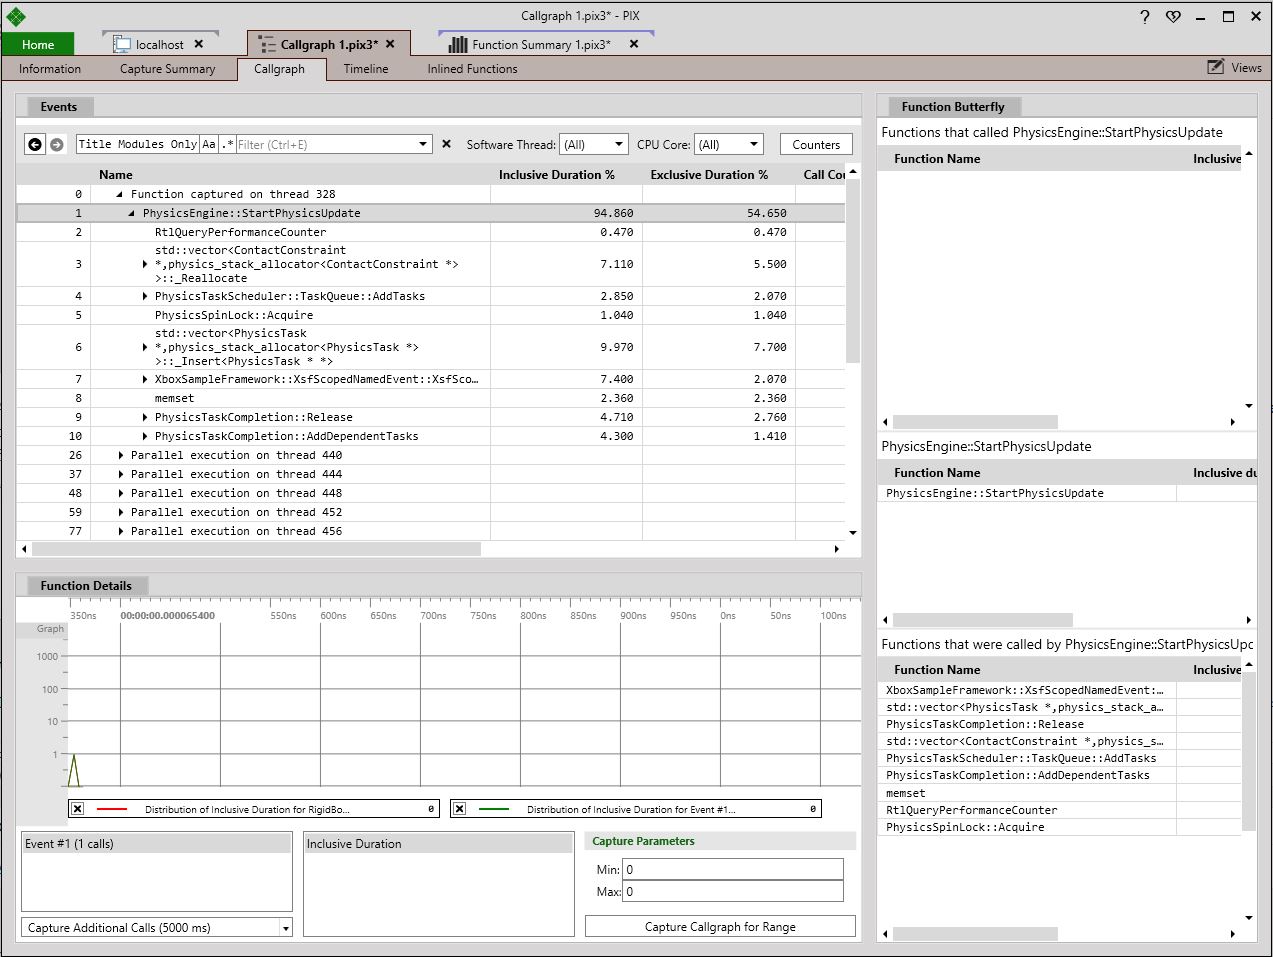
Conditional Callgraph Captures
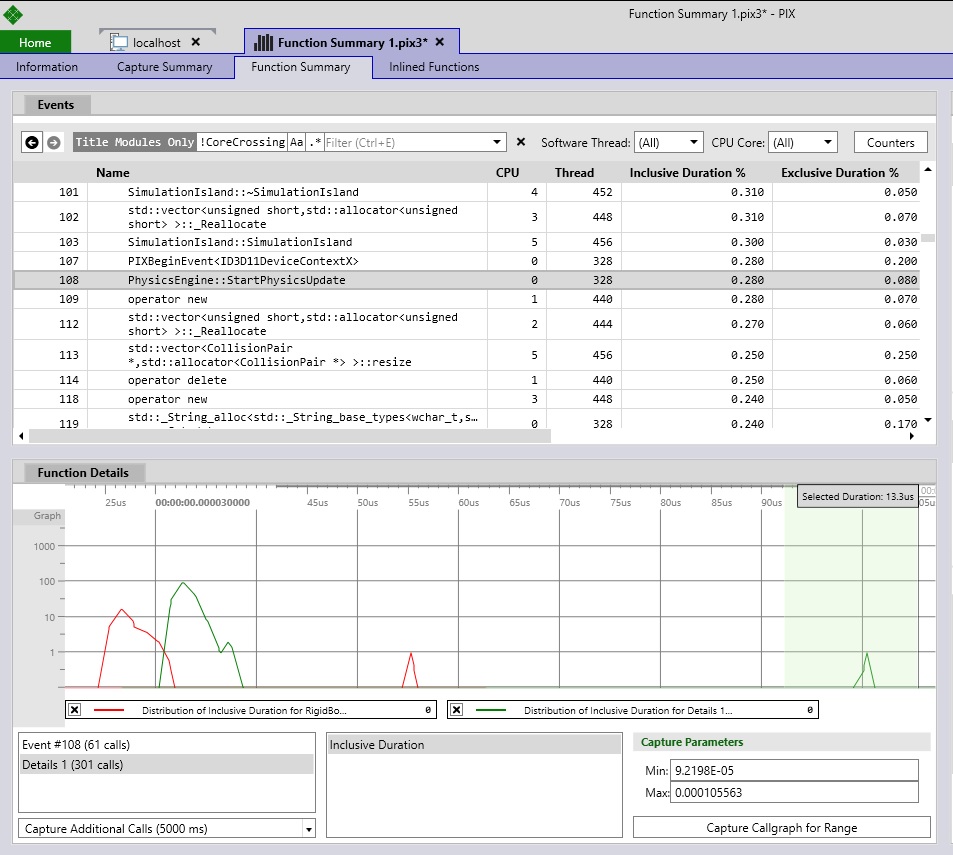
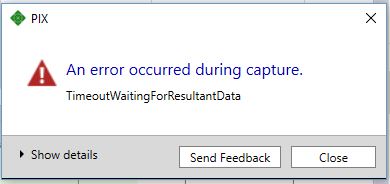
After highlighting the range, choose the Capture Callgraph for Range button. Selecting this button will initiate a callgraph capture. The capture will run until a call that falls within the selected time duration occurs. Note that it is possible that this capture may never encounter another call that meets the selection criteria. In this case, the capture will eventually time out and the following error dialog is displayed:
If the selection criteria is met, a new callgraph capture is opened as shown in the following figure. This capture displays the callgraph for the first function call that met the selection criteria.
 Light
Light Dark
Dark