Function Summary Captures (Deprecated)
PIX Function Summary Captures are deprecated starting with the 2101.27 release of PIX on Windows. The ability to take Function Summary Captures will be removed in an upcoming release of PIX.
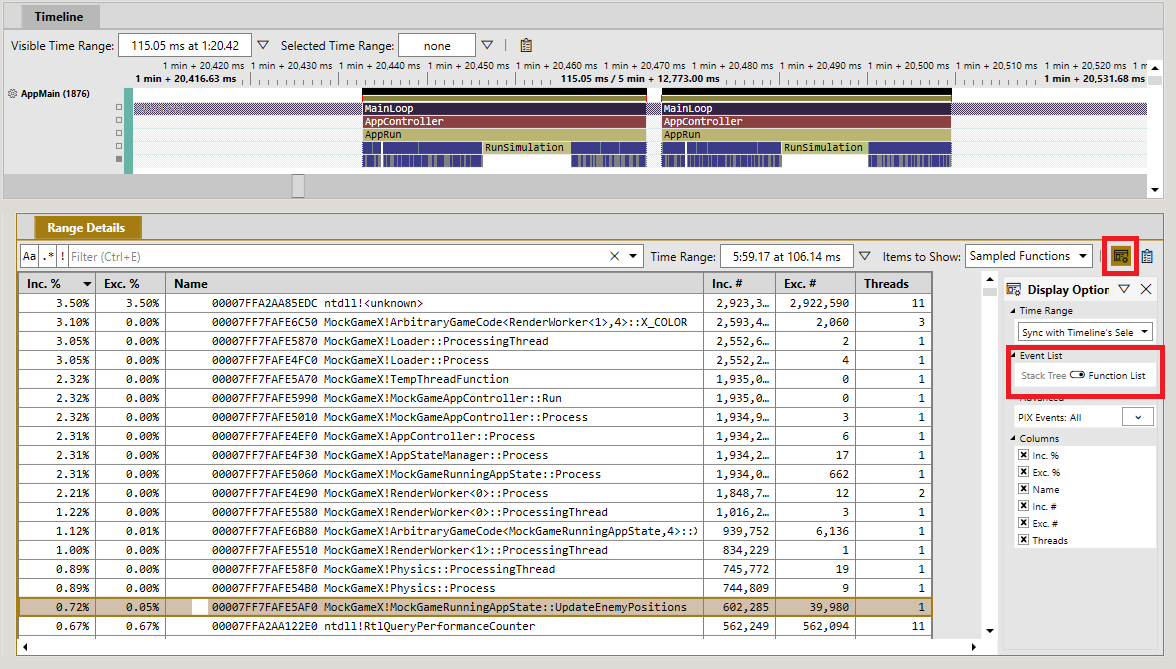
The primary profiling workflow previously provided by Function Summary Captures is now provided by the Sampling Profiler that is part of Timing Captures. Function Summary Captures were commonly used to find a title’s most expensive functions in terms of Inclusive and Exclusive duration. The Sampling Profiler now provides this capability via a flat function list that is created by aggregating the CPU samples collected while a Timing Capture is running. The function list can be accessed by selecting the Sampled Functions value from the Items to Show dropdown in the Range Details view as shown in the following figure.

Because the function list is created by aggregating samples rather than instrumenting function calls, the accuracy of the function list improves with the number of samples collected. The Sampling Profiler offers three built in sampling intervals. These levels allow you to find a balance between the increased resolution you’ll get with more CPU samples and the additional overhead a higher sampling rate will incur. Also note that Timing Captures can be run for extended periods of time, on the order of hours if needed. The combination of the configurable sampling interval and the extended capture duration can be used to control the number of samples collected, and therefore the accuracy of the function list. The documentation topic for the Sampling Profiler provides a more complete description of using CPU samples to analyze the performance of functions within a title.
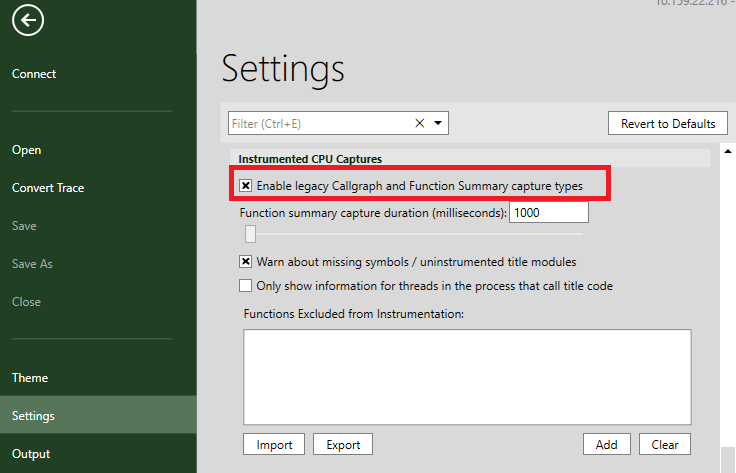
If you should need to access the deprecated Function Summary Captures for any reason, you can do so by selecting the Enable legacy Callgraph and Function Summary capture types checkbox on PIX’s Settings page.

Overview
Function Summary Captures help you quickly find the most expensive functions in your title in terms of execution time. These captures can run for a relatively long period of time, on the order of several seconds. PIX records information about every function that executes while the capture is running. The information PIX collects includes entry and exit counts, inclusive and exclusive execution times, information about the callers and callees for every function, and statistics on inlined functions.
Setting PDB Paths
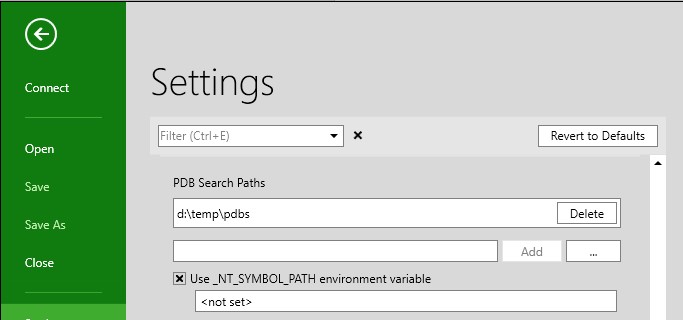
PIX uses your title’s PDBs to determine the addresses of the functions to dynamically instrument. If you’re profiling on the same machine you just built your title on, the path to the PDB that the compiler stored in your title’s modules is typically all PIX needs to locate the PDB. However, there are scenarios in which you’ll need to explicitly tell PIX where your PDBs are located. This situation often occurs if you’re profiling your title on a different machine than the one used to build it. In this case, you can point PIX to your PDBs either by setting the _NT_SYMBOL_PATH environment variable, or by using the “PDB Search Paths” option on PIX’s Settings page.
Initiating a Function Summary Capture
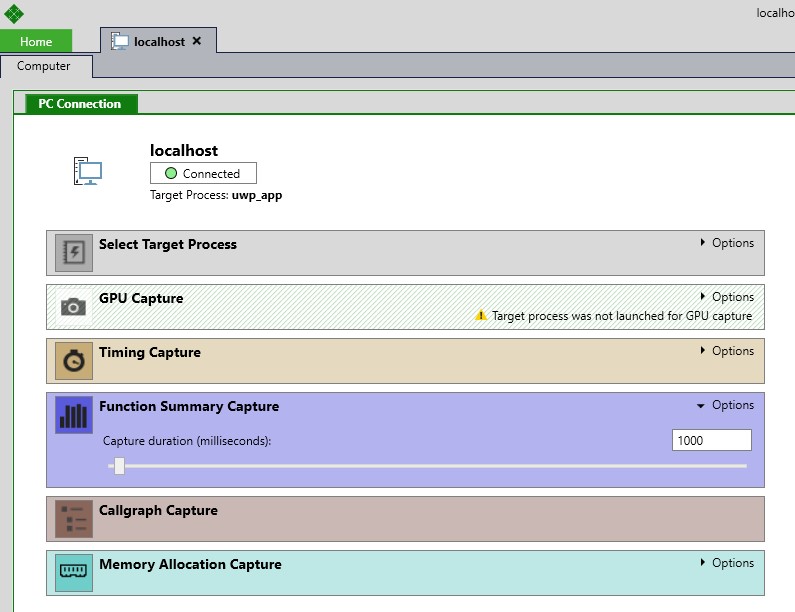
Function Summary captures are initiated using a button on your PC connection tab. By default, Function Summary captures run for one second, but that time duration can be customized by setting the Duration option before you start the capture.

Pressing the Function Summary Capture button will cause the capture to start. The capture will complete and automatically open in PIX after the requested duration has completed.
Function Summary captures open to a tab called a landing page. This initial page provides a textual description of the rest of the tabs in the capture.
The first tab you’ll likely want to look at after the landing page is the Summary Tab.
Capture Summary Tab
The Summary Tab is intended to help you quickly identify the functions in your title that take the longest time to execute. A list of the 5 functions with the largest exclusive time values is provided for every thread in your title that ran title code during the capture.
A hyperlink with source and line number information is included for each function. The source code for a function is opened in your default editor when you click the hyperlink. You can also right click on a hyperlink and select “Open in VS” to open the source in Visual Studio 2015.
In addition to identifying the top 5 most expensive functions, the Summary Tab also provides information about:
- Thread Affinities. For each thread in your title, the Summary Tab will tell you the set of cores that thread is configured to run on. This information is helpful for identifying threads that you had intended to affinitize to one core, but didn’t, for example.
- Inline Functions. Function Summary captures include an analysis of the potential performance impact of the inline functions in our title. More information about this analysis can be found here.
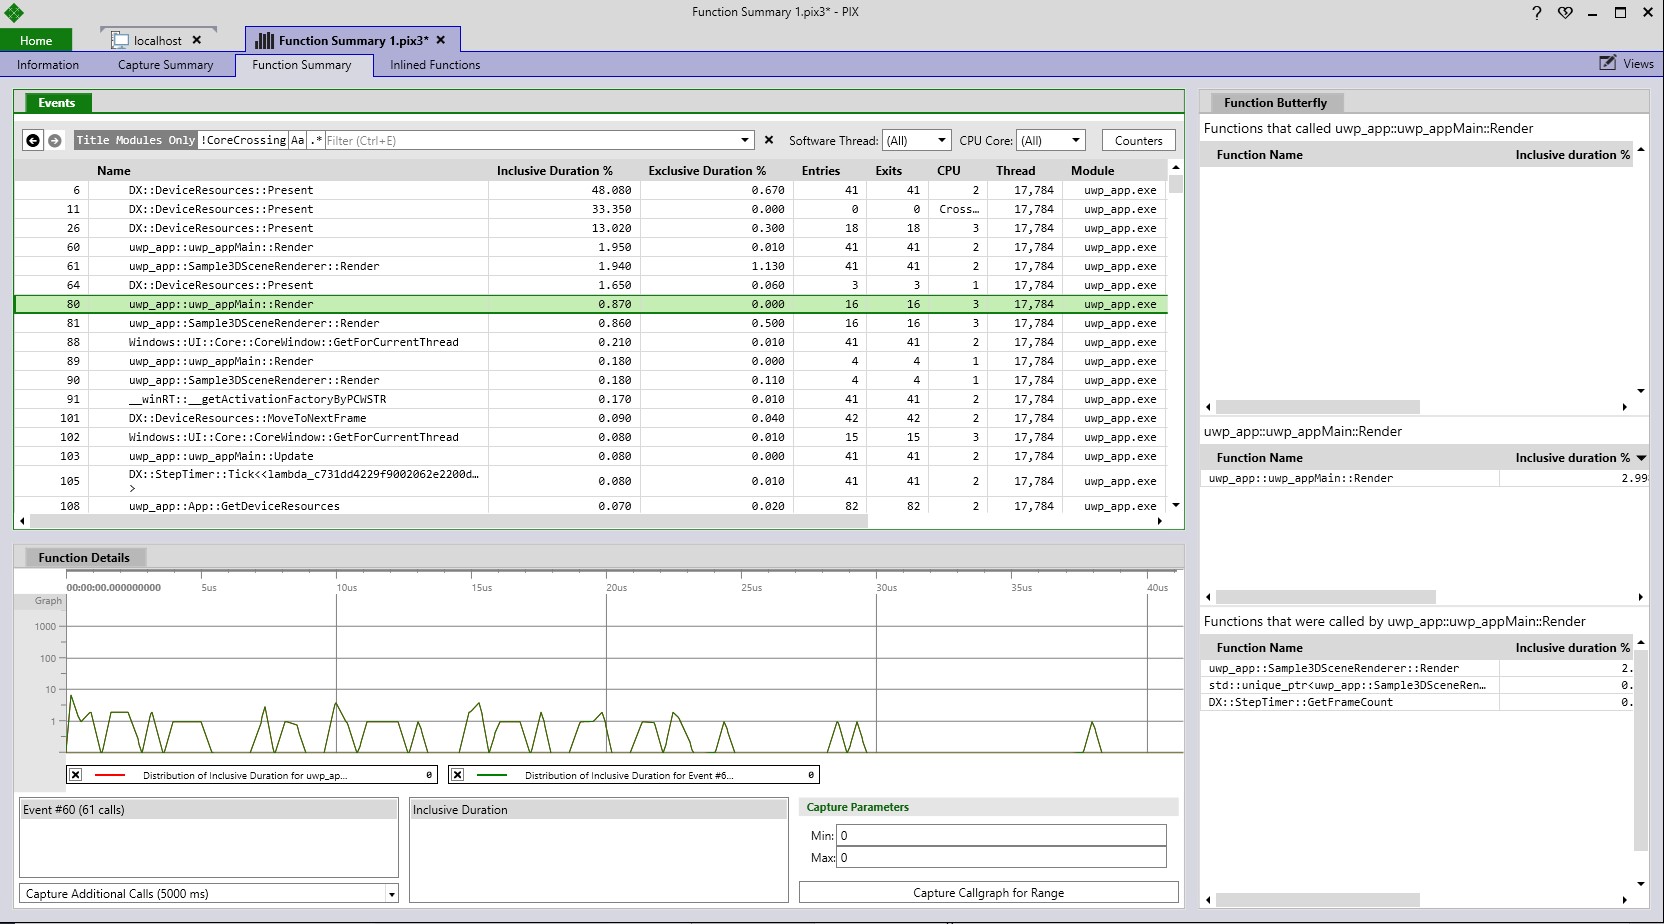
Function Summary Tab
The Function Summary Tab includes an event list that contains one row for every function that was executed during the capture. The event list is typically used to sort the list of functions by a particular counter value, such as inclusive or exclusive duration.

The event list has a set of columns that correspond to a set of counters that you select. Clicking on a column header will sort the list by that value.
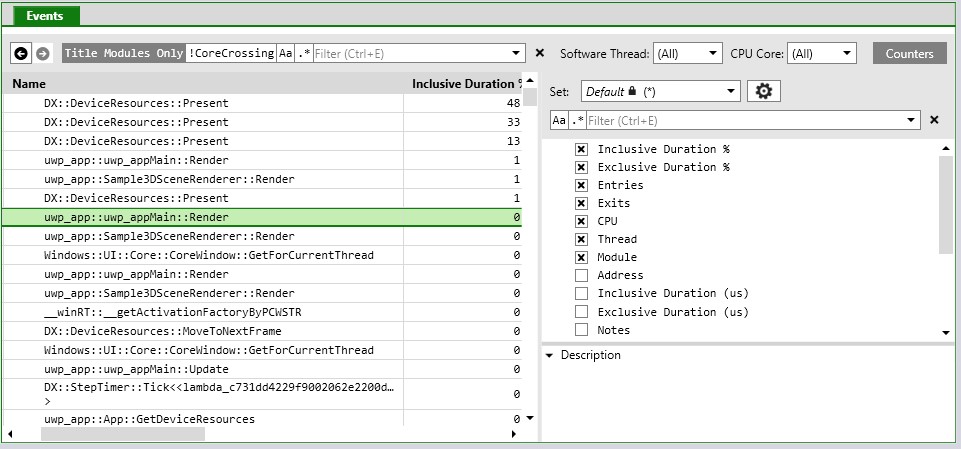
By default, the event list includes columns for Inclusive and Exclusive duration percentages, call counts and so on. You can customize the set of columns that are displayed by selecting a set of counters from a list. Clicking the Counters button will present a list of the counters you can choose from:
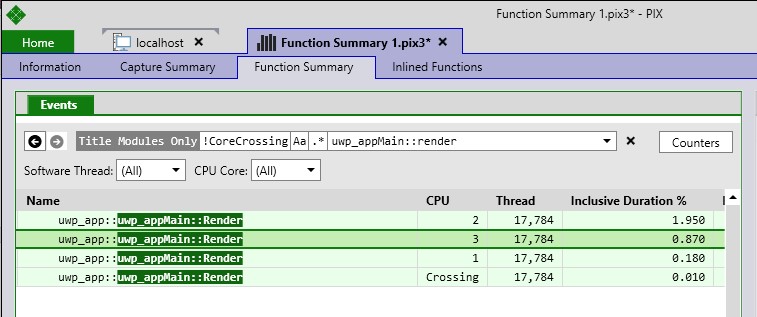
The contents of the event list can also be filtered using the filter bar display just above the list. The filter bar can be used to filter the list down to a set of functions that contain a particular string or that ran on a particular thread or core. The following example shows the event list filtered down to any function that contains the string “render”:
Note that the event list may contain more than one row for any given function. This will occur if the function ran on more than one thread or CPU core during the capture. PIX will show one row per function for each combination of thread and core the function ran on. The following example shows a function that ran on 3 different cores, and crossed from one core to another, while the Function Summary capture was running:
In addition to the events list, the Function Summary Tab provides two additional views in the default layout:
- Butterfly View. The butterfly view shows the set of callers and callees for the function that is currently selected in the events list. See the Butterfly View section for more details.
- Function Histogram. Finding functions that usually execute in a consistent amount of time, but occasionally have an outlier in execution time, is one of the most challenging aspects of performance profiling for game developers. The Function Histogram view can help you find those functions that occasionally spike. See the Function Histogram page for more information.
Function Summary captures provide a high level summary of the relative costs of the functions in your title. After identifying the functions that are taking the most time, you’ll often want to drill into the details of “why”. The next level of detail is provided by an additional capture type called a
Callgraph Capture.


 Light
Light Dark
Dark