
Introducing Application Insights Analytics
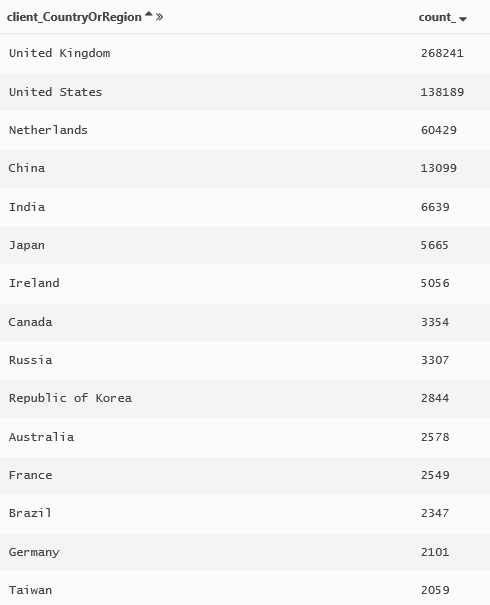
Last month, in a post, I wrote about a VS Team Services outage, I mentioned (and showed some results from) a new tool we’ve been working on that we internally call “Kusto”. We’ve now made a preview of Kusto publicly available as “Application Insights Analytics”. Kusto is a phenomenal tool. I can’t say enough good stuff about it. I can gush about it, without boast, because I can take almost no credit for it. Yes it’s on my team but the folks who have done this have done an astonishing job and all I’ve done is watched. Kusto was already an incubation project when I inherited the team a couple of years ago and over those 2 years it has taken Microsoft by storm. As you might imagine, Microsoft operates a whole lot of cloud services – certainly hundreds, maybe thousands. And many of those run at amazingly high scale. When running many services at large scale, you rely very heavily on telemetry to help you understand what’s happening across your services and to detect, diagnose and repair problems. Kusto (Application Insights Analytics), is a near realtime log analytics platform for interactive data exploration that enables you to do amazing things. Application Insights has had a log search capability for a good while now but Analytics takes it to a whole new level. As of today, Kusto ingests over 1 trillion events and 600TB a day (and growing rapidly – I predict over a PB a day within a few months) of log data across hundreds of Microsoft cloud services. Yes, 600TB a day – that’s many petabytes of retained log storage in just one month. Many of the services you know and love today (like SQL Azure or Team Services) rely on Kusto for their livelihood. And the engineers who use Kusto internally love it. I can’t count the number of people I’ve heard say “I don’t know how I could live without Kusto”. Kusto allows an engineer to query through terabytes of data in seconds, and quickly refine queries until they find what they want. The Application Insights Analytics preview ingests any data the Application Insights SDK sends – built in or custom and allows you to query over it easily from a browser. Let me show you a little Kusto. Here’s a very simple query. “requests” is the name of the table we are querying data from. “timestamp” is a field name that identifies when a datapoint was collected. “summarize” is a little like a SQL group by expression. “order by” says to sort the data by count, descending. Each of these clauses are strung together in sequence by a pipe operator “|”. “count_” is the auto generated field name for the count() of requests for each CountryOrRegion.
requests | where timestamp >= ago(24h) | summarize count() by client_CountryOrRegion | order by count_ desc
Running this over some data from our own Application Insights pre-production environment gives the following results:
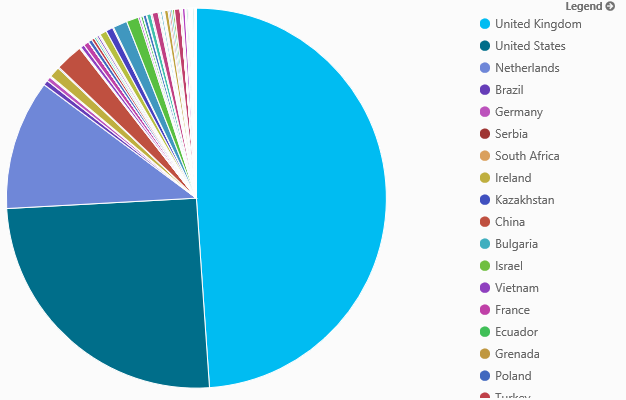
 Modifying the Kusto query to add a “render” clause, easily transforms that into a pie chart. And here I’ve shown how to alias the count() as “requestCount” making longer queries easier to read.
requests | where timestamp >= ago(24h) | summarize requestCount=count() by client_CountryOrRegion | order by requestCount desc | render piechart
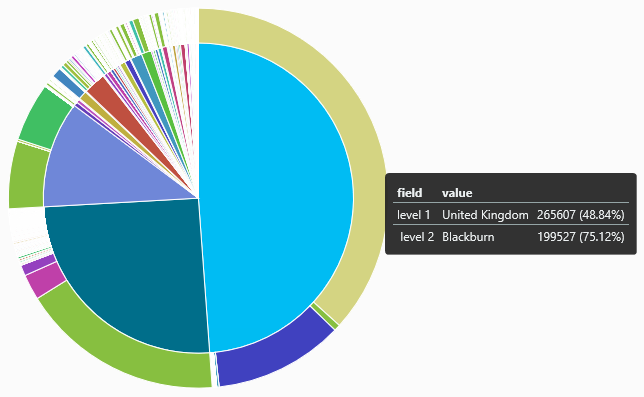
 I can group by multiple fields (Country & City).
requests | where timestamp >= ago(24h) | summarize requestCount=count() by client_CountryOrRegion, client_City | order by requestCount desc | render piechart
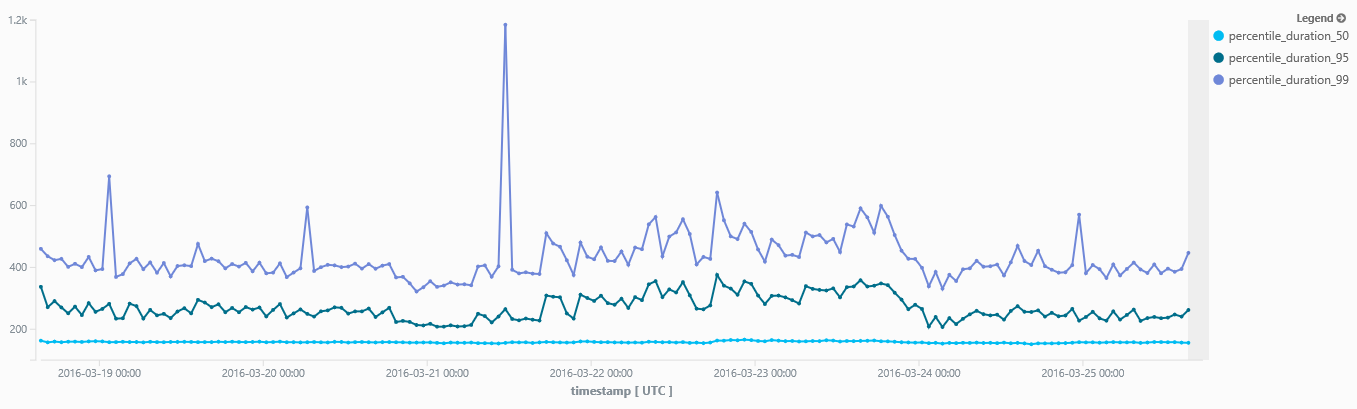
 OK, that was really more of a usage scenario. Let’s look at a bit more of a dev/diagnostics scenario. We’ll use the same requests table to look at performance of requests over the past 7 days. Here we summarize the 50th, 95th and 99th percentiles into 1 hour buckets and render it into a “timechart”.
requests | where timestamp >= now(-7d) | summarize percentiles(duration,50,95,99) by bin (timestamp, 1h) | render timechart
 Application Insights Analytics comes with 8 “tables’ that capture the various types of telemetry that the Application Insights SDK produces. It also enables you to easily explore that schema.

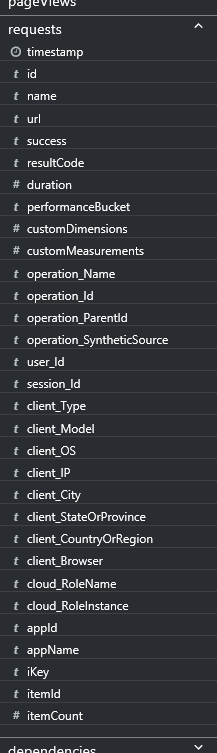 One of the cool things about Application Insights Analytics is that it’s easy to do joins across these logical tables like you can in SQL. Here’s a query that joins requests and exceptions to get a count of exceptions for each type of request.
requests | where timestamp > ago(2d) | where success == “False” | join kind=leftouter ( exceptions | where timestamp > ago(2d) ) on operation_Id | summarize exceptionCount=count() by operation_Name | order by exceptionCount desc
 That’s just a tiny taste of the kinds of things you can do with Application Analytics. It’s very powerful. You can read more about it in the Application Insights Analytics docs and you can learn more about everything Application Insights has to offer.. You can also run queries over the log data and export the results to PowerBI and use the full reporting power of Power BI to create great visualizations. For the moment, we have retention set to 8 days. Over time, we’ll make more retention options available – but 8 days is generally plenty for trouble shooting of live site incidents. High scale apps using Application Insights may be sampled by the SDK. Refer to this documentation on how sampling works in Application Insights. Please refer to analytics documentation on how to write queries for such sampled apps.
Application Insights Analytics has a browser based UI that any one can get to from the new (Ibiza) Azure portal. It’s very nice but the real power is in the data and query engines. I’ve seen teams build some amazing things on top of it. For instance, the SQL Azure team has built an auto-remediation system that queries Kusto to identify problems and then automates common recovery practices. In fact, based on the February telemetry, only about 1.2 million of the ~91 million Kusto queries were interactive. Almost 90 million of them were driven by automated tools people have written to mine Kusto data. We haven’t exposed the APIs to do this yet externally but will do so shortly.
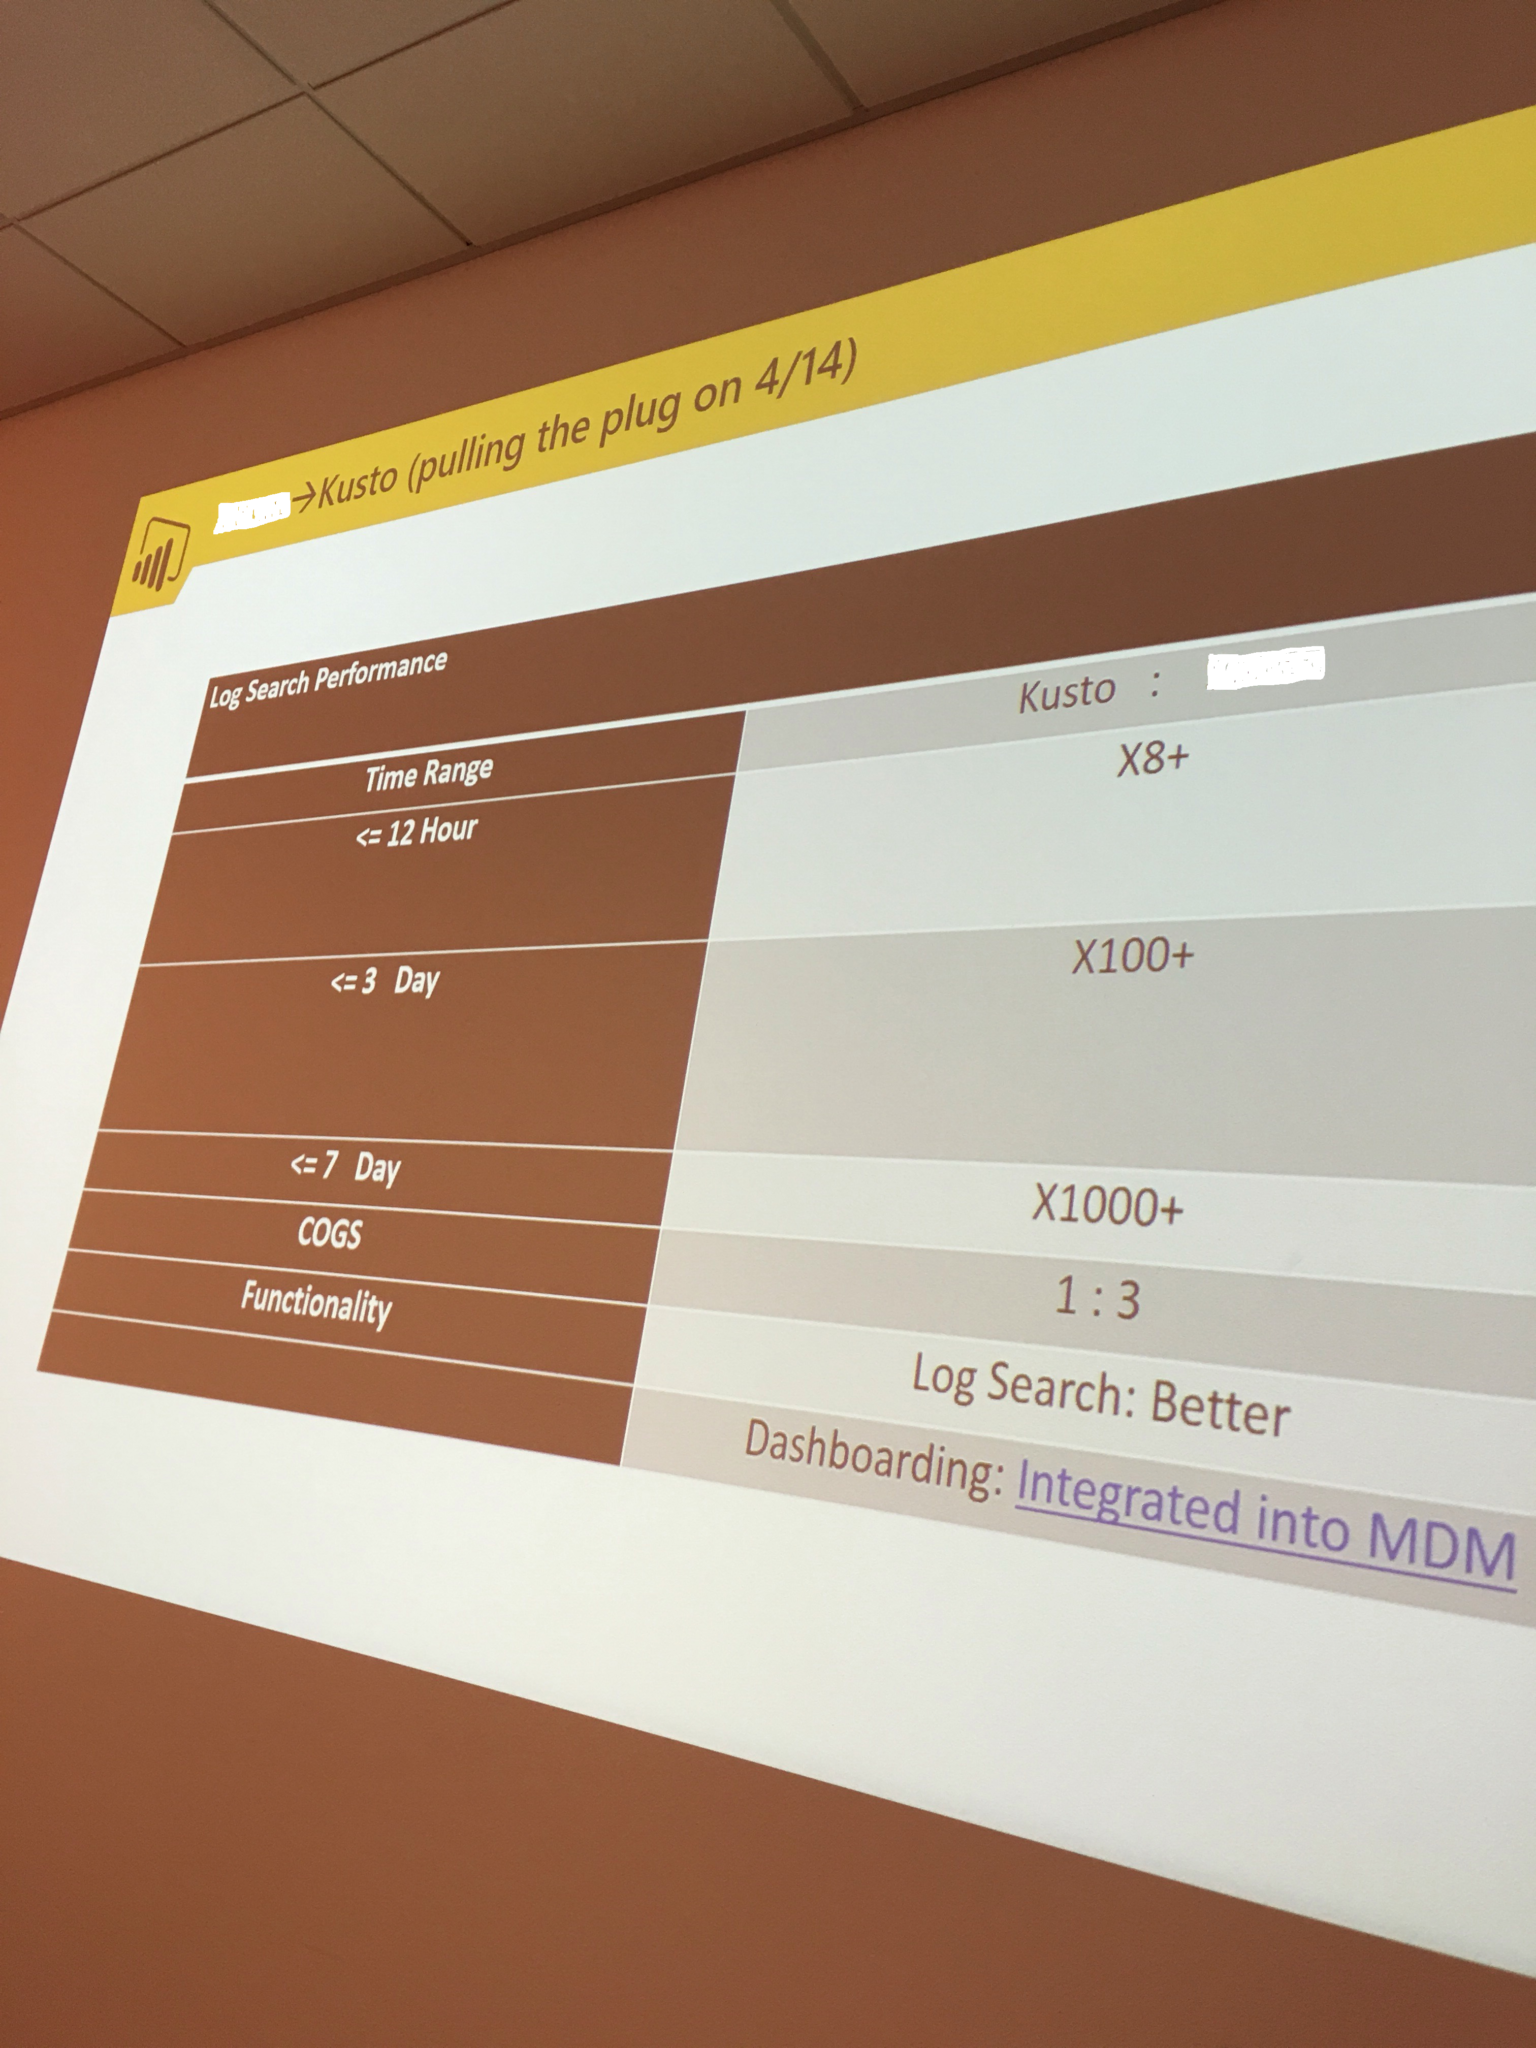
The powerful and interactive query capability is awesome but the thing that truly blows people away is the performance over very large amounts of data. A year or so ago, the PowerBI team decided they needed a good log analytics solution. Kusto wasn’t nearly ready so they chose a 3rd party solution (I’m not going to name them because it’s not my style to ding other people, but it’s one of the big ones). To be honest, they liked it very much. When we got Kusto to the point that it was ready, it took some arm twisting to get them to even be willing to consider switching. We recently completed a Proof Of Concept and below is a picture (from a cell phone :)) of a summary comparison slide the PowerBI team presented to their own org explaining why they need to switch to Kusto. The difference is mind blowing. You can see performance up to 1000 times faster, a more powerful query engine and 1/3rd the cost. Now, you have to take the cost with a pinch of salt. It’s really apples to oranges because we are comparing the retail cost of the competitor to the operational cost of Kusto. I suspect by the time we commercialize it, pay for engineering costs and make a small profit, it will be a comparable cost to the main competitors, but – the capability of the product is *so* much higher.
That’s just a tiny taste of the kinds of things you can do with Application Analytics. It’s very powerful. You can read more about it in the Application Insights Analytics docs and you can learn more about everything Application Insights has to offer.. You can also run queries over the log data and export the results to PowerBI and use the full reporting power of Power BI to create great visualizations. For the moment, we have retention set to 8 days. Over time, we’ll make more retention options available – but 8 days is generally plenty for trouble shooting of live site incidents. High scale apps using Application Insights may be sampled by the SDK. Refer to this documentation on how sampling works in Application Insights. Please refer to analytics documentation on how to write queries for such sampled apps.
Application Insights Analytics has a browser based UI that any one can get to from the new (Ibiza) Azure portal. It’s very nice but the real power is in the data and query engines. I’ve seen teams build some amazing things on top of it. For instance, the SQL Azure team has built an auto-remediation system that queries Kusto to identify problems and then automates common recovery practices. In fact, based on the February telemetry, only about 1.2 million of the ~91 million Kusto queries were interactive. Almost 90 million of them were driven by automated tools people have written to mine Kusto data. We haven’t exposed the APIs to do this yet externally but will do so shortly.
The powerful and interactive query capability is awesome but the thing that truly blows people away is the performance over very large amounts of data. A year or so ago, the PowerBI team decided they needed a good log analytics solution. Kusto wasn’t nearly ready so they chose a 3rd party solution (I’m not going to name them because it’s not my style to ding other people, but it’s one of the big ones). To be honest, they liked it very much. When we got Kusto to the point that it was ready, it took some arm twisting to get them to even be willing to consider switching. We recently completed a Proof Of Concept and below is a picture (from a cell phone :)) of a summary comparison slide the PowerBI team presented to their own org explaining why they need to switch to Kusto. The difference is mind blowing. You can see performance up to 1000 times faster, a more powerful query engine and 1/3rd the cost. Now, you have to take the cost with a pinch of salt. It’s really apples to oranges because we are comparing the retail cost of the competitor to the operational cost of Kusto. I suspect by the time we commercialize it, pay for engineering costs and make a small profit, it will be a comparable cost to the main competitors, but – the capability of the product is *so* much higher.
 All in all, Kusto is an amazing phenomenon and I’m excited to be making it public as Application Insights Analytics. It’s game changing for a serious DevOps practice. The Application Analytics service is still in preview and the web UI isn’t as good as I’d like it to be yet (in full transparency, most internal teams have been using a WPF UI that we built for Kusto and we are in the process of porting that to the browser but it’s not finished yet). Over the next few months we’ll finish building it out and I think you will love it. I encourage you to give it a try and let us know what you think.
Just for fun, I skimmed my email from the past few months and grabbed a handful of quotes from emails people have spontaneously sent me about Kusto/Application Insights Analytics. Some of these are from internal teams and some are from external customers who have participated in the preview. They give you a flavor of how amazing the product is. I didn’t make any of these up. They are spontaneous compliments that people sent just because they were so excited. I’ve had a long career and there are very few products anywhere, by any company, that I’ve seen have the kind of effect that Kusto has.
All in all, Kusto is an amazing phenomenon and I’m excited to be making it public as Application Insights Analytics. It’s game changing for a serious DevOps practice. The Application Analytics service is still in preview and the web UI isn’t as good as I’d like it to be yet (in full transparency, most internal teams have been using a WPF UI that we built for Kusto and we are in the process of porting that to the browser but it’s not finished yet). Over the next few months we’ll finish building it out and I think you will love it. I encourage you to give it a try and let us know what you think.
Just for fun, I skimmed my email from the past few months and grabbed a handful of quotes from emails people have spontaneously sent me about Kusto/Application Insights Analytics. Some of these are from internal teams and some are from external customers who have participated in the preview. They give you a flavor of how amazing the product is. I didn’t make any of these up. They are spontaneous compliments that people sent just because they were so excited. I’ve had a long career and there are very few products anywhere, by any company, that I’ve seen have the kind of effect that Kusto has.
- “Kusto is awesome. I’ve really gotten into it in the past month. It is the first product in a long time that makes me find excuses so that I can use it.”
- “AppAnalytics is really super useful! We’ve identified perf bottlenecks by looking at dependency data (find requests that consume the most SQL Queries on average). I’m now training this to all dev teams here, and people are really excited. This is useful stuff”
- “Kusto is freaking awesome. Kills everything else out there. I really like the attention to having a good UI as well. Query performance is outstanding versus everything else. Don’t know what magic mojo your team has but keep up the great work!”
- “I’ve been 10 years @ Microsoft and this is definitely one of the best products I’ve seen”
- “I am very excited about application Analytics, I learn more and use it every day. I am looking forward when Export to PowerBI will be available so we can embed life metrics graph into a web page and share with others.” (as you read above, export to PowerBI is now available)
- “You probably already know this but … that product is absolutely amazing. It is also super addicting … at times I find myself making an excuse to write a query to gain more insight about an area just prior to a meeting.”
- “First, we LOVE the kusto system, it’s awesome! Kusto is CRITICAL to our product planning/engineering process”
- “Kusto is the only platform which allows combing metric and logs together. The key value is that it has rich client side API and allow us to easy to integrate with many tools and also build solutions on top of it.”
- “Kusto is super awesome, using it daily and it’s taking off in my group”
- “Our Azure SQL team has been used the Kusto bigdata solution from AppInsight for one year. Today, our service cannot run smoothly without it.”
- “The capabilities in the tool are phenomenal. Their current users love it, and anyone who sees it is impressed. The integrated visualization, intellisense, is great. This is a tool built by engineers for engineers, and it shows… if I were to mention taking it away I would face a massive revolt from the ranks :)”
Thanks, Brian
 Light
Light Dark
Dark
0 comments