
A bit more on the Feb 3 and 4 incidents
Please read my post from yesterday first. Unfortunately I had a family commitment and had to leave early Friday afternoon before the post was complete. I asked someone on my team to finish it and he did an excellent job and I’m grateful. There are a few things I would yet like to add to the discussion. First I want to emphasize point #4 from the second incident. And note, I described the incidents in order of “worst” incident first. Actually, the second incident happened the day before the first one. That blip out to the right of the graph in the second incident was actually an occurrence of the very same issue that caused the incident on the following day. The fact that we assumed it was some after effect of the previous incident and simply failed over the SQL Server and assumed that everything was OK because everything was fine afterwards infuriates me. I can’t count how many times I’ve said “Root cause every incident.” You can’t, can’t, can’t just “hit the reset button” and say “that fixed it”. All that did was mitigate it. The problem is still there. Now, I understand, it was the end of a long incident that started in the middle of the night and I’m sure everyone desperately wanted to go back to bed. It might have been a fine mitigation for the time but a retroactive investigation should have been started the next day. This is fundamental.
I also want to comment on point #1. I’ve spent a fair amount of time talking with people about this. My first reaction was “Deleting DNS entries? That seems like a pretty major thing to do and is worth extra care. When the cleanup algorithm identifies a DNS entry to be deleted, shouldn’t we have an independent piece of code that double checks the entry we’re about to delete?” I discovered that with no help from me, the team has already gone ahead and done that (and it’s already in production). In fact, they added 3 last minute validation checks that the structure of the DNS entry they are deleting matches what they expect (the inappropriately deleted ones did not) and that key elements (like account name segment) of the DNS entry matches the account they think they are trying to delete the DNS entry for.
But the other thing that bugged me about this incident and I’d add as learning #5 is that we aren’t ever supposed to have a change that effects the whole service at the same time. Every change is supposed to roll out across the service such that, in the event there is an issue, it only affects a subset of the service and can be halted before doing more damage (and BTW, the instance that our account is on always goes first). The one exception to this rule, as I mention in the learning section from the first post is SPS service updates and we are working on making that multi-instance now. This DNS entry deletion job did a global garbage collection across the entire service and didn’t partition that process in any way so, when it started deleting incorrect DNS entries, it did it for every instance, rather than just 1 or 2. We’ve added another repair item to go address this. I believe the double check defense already put in place will dramatically decrease the possibility of a recurrence, but I want the rule always followed – all activity rolls out across the service in a controlled way – no activities are global to the service. This job was an “old” job and predated us having a lot of instances, so hadn’t been coded for that. We need to look and see if we have more things like this.
One of the engineers on the team spent yesterday scouring all of our telemetry to figure what signal we could have/should have used to know something was wrong and needed attention before we had a major incident (I’m referring to incident #1 in my previous post). He came up with some interesting graphs that I thought I’d share for insights into precursors.
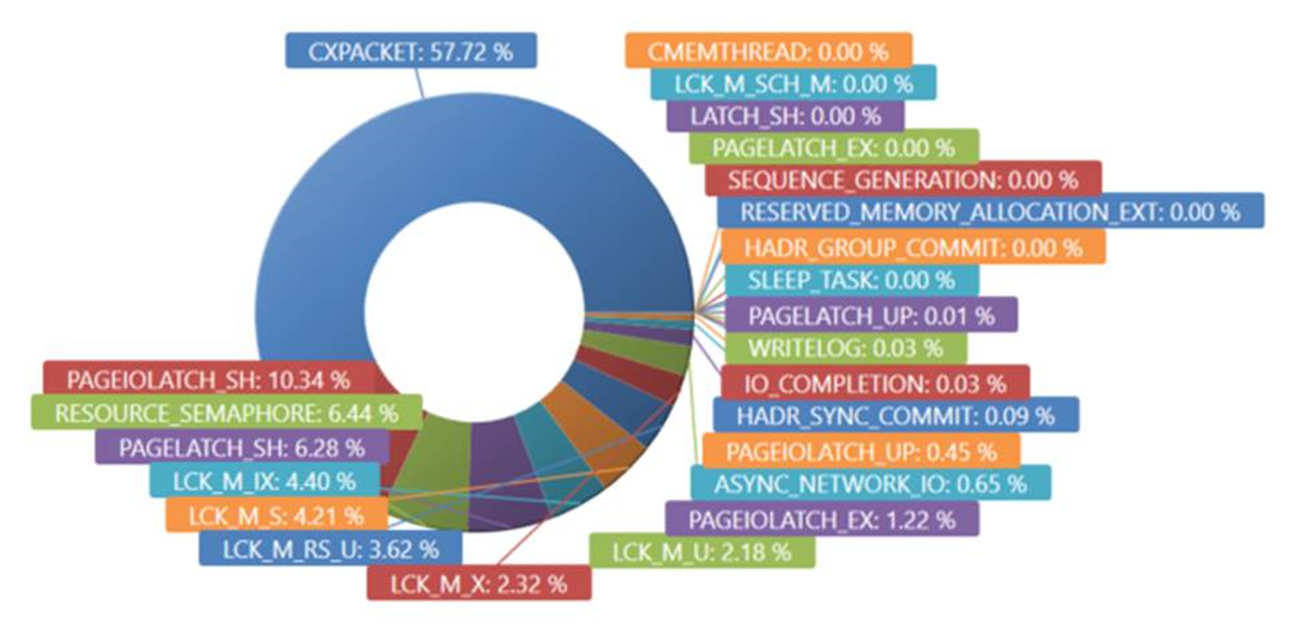
Here is a look at all of the SQL wait types before we changed the SQL compat level. From here you can see that the top wait type is CXPACKET with says that some parallelized portion of a query is waiting on another parallelized portion to complete. Without getting into a discussion of whether this could be optimized, let’s look at the same chart from after the compat level change.
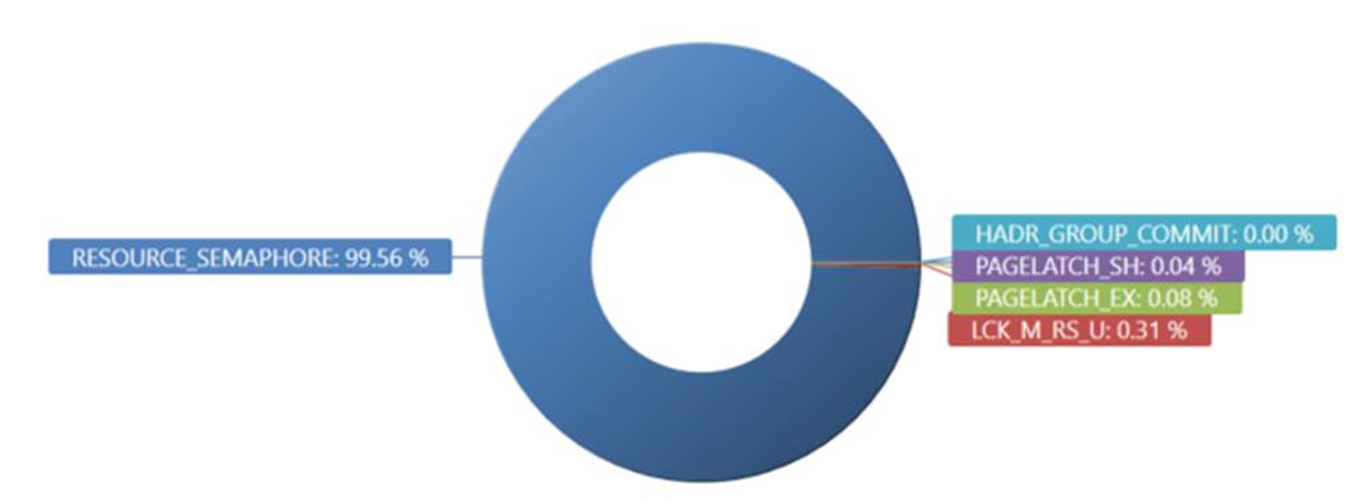
Here you can see a VERY different picture.Wait Types of RESOURCE_SEMAPHORE (which means waiting on a memory grant) now completely dominate. This is an interesting indicator that “something” has gone amok.
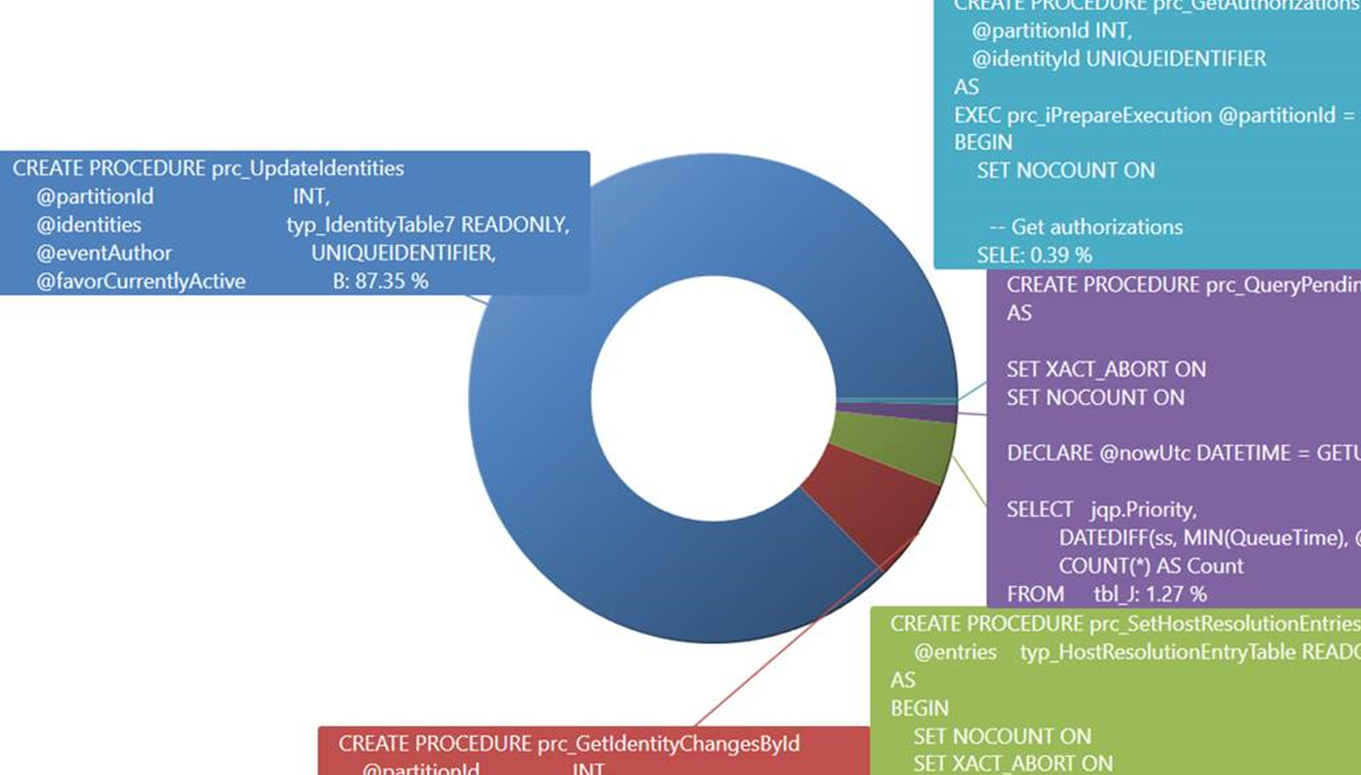
Drilling further by looking at what sprocs are waiting on RESOURCE_SEMAPHORE, we see that prc_UpdateIdentities dominates. Guess what… That’s the sproc that caused this incident.
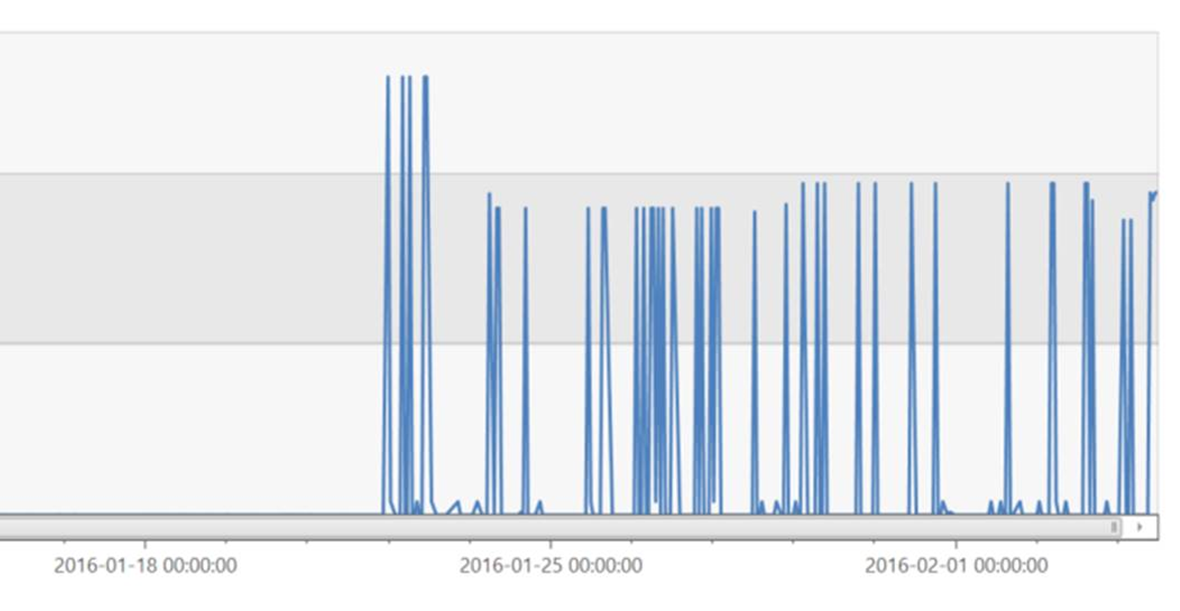
And now, let’s look at a time chart of memory grant requests for this sproc. The huge spikes begin the moment we introduced the change to SQL compat level. This is a fantastic opportunity for automated anomaly detection. There’s no reason we can’t find this kind of thing long before it creates any actual incident. Getting all of the technology hooked up to make this possible and know which KPIs to watch isn’t easy and will take some tuning but all the data is here.
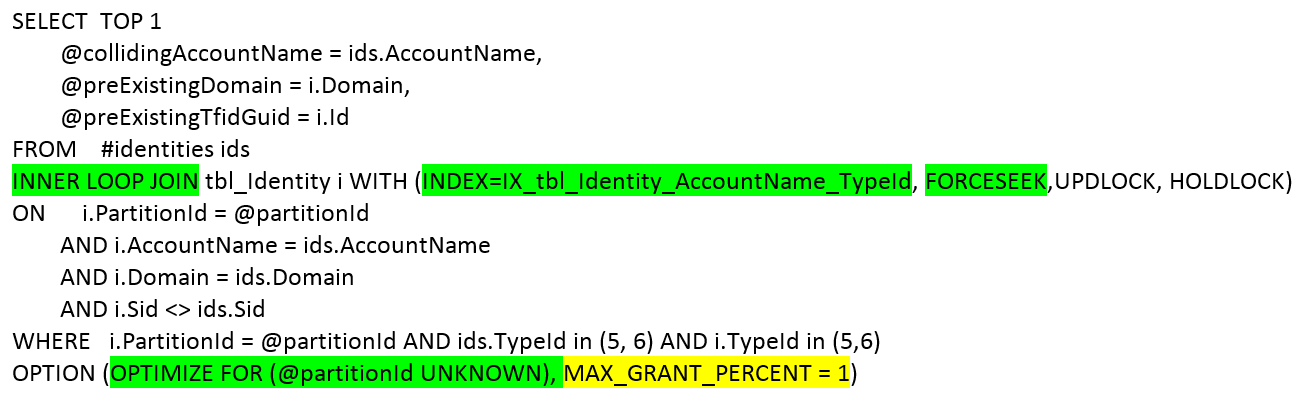
The last thing I want to cover here before wrapping up is the query that caused the problem. Actually there were two in the same sproc that each had the issue but we’ll just look at one of them.
There are two things I want to point out in the query below. I’ve talked in the past about how sensitive SQL performance is to query plans when the data gets extremely large but I haven’t given many examples. When a table is small, it almost doesn’t matter what the query plan is. When it’s medium an OK query plan is fine. When it’s huge (millions upon millions or billions of rows) a tiny, slight variation in query plan can kill you. So, we hint our sensitive queries heavily. We encourage the query optimizer to pick a plan that we know may not always perform the absolute best for every possible scenario but performs well and will never perform horribly for any scenario.
I’ve highlighted the query plan hints in green. I’ve generally found this kind of hinting to be viable/maintainable and critical at scale. I’ve also highlighted in yellow the short term fix we put in to cap the memory grant. This change is not viable/maintainable in the long term but ended the incident while we work with the SQL team on a long term fix.
Wrapping up this incident for now with some final thoughts…
Both of these two incidents were unacceptable. We know it. We’re continuing to analyze and learn from them and put in place long term solutions to the problems we find. We know we will never completely eliminate bugs and incidents. That’s an unattainable goal. What I believe we can do is reduce the count, reduce the severity, contain them to fractions of the service (both in customers and in functionality), detect them earlier and avoid outages and mitigate outages faster. We’ll be working on all of those things. Thank you for your understanding and patience. I can honestly say that outages of this magnitude are not “normal” for us. I think it’s been over a year since I had to write an “apology post” due to the severity of an incident. I hope it’s well more than a year before I have to write the next.
In these two posts, I have included a ton of data and visualizations. You might be wondering where all that comes from. It comes from one of the most awesome tools that I’ve ever used – internally called “Kusto”. It is a part of our Application Insights suite being developed in my team. Pay attention at the //Build/ conference. We’re going to be talking about it. We’ve already got many dozens, maybe hundreds of services across Microsoft using it and it is ingesting/querying ~300TB of telemetry per day and growing VERY rapidly.
Thanks for listening, Brian
 Light
Light Dark
Dark
0 comments