
Troubleshooting ASP.NET Core Performance Problems
This is a guest post by Mike Rousos
I recently had an opportunity to help a developer with an ASP.NET Core app that was functionally correct but slow when under a heavy user load. We found a few different factors contributing to the app’s slowdown while investigating, but the majority of the issues were some variation of blocking threads that could have run in a non-blocking way. It was a good reminder for me just how crucial it is to use non-blocking patterns in multi-threaded scenarios like a web app.
Beware of Locks
One of the first problems we noticed (through CPU analysis with PerfView) was that a lot of time was spent in logging code paths. This was confirmed with ad hoc exploration of call stacks in the debugger which showed many threads blocked waiting to acquire a lock. It turns out some common logging code paths in the application were incorrectly flushing Application Insights telemetry. Flushing App Insights requires a global lock and should generally not be done manually during the course of an app’s execution. In this case, though, Application Insights was being flushed at least once per HTTP request and, under load, this became a large bottleneck!
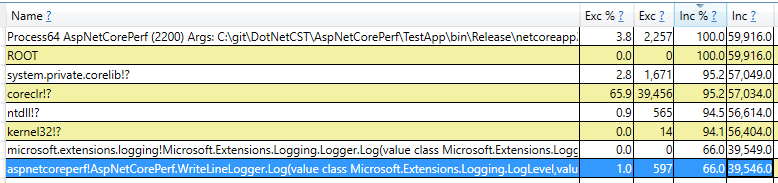
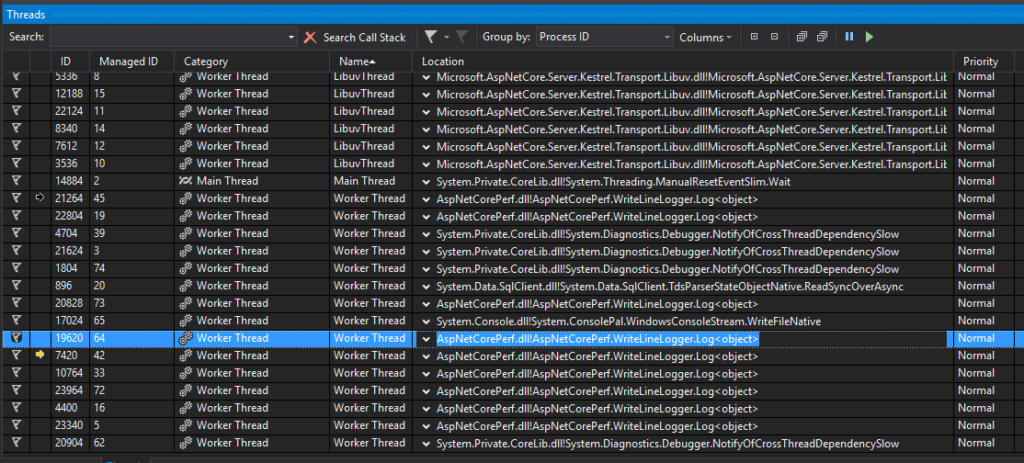
You can see this sort of pattern in the images below from a small repro I made. In this sample, I have an ASP.NET Core 2.0 web API that enables common CRUD operations against an Azure SQL database with Entity Framework Core. Load testing the service running on my laptop (not the best test environment), requests were processed in an average of about 0.27 seconds. After adding a custom ILoggerProvider calling Console.WriteLine inside of a lock, though, the average response time rose to 1.85 seconds – a very noticeable difference for end users. Using PerfView and a debugger, we can see that a lot of time (66% of PerfView’s samples) is spent in the custom logging method and that a lot of worker threads are stuck there (delaying responses) while waiting for their turn with the lock.
ASP.NET Core’s Console logger used to have some locking like this in versions 1.0 and 1.1, causing it to be slow in high-traffic scenarios, but these issues have been addressed in ASP.NET Core 2.0. It is still a best practice to be mindful of logging in production, though.
For very performance-sensitive scenarios, you can use LoggerMessage to optimize logging even further. LoggerMessage allows defining log messages ahead-of-time so that message templates don’t need to be parsed every time a particular message is logged. More details are available in ourdocumentation, but the basic pattern is that log messages are defined as strongly-typed delegates:
// This delegate logs a particular predefined message
private static readonly Action<ILogger, int, Exception> _retrievedWidgets =
    LoggerMessage.Define<int>(
        LogLevel.Information,
        new EventId(1, nameof(RetrievedWidgets)),
        "Retrieved {Count} widgets");

// A helper extension method to make it easy to call the
// LoggerMessage-produced delegate from an ILogger
public static void RetrievedWidgets(this ILogger logger, int count) =>
    _retrievedWidgets(logger, count, null);
Then, that delegate is invoked as needed for high-performance logging:
var widgets = await _dbContext.Widgets.AsNoTracking().ToListAsync();
_logger.RetrievedWidgets(widgets.Length);
Keep Asynchronous Calls Asynchronous
Another issue our investigation uncovered in the slow ASP.NET Core app was similar: calling Task.Wait() or Task.Result on asynchronous calls made from the app’s controllers instead of using await. By making controller actions async and awaiting these sorts of calls, the executing thread is freed to go serve other requests while waiting for the invoked task to complete.
I reproduced this issue in my sample application by replacing async calls in the action methods with synchronous alternatives. At first, this only caused a small slowdown (0.32 second average response instead of 0.27 seconds) because the async methods I was calling in the sample were all pretty quick. To simulate longer async tasks, I updated both the async and synchronous versions of my sample to have a Task.Delay(200) in each controller action (which, of course, I used await with when async and .Wait() with when synchronous). In the async case, average response time went from 0.27s to 0.46s which is more or less what we would expect if each request has an extra pause or 200ms. In the synchronous case, though, the average time went from 0.32 seconds to 1.47 seconds!
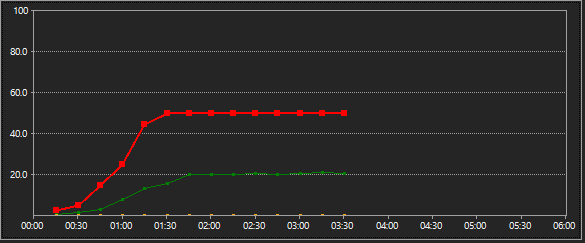
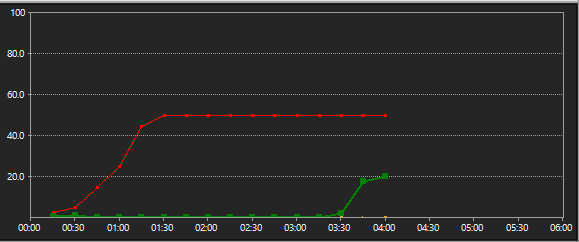
The charts below demonstrate where a lot of this slowdown comes from. The green lines in the charts represent requests served per second and the red lines represent user load. In the first chart (which was taken while running the async version of my sample), you can see that as users increase, more requests are being served. In the second chart (corresponding to theTask.Wait() case), on the other hand, there’s a strange pattern of requests per second remaining flat for several minutes after user load increases and only then increasing to keep up. This is because the existing pool of threads serving requests couldn’t keep up with more users (since they were all blocked on Task.Wait() calls) and throughput didn’t improve until more threads were created.
Attaching a debugger to both scenarios, I found that 75 managed threads were being used in the async test but 232 were in use in the synchronous test. Even though the synchronous test did eventually add enough threads to handle the incoming requests, calling Task.Result and Task.Wait can cause slowdowns when user load changes. Analyzers (like AsyncFixer) can help to find places where asynchronous alternatives can be used and there are EventSource events that can be used to find blocking calls at runtime, if needed.
Wrap-Up
There were some other perf issues in the application I helped investigate (server GC wasn’t enabled in ASP.NET Core 1.1 templates, for example, something that has been corrected in ASP.NET Core 2.0), but one common theme of the problems we found was around blocking threads unnecessarily. Whether it’s from lock contention or waiting on tasks to finish, it’s important to keep threads unblocked for good performance in ASP.NET Core apps.
If you’d like to dig into your own apps to look for perf trouble areas, check out the Channel9 PerfView tutorials for an overview of how PerfView can help uncover CPU and memory-related perf issues in .NET applications.
 Light
Light Dark
Dark
0 comments