
Remote Debug ASP.NET Core RC1 on Azure App Service
ASP.NET developers who deploy their code to Azure App Service have remote debugging features available from the Visual Studio Server and Cloud Explorer windows. ASP.NET 4x projects can be debugged live in App Service by simply right-clicking your Web, Mobile, or API Apps in Cloud Explorer and clicking the “Attach Debugger” action. Under the hood, what happens during a remote debugging session is that the Visual Studio remote debugger attaches to the W3WP.exe process, in which the ASP.NET 4.x code executes. Since ASP.NET Core RC1 code is executed within the DNX.exe process, the remote debugging feature fails to light up breakpoints in ASP.NET Core applications automatically. This blog post will demonstrate in screen shots and a 2-minute video how ASP.NET Core developers can reap the benefits of remote debugging, too.
Remote Debugging made easy
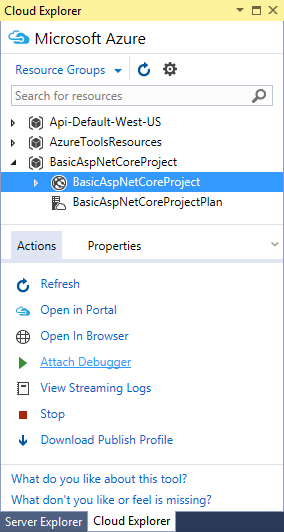
Attaching to the remote debugger is simple. Below is a screen shot of the Cloud Explorer in Visual Studio, which exposes a series of actions hanging off of each Azure resource in my subscription. Note the “Attach Debugger” action in the bottom pane of the window. By clicking this action your Visual Studio instance will reach out to Azure and create a connection to the debugger process running in the App Service fabric.
As outlined in the original blog post announcing the availability of remote debugging, the debugger attaches to the W3WP.exe process, which hosts ASP.NET 4.x code in both IIS and on Azure App Service. Since ASP.NET Core RC1 applications run in the DNX.exe host process, attaching to the remote debugger via the traditional gesture in Cloud or Server explorer fails to enable your ASP.NET Core code breakpoints.
Attach to the DNX.exe Process
Luckily, the Visual Studio remote debugger offers you the capability of connecting to any of the running process on your Azure App Service. In fact, this ability is one of the reasons we’re able to enable remote debugging of your Azure WebJobs, which run as individual processes under the App_Data folder of your App Services (but that’s another story for another blog post).
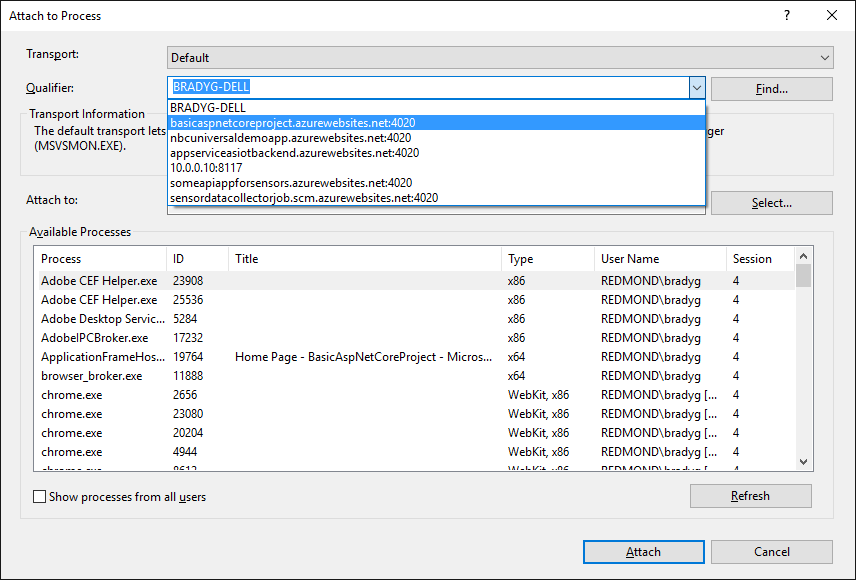
In the video below you’ll see that I initialize a remote debugging session in the traditional manner, by clicking the Attach Debugger action in Cloud Explorer. Then I click on the Debug –> Attach to Process context menu item to pull up the Attach to Process dialog, shown below. Once open, I can select the site I want to debug from the Qualifier menu.
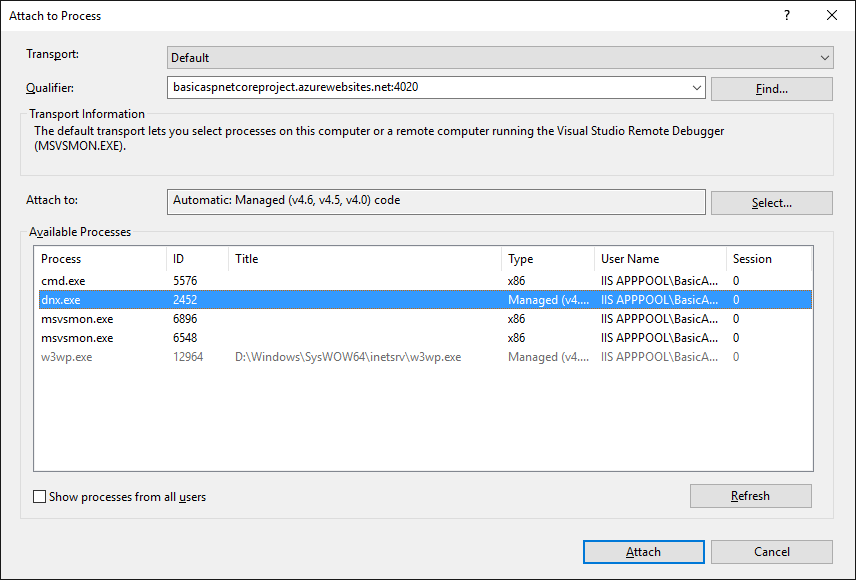
Once I select the desired Web App I want to debug from the menu the list of processes running on that App Service is visible. By clicking on the process named dnx.exe, I can attach to the host process running my ASP.NET Core code.
The video below demonstrates the entire process of attaching to a remote debugger instance so I can step through my ASP.NET Core code running live in Azure App Service. In under three minutes I’m able to connect my local Visual Studio instance to the code running in App Service.
Next Steps
This blog post demonstrates how to debug your ASP.NET Core applications during the RC1 time frame, which uses the process name dnx.exe. In the RC2 time frame the process name will change from being dnx.exe. When RC2 is released, we’ll provide guidance on attaching to ASP.NET Core RC2 apps on this blog, as well as when the ASP.NET Core framework reaches RTM and beyond. We’re also working on adding one-click support for ASP.NET Core applications to the Visual Studio tools as well, so that in the future you won’t need to perform the manual “Attach to Process” step. We’ll keep you posted on the progress of that tooling on this blog, too.
For now, enjoy the debugging capabilities with your ASP.NET Core RC1 code on Azure App Service!
 Light
Light Dark
Dark
0 comments