
You Should Never See This Callstack in Production
A customer who just experienced some server outage asked us for help as they thought it was due to some very long GC pauses. I thought this diagnostics exercise might be useful for other folks as well so I am sharing it with you.
We had them collect a GCCollectOnly trace which showed there were some very long induced gen2 blocking GCs. And they are using Server GC which means we wanted stacks for the GCTrigger event which would show us exactly who induced these GCs. For Server GC the GCStart event is actually fired on one of the Server GC threads which would mean it’s not useful for figuring out who triggered the GC so we have this GCTrigger event to help exactly with that. However GCCollectOnly traces do not include stacks for CLR events so we asked them to collect some more traces for us with this perfview command line:
PerfView.exe /nogui /accepteula /BufferSizeMB:4096 /CircularMB:2000 /CollectMultiple:3 /StopOnGcOverMsec:3000 /DelayAfterTriggerSec:0 /KernelEvents:Memory,VirtualAlloc,Default /Process:”w3wp” /OnlyProviders:”ClrPrivate:1:5,Clr:0x40000001:5″ /NoRundown /NoNGenRundown /NoClrRundown /Merge:true /Zip:true collect
Yes I know it’s a very long command so let me break it down for you. I am intentionally putting things on separated lines so it’s easier to read –
Collect a trace with default kernel events + some memory events (specified with /KernelEvents:Memory,VirtualAlloc,Default – Default is there for things like being able to decode process names so you don’t get a trace where each process is only indicated by its process ID and it also includes the CPU sample events which we want in this case as we’d like to see which part of the work is expensive in GC); since we are collecting a trace to diagnose GC problems we are generally also interested in the OS memory events)
and CLR GC events at verbose level with stacks for the public GC events (specified with /OnlyProviders:”ClrPrivate:1:5,Clr:0x40000001:5″ – keyword 1 for both CLR public and private providers means GC and the 0x40000000 in the Clr public provider means collect stacks for those events. We do this so we get stacks with the GCTriggered event)
and when you detect a GC longer than 3s (specified with /StopOnGcOverMsec:3000)
in the w3wp.exe process (specified with /Process:”w3wp”, note that you specify w3wp, not w3wp.exe here)
stop the trace immediately when you detect that long GC (specified with /DelayAfterTriggerSec:0)
don’t do any rundown events (specified with /NoRundown /NoNGenRundown /NoClrRundown)
merge and zip the trace (specified with /Merge:true /Zip:true. You should definitely do merge if you need to analyze the trace on a different machine. I can’t tell you how many times people have failed to do this and then couldn’t get symbols decoded and had to recollect the trace as they already detected the unmerged traces from the machine where they collected on)
and do that 3 times total (specified with /CollectMultiple:3)
So if you were to use it for your own purpose the args to change are
/StopOnGcOverMsec:3000 – replace 3000 with the pause (in ms) you want to stop the trace for
/Process:”w3wp” – replace w3wp with the .exe you want to detect the long GC pause in
When we got the trace GCStats showed that there was an induced full blocking GC in one of the w3wp processes that took 7.8 seconds! And to see what induced this GC, goto Events view and find the Microsoft-Windows-DotNETRuntime/GC/Triggered event (if you type “tri” in the Filter textbox it’ll filter to only events whose names have tri in them so you can quickly find this event). Click on it and it’ll display all the instances of that event in all processes. Find the process and the GC of interest. The “Rest” column for this event will say HasStack=”True” which means there’s a stack associated with this event and if you right click on the timestamp and do “Open any stacks” it’ll show you the stack for this event which will reveal what induced this GC:
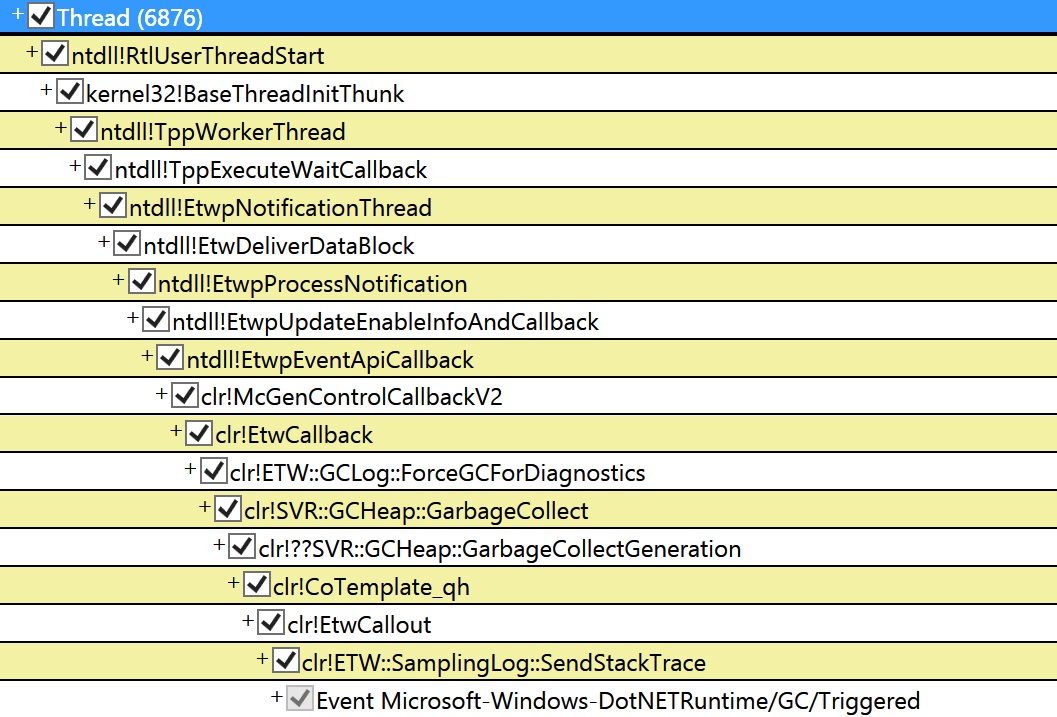
This is saying that someone requested to walk the heap with ETW (this is one of the mechanisms Perfview uses for taking a heap snapshot).
Now it leaves the question why this GC was so long. To see what the GC is actually doing that takes so long, open the CPU stack view with the time range set to the beginning and ending of this GC (which you can get from the GCStats view). And it’s pretty clear what’s taking up the time. We are spending 6.6s in this method called clr!SVR::GCProfileWalkHeapWorker!
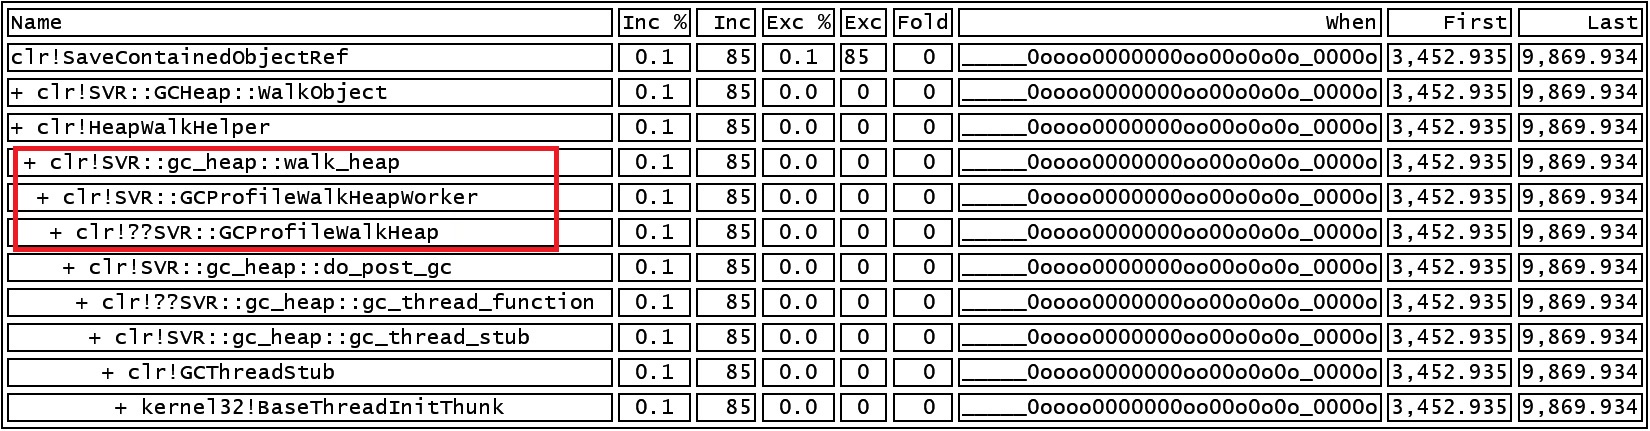
Normally do_post_gc should take very, very little time but in the case of someone actually requesting a heap walk, GCProfileWalkHeap would do a full blown walk of the heap which obviously can be very expensive. You should never seen this callstack in production (unless you are intentionally taking a heap snapshot but that should just be a one time thing, or at best once in a long while)! I’ve seen this happen a couple of times where folks were completely oblivious some tool was asking for this continuously and it of course made GC pauses very long.
So something was asking for GC heap walks (it was not due to the perfview I showed above as that doesn’t include the keywords for heap walk events). It turned out the team just deployed a diagnostics tool that was doing this. After getting rid of the tool they no longer saw these long induced full blocking GCs.
Curious readers would also notice that the When column shows fairly low CPU usage (click on ‘?’ for the When column to see an explanation how to interpret what you see here). It was because the tool also induced 2 back to back full blocking GCs in the other w3wp process at the same time which made each GC much slower. Very destructive tool 🙂
 Light
Light Dark
Dark
0 comments