
Performance Improvements in .NET Core 2.1
Back before .NET Core 2.0 shipped, I wrote a post highlighting various performance improvements in .NET Core 2.0 when compared with .NET Core 1.1 and the .NET Framework. As .NET Core 2.1 is in its final stages of being released, I thought it would be a good time to have some fun and take a tour through some of the myriad of performance improvements that have found their way into this release.
Performance improvements show up in .NET Core 2.1 in a variety of ways. One of the big focuses of the release has been on the new System.Span<T> type that, along with its friends like System.Memory<T>, are now at the heart of the runtime and core libraries (see this MSDN Magazine article for an introduction). New libraries have been added in this release, like System.Memory.dll, System.Threading.Channels.dll, and System.IO.Pipelines.dll, each targeted at specific scenarios. And many new members have been added to existing types, for example ~250 new members across existing types in the framework that accept or return the new span and memory types, and counting members on new types focusing on working with span and memory more than doubles that (e.g. the new BinaryPrimitives and Utf8Formatter types). All such improvements are worthy of their own focused blog posts, but they’re not what I’m focusing on here. Rather, I’m going to walk through some of the myriad of improvements that have been made to existing functionality, to existing types and methods, places where you upgrade a library or app from .NET Core 2.0 to 2.1 and performance just gets better. For the purposes of this post, I’m focused primarily on the runtime and the core libraries, but there have also been substantial performance improvements higher in the stack, as well as in tooling.
Setup
In my post on .NET Core 2.0 performance, I demonstrated improvements using simple console apps with custom measurement loops, and I got feedback that readers would have preferred if it if I’d used a standard benchmarking tool. While I explicitly opted not to do so then (the reason being making it trivial for developers to follow along by copying and pasting code samples into their own console apps), this time around I decided to experiment with the approach, made easier by tooling improvements in the interim. So, to actually run the complete code samples shown in this post, you’ll need a few things. In my setup, I have both .NET Core 2.0 and a preview of .NET Core 2.1 installed. I then did dotnet new console, and modified the resulting .csproj as follows, which includes specifying both releases as target frameworks and including a package reference for Benchmark.NET, used to do the actual benchmarking.
Then I have the following scaffolding code in my Program.cs:
For each benchmark shown in this post, you should be able to simply copy-and-paste the relevant code to where commented in this .cs file, and then use dotnet run -c Release -f netcoreapp2.0 to see the results. That will run the app using .NET Core 2.0, but the app itself is just the Benchmark.NET host, and the Benchmark.NET library will in turn create, build, and run .NET Core 2.0 and 2.1 apps for comparison. Note that in each results section, I’ve removed superfluous columns, to keep things tidy. I’ve also generally only shown results from running on Windows, when there’s no meaningful difference to highlight between platforms.
With that, let’s explore.
JIT
A lot of work has gone into improving the Just-In-Time (JIT) compiler in .NET Core 2.1, with many optimizations that enhance a wide-range of libraries and applications. Many of these improvements were sought based on needs of the core libraries themselves, giving these improvements both targeted and broad impact.
Let’s start with an example of a JIT improvement that can have broad impact across many types, but in particular for collection classes. .NET Core 2.1 has improvements around “devirtualization”, where the JIT is able to statically determine the target of some virtual invocations and as a result avoid virtual dispatch costs and enable potential inlining. In particular, PR dotnet/coreclr#14125 taught the JIT about the EqualityComparer<T>.Default member, extending the JIT’s intrinsic recognizer to recognize this getter. When a method then does EqualityComparer<T>.Default.Equals, for example, the JIT is able to both devirtualize and often inline the callee, which for certain T types makes a huge difference in throughput. Before this improvment, if T were Int32, the JIT would end up emitting code to make a virtual call to the underlying GenericEqualityComparer<T>.Equals method, but with this change, the JIT is able to inline what ends up being a call to Int32.Equals, which itself is inlineable, and EqualityComparer<int>.Default.Equals becomes as efficient as directly comparing two Int32s for equality. The impact of this is obvious with the following benchmark:
On my machine, I get output like the following, showcasing an ~2.5x speedup over .NET Core 2.0:
| Method | Toolchain | Mean |
|---|---|---|
| EqualityComparerInt32 | .NET Core 2.0 | 2.2106 ns |
| EqualityComparerInt32 | .NET Core 2.1 | 0.8725 ns |
Such improvements show up in indirect usage of EqualityComparer<T>.Default, as well. Many of the collection types in .NET, including Dictionary<TKey, TValue>, utilize EqualityComparer<T>.Default, and we can see the impact this improvement has on various operations employed by such collections. For example, PR dotnet/coreclr#15419 from @benaadams tweaked Dictionary<TKey, TValue>‘s ContainsValue implementation to better take advantage of this devirtualization and inlining, such that running this benchmark:
produces on my machine results like the following, showcasing an ~2.25x speedup:
| Method | Toolchain | Mean |
|---|---|---|
| DictionaryContainsValue | .NET Core 2.0 | 3.419 us |
| DictionaryContainsValue | .NET Core 2.1 | 1.519 us |
In many situations, improvements like this in the JIT implicitly show up as improvements in higher-level code. In this specific, case, though, it required the aforementioned change, which updated code like:
to instead be like:
In other words, previously this code had been optimized to avoid the overheads associated with using EqualityComparer<TValue>.Default on each iteration of the loop. But that micro-optimization then defeated the JIT’s devirtualization logic, such that what used to be an optimization is now a deoptimization, and the code had to be changed back to a pattern the JIT could recognize to make it as efficient as possible. A similar change was made in PR dotnet/corefx#25097, in order to benefit from this improvement in LINQ’s Enumerable.Contains. However, there are many places where this JIT improvement does simply improve existing code, without any required changes. (There are also places where there are known further improvements to be made, e.g. dotnet/coreclr#17273.)
In the previous discussion, I mentioned “intrinsics” and the ability for the JIT to recognize and special-case certain methods in order to help it better optimize for specific uses. .NET Core 2.1 sees additional intrinsic work, including for some long-standing but rather poor performing methods in .NET. A key example is Enum.HasFlag. This method should be simple, just doing a bit flag test to see whether a given enum value contains another, but because of how this API is defined, it’s relatively expensive to use. No more. In .NET Core 2.1 Enum.HasFlag is now a JIT intrinsic, such that the JIT generates the same quality code you would write by hand if you were doing manual bit flag testing. The evidence of this is in a simple benchmark:
On this test, I get results like the following, showing a 100% reduction in allocation (from 48 bytes per call to 0 bytes per call) and an ~50x improvement in throughput:
| Method | Toolchain | Mean | Allocated |
|---|---|---|---|
| EnumHasFlag | .NET Core 2.0 | 14.9214 ns | 48 B |
| EnumHasFlag | .NET Core 2.1 | 0.2932 ns | 0 B |
This is an example where developers that cared about performance had to avoid writing code a certain way and can now write code that’s both maintainable and efficient, and also helps unaware developers fall into a “pit of success”. (Incidentally, this is also a case where Mono already had this optimization.)
Another example of this isn’t specific to a given API, but rather applies to the general shape of code. Consider the following implementation of string equality:
Unfortunately, on previous releases of .NET, the code generated here was suboptimal, in particular due to the early exit from within the loop. Developers that cared about performance had to write this kind of loop in a specialized way, using gotos, for example as seen in the .NET Core 2.0 implementation of String‘s CompareOrdinalIgnoreCaseHelper method. In .NET Core 2.1, PR dotnet/coreclr#13314 rearranges basic blocks in loops to avoid needing such workarounds. You can see in .NET Core 2.1 that goto in CompareOrdinalIgnoreCaseHelper is now gone, and the shown benchmark is almost double the throughput of what it was in the previous release:
| Method | Toolchain | Mean |
|---|---|---|
| LoopBodyLayout | .NET Core 2.0 | 56.30 ns |
| LoopBodyLayout | .NET Core 2.1 | 30.49 ns |
Of course, folks contributing to the JIT don’t just care about such macro-level enhancements to the JIT, but also to improvements as low-level as tuning what instructions are generated for specific operations. For example, PR dotnet/coreclr#13626 from @mikedn enables the JIT to generate the more efficient BT instruction in some situations where TEST and LSH were otherwise being used. The impact of that can be seen on this benchmark extracted from that PR’s comments:
where with this change, .NET Core 2.1 executes this benchmark 40% faster than it did in .NET Core 2.0:
| Method | Toolchain | Mean |
|---|---|---|
| LoweringTESTtoBT | .NET Core 2.0 | 1.414 ns |
| LoweringTESTtoBT | .NET Core 2.1 | 1.057 ns |
The JIT also saw a variety of improvements in .NET Core 2.1 around boxing. One of my personal favorites (because of the impact it has on async methods, to be discussed later in this post) is PR dotnet/coreclr#14698 (and a follow-up PR dotnet/coreclr#17006), which enables writing code that would have previously allocated and now doesn’t. Consider this benchmark:
In it, we’ve got an IAnimal with a MakeSound method, and we’ve got a method that wants to accept an arbitrary T, test to see whether it’s an IAnimal (it might be something else), and if it is, call its MakeSound method. Prior to .NET Core 2.1, this allocates, because in order to get the T as an IAnimal on which I can call MakeSound, the T needs to be cast to the interface, which for a value type results in it being boxed, and therefore allocates. In .NET Core 2.1, though, this pattern is recognized, and the JIT is able not only to undo the boxing, but also then devirtualize and inline the callee. The impact of this can be substantial when this kind of pattern shows up on hot paths. Here are the benchmark results, highlighting a significant improvement in throughput and an elimination of the boxing allocations:
| Method | Toolchain | Mean | Allocated |
|---|---|---|---|
| BoxingAllocations | .NET Core 2.0 | 12.444 ns | 48 B |
| BoxingAllocations | .NET Core 2.1 | 1.391 ns | 0 B |
This highlights just some of the improvements that have gone into the JIT in .NET Core 2.1. And while each is impressive in its own right, the whole is greater than the sum of the parts, as work was done to ensure that all of these optimizations, from devirtualization, to boxing removal, to invocation of the unboxed entry, to inlining, to struct promotion, to copy prop through promoted fields, to cleaning up after unused struct locals, and so on, all play nicely together. Consider this example provided by @AndyAyersMS:
In .NET Core 2.0, this resulted in the following assembly code generated:
In contrast, in .NET Core 2.1, that’s all consolidated to this being generated for Main:
Very nice.
Threading
Improvements to the JIT are an example of changes that can have very broad impact over large swaths of code. So, too, are changes to the runtime, and one key area where the runtime has seen significant improvements is in the area of threading. These improvements have come in a variety of forms, whether in reducing the overhead of low-level operations, or reducing lock contention in commonly used threading primitives, or reducing allocation, or generally improving the infrastructure behind async methods. Let’s look at a few examples.
A key need in writing scalable code is taking advantage of thread statics, which are fields unique to each thread. The overhead involved in accessing a thread static is greater than that for normal statics, and it’s important that this be as low as possible as lots of functionality, in the runtime, in the core libraries, and in user code, depends on them, often on hot paths (for example, Int32.Parse(string) looks up the current culture, which is stored in a thread static). PRs dotnet/coreclr#14398 and dotnet/coreclr#14560 significantly reduced this overhead involved in accessing thread statics. So, for example, this benchmark:
yields these results on my machine:
| Method | Toolchain | Mean |
|---|---|---|
| ThreadStatics | .NET Core 2.0 | 7.322 ns |
| ThreadStatics | .NET Core 2.1 | 5.269 ns |
Whereas these thread statics changes were focused on improving the throughput of an individual piece of code, other changes focused on scalability and minimizing contention between pieces of code, in various ways. For example, PR dotnet/coreclr#14216 focused on costs involved in Monitor (what’s used under the covers by lock in C#) when there’s contention, PR dotnet/coreclr#13243 focused on the scalability of ReaderWriterLockSlim, and PR dotnet/coreclr#14527 focused on reducing the contention in Timers. Let’s take the last one as an example. Whenever a System.Threading.Timer is created, modified, fired, or removed, in .NET Core 2.0 that required taking a global timers lock; that meant that code which created lots of timers quickly would often end up serializing on this lock. To address this, .NET Core 2.1 partitions the timers across multiple locks, so that different threads running on different cores are less likely to contend with each other. The impact of that is visible in a benchmark like the following:
This spawns multiple tasks, each of which creates a timer, does a bit of work, and then deletes the timer, and it yields the following results on my quad-core:
| Method | Toolchain | Mean |
|---|---|---|
| TimerContention | .NET Core 2.0 | 332.8 ms |
| TimerContention | .NET Core 2.1 | 135.6 ms |
Another significant improvement came in the form of both throughput improvement and allocation reduction, in CancellationTokenSource. CancellationTokens have become ubiquitous throughout the framework, in particular in asynchronous methods. It’s often the case that a single token will be created for the lifetime of some composite operation (e.g the handling of a web request), and over its lifetime, it’ll be passed in and out of many sub-operations, each of which will Register a callback with the token for the duration of that sub-operation. In .NET Core 2.0 and previous .NET releases, the implementation was heavily focused on getting as much scalability as possible, achieved via a set of lock-free algorithms that were scalable but that incurred non-trivial costs in both throughput and allocation, so much so that it overshadowed the benefits of the lock-freedom. The associated level of scalability is also generally unnecessary, as the primary use case for a single CancellationToken does not involve many parallel operations, but instead many serialized operations one after the other. In .NET Core 2.1, PR dotnet/coreclr#12819 changed the implementation to prioritize the more common scenarios; it’s still very scalable, but by switching away from a lock-free algorithm to one that instead employed striped locking (as in the Timer case), we significantly reduced allocations and improved throughput while still meeting scalability goals. These improvements can be seen from the following single-threaded benchmark:
| Method | Toolchain | Mean | Allocated |
|---|---|---|---|
| SerialCancellationTokenRegistration | .NET Core 2.0 | 95.29 ns | 48 B |
| SerialCancellationTokenRegistration | .NET Core 2.1 | 62.45 ns | 0 B |
and also from this multi-threaded one (run on a quad-core):
| Method | Toolchain | Mean |
|---|---|---|
| ParallelCancellationTokenRegistration | .NET Core 2.0 | 31.31 ns |
| ParallelCancellationTokenRegistration | .NET Core 2.1 | 18.19 ns |
These improvements to CancellationToken are just a piece of a larger set of improvements that have gone into async methods in .NET Core 2.1. As more and more code is written to be asynchronous and to use C#’s async/await features, it becomes more and more important that async methods introduce as little overhead as possible. Some significant strides in that regard have been taken in .NET Core 2.1, on a variety of fronts.
For example, on very hot paths that invoke asynchronous methods, one cost that shows up is simply the overhead involved in invoking an async method and awaiting it, in particular when it completes quickly and synchronously. In part due to the aforementioned JIT and thread static changes, and in part due to PRs like dotnet/coreclr#15629 from @benaadams, this overhead has been cut by ~30%:
| Method | Toolchain | Mean | Allocated |
|---|---|---|---|
| AsyncMethodAwaitInvocation | .NET Core 2.0 | 20.36 ns | 0 B |
| AsyncMethodAwaitInvocation | .NET Core 2.1 | 13.48 ns | 0 B |
Bigger improvements, however, have come in the form of allocation reduction. In previous releases of .NET, the synchronous completion path for async methods was optimized for allocations, meaning that if an async method completed without ever suspending, it either wouldn’t allocate at all or at most would allocate one object (for the returned Task<T> if an internally cached one wasn’t available). However, asynchronous completion (where it suspends at least once) would incur multiple allocations. The first allocation would be for the returned Task/Task<T> object, as the caller needs some object to hold onto to be able to know when the asynchronous operation has completed and to extract its result or exception. The second allocation is the boxing of the compiler-generated state machine: the “locals” for the async method start out on the stack, but when the method suspends, the state machine that contains these “locals” as fields gets boxed to the heap so that the data can survive across the await point. The third allocation is the Action delegate that’s passed to an awaiter and that’s used to move the state machine forward when the awaited object completes. And the fourth is a “runner” that stores additional context (e.g. ExecutionContext). These allocations can be seen by looking at a memory trace. For example, if we run this code:
and look at the results from the Visual Studio allocation profiler, in .NET Core 2.0 we see these allocations associated with the async infrastructure:
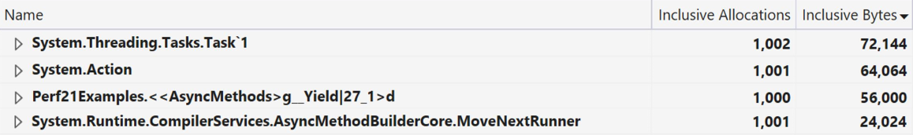
Due to PRs like dotnet/coreclr#13105, dotnet/coreclr#14178 and dotnet/coreclr#13907, the previous trace when run with .NET Core 2.1 instead looks like this:

The four allocations have been reduced to one, and the total bytes allocated has shrunk by half. When async methods are used heavily in an application, that savings adds up quickly. There have also been side benefits to the architectural changes that enabled these savings, including improved debuggability.
String
Moving up the stack, another area that’s seen a lot of performance love in .NET Core 2.1 is in commonly used primitive types, in particular System.String. Whether from vectorization, or using System.Span<T> and its optimizations internally, or adding fast paths for common scenarios, or reducing allocations, or simply trimming some fat, a bunch of functionality related to strings has gotten faster in 2.1. Let’s look at a few.
String.Equal is a workhorse of .NET applications, used for all manner of purposes, and thus it’s an ideal target for optimization. PR dotnet/coreclr#16994 improved the performance of String.Equal by vectorizing it, utilizing the already vectorized implementation of Span<T>.SequenceEqual as its core implementation. The effect can be seen here, in the comparison of two strings that differ only in their last character:
| Method | Toolchain | Mean |
|---|---|---|
| StringEquals | .NET Core 2.0 | 16.16 ns |
| StringEquals | .NET Core 2.1 | 10.20 ns |
String.IndexOf and String.LastIndexOf are similarly vectored with PR dotnet/coreclr#16392:
| Method | Toolchain | Mean |
|---|---|---|
| StringIndexOf | .NET Core 2.0 | 41.13 ns |
| StringIndexOf | .NET Core 2.1 | 15.94 ns |
String.IndexOfAny was also optimized. In contrast to the previous PRs that improved performance via vectorization, PR dotnet/coreclr#13219 from @bbowyersmyth improves the performance of IndexOfAny by special-casing the most commonly-used lengths of the anyOf characters array and adding fast-paths for them:
| Method | Toolchain | Mean |
|---|---|---|
| IndexOfAny | .NET Core 2.0 | 94.66 ns |
| IndexOfAny | .NET Core 2.1 | 38.27 ns |
String.ToLower and ToUpper (as well as the ToLower/UpperInvariant varieties) were improved in PR dotnet/coreclr#17391. As with the previous PR, these were improved by adding fast-paths for common cases. First, if the string passed in is entirely ASCII, then it does all of the computation in managed code and avoids calling out to the native globalization library to do the casing. This in and of itself yields a significant throughput improvement, e.g.
| Method | Toolchain | Mean | Allocated |
|---|---|---|---|
| StringToLowerChangesNeeded | .NET Core 2.0 | 187.00 ns | 144 B |
| StringToLowerChangesNeeded | .NET Core 2.1 | 96.29 ns | 144 B |
But things look even better when the string is already in the target casing:
| Method | Toolchain | Mean | Allocated |
|---|---|---|---|
| StringToLowerAlreadyCased | .NET Core 2.0 | 197.21 ns | 144 B |
| StringToLowerAlreadyCased | .NET Core 2.1 | 68.81 ns | 0 B |
In particular, note that all allocation has been eliminated.
Another very common String API was improved to reduce allocation while also improving throughput. In .NET Core 2.0, String.Split allocates an Int32[] to track split locations in the string; PR dotnet/coreclr#15435 from @cod7alex removed that and replaced it with either stack allocation or usage of ArrayPool<int>.Shared, depending on the input string’s length. Further, PR dotnet/coreclr#15322 took advantage of span internally to improve the throughput of several common cases. The results of both of these can be seen in this benchmark:
| Method | Toolchain | Mean | Allocated |
|---|---|---|---|
| StringSplit | .NET Core 2.0 | 459.5 ns | 1216 B |
| StringSplit | .NET Core 2.1 | 305.2 ns | 480 B |
Even some corner cases of String usage saw improvements. For example, some developers use String.Concat(IEnumerable<char>) as a way to compose characters into strings. PR dotnet/coreclr#14298 special-cased T == char in this overload, yielding some nice throughput and allocation wins:
| Method | Toolchain | Mean | Allocated |
|---|---|---|---|
| StringConcatCharEnumerable | .NET Core 2.0 | 22.05 us | 35.82 KB |
| StringConcatCharEnumerable | .NET Core 2.1 | 15.56 us | 4.57 KB |
Formatting and Parsing
The work done around strings also extends into the broad area of formatting and parsing, work that’s the bread-and-butter of many applications.
As noted at the beginning of this post, many Span<T>-based methods were added across the framework, and while I’m not going to focus on those here from a new API perspective, the act of adding these APIs helped to improve existing APIs. Some existing APIs were improved by taking advantage of the new Span<T>-based methods. For example, PR dotnet/coreclr#15110 from @justinvp utilizes the new Span<T>-based TryFormat in StringBuilder.AppendFormat, which is itself used internally by String.Format. The usage of Span<T> enables the implementation internally to format directly into existing buffers rather than first formatting into allocated strings and then copying those strings to the destination buffer.
| Method | Toolchain | Mean | Allocated |
|---|---|---|---|
| StringFormat | .NET Core 2.0 | 196.1 ns | 128 B |
| StringFormat | .NET Core 2.1 | 151.3 ns | 80 B |
Similarly, PR dotnet/coreclr#15069 takes advantage of the Span<T>-based methods in various StringBuilder.Append overloads, to format the provided value directly into the StringBuilder‘s buffer rather than going through a String:
| Method | Toolchain | Mean | Allocated |
|---|---|---|---|
| StringBuilderAppend | .NET Core 2.0 | 6.523 ms | 3992000 B |
| StringBuilderAppend | .NET Core 2.1 | 3.268 ms | 0 B |
Another way the new Span<T>-based methods helped was as a motivational forcing function. In the .NET Framework and .NET Core 2.0 and earlier, most of the numeric parsing and formatting code in .NET was implemented in native code. Having that code as C++ made it a lot more difficult to add the new Span<T>-based methods, which would ideally share most of their implementation with their String-based forebearers. However, all of that C++ was previously ported to C# as part of enabling .NET Native, and all of that code then found its way into corert, which also shares code with coreclr. For the .NET Core 2.1 release, we thus deleted most of the native parsing/formatting code in coreclr and replaced it with the managed port, that’s now shared between coreclr and corert. With the implementation in managed code, it was then also easier to iterate and experiment with optimizations, so not only did the code move to managed and not only is it now used for both the String-based and Span<T>-based implementations, many aspects of it also got faster.
For example, via PRs like dotnet/coreclr#15069 and dotnet/coreclr#17432, throughput of Int32.ToString() approximately doubled:
| Method | Toolchain | Mean | Allocated |
|---|---|---|---|
| Int32Formatting | .NET Core 2.0 | 65.27 ns | 48 B |
| Int32Formatting | .NET Core 2.1 | 34.88 ns | 48 B |
while via PRs like dotnet/coreclr#13389, Int32 parsing improved by over 20%:
| Method | Toolchain | Mean |
|---|---|---|
| Int32Parsing | .NET Core 2.0 | 96.95 ns |
| Int32Parsing | .NET Core 2.1 | 76.99 ns |
These improvements aren’t limited to just integral types like Int32, UInt32, Int64, and UInt64. Single.ToString() and Double.ToString() improved as well, in particular on Unix where PR dotnet/coreclr#12894 from @mazong1123 provided an entirely new implementation for some very nice wins over the rather slow implementation that was there previously:
Windows:
| Method | Toolchain | Mean | Allocated |
|---|---|---|---|
| DoubleFormatting | .NET Core 2.0 | 448.7 ns | 48 B |
| DoubleFormatting | .NET Core 2.1 | 186.8 ns | 48 B |
Linux (note that my Windows and Linux installations are running on very different setups, so the values shouldn’t be compared across OSes):
| Method | Toolchain | Mean | Allocated |
|---|---|---|---|
| DoubleFormatting | .NET Core 2.0 | 2,018.2 ns | 48 B |
| DoubleFormatting | .NET Core 2.1 | 258.1 ns | 48 B |
The improvements in 2.1 also apply to less commonly used but still important numerical types, such as via PR dotnet/corefx#25353 for BigInteger:
| Method | Toolchain | Mean | Allocated |
|---|---|---|---|
| BigIntegerFormatting | .NET Core 2.0 | 36.677 us | 34.73 KB |
| BigIntegerFormatting | .NET Core 2.1 | 3.119 us | 3.27 KB |
Note both the 10x improvement in throughput and 10x reduction in allocation.
These improvements continue with other parsing and formatting routines. For example, in services in particular, DateTime and DateTimeOffset are often formatted using either the "r" or "o" formats, both of which have been optimized in .NET Core 2.1, via PR dotnet/coreclr#17092:
| Method | Toolchain | Mean | Allocated |
|---|---|---|---|
| DateTimeOffsetFormatR | .NET Core 2.0 | 220.89 ns | 88 B |
| DateTimeOffsetFormatR | .NET Core 2.1 | 64.60 ns | 88 B |
| DateTimeOffsetFormatO | .NET Core 2.0 | 263.45 ns | 96 B |
| DateTimeOffsetFormatO | .NET Core 2.1 | 104.66 ns | 96 B |
Even System.Convert has gotten in on the formatting and parsing performance fun, with parsing from Base64 via FromBase64Chars and FromBase64String getting significant speedups, thanks to PR dotnet/coreclr#17033:
| Method | Toolchain | Mean | Allocated |
|---|---|---|---|
| ConvertFromBase64String | .NET Core 2.0 | 45.99 us | 9.79 KB |
| ConvertFromBase64String | .NET Core 2.1 | 29.86 us | 9.79 KB |
| ConvertFromBase64Chars | .NET Core 2.0 | 46.34 us | 9.79 KB |
| ConvertFromBase64Chars | .NET Core 2.1 | 29.51 us | 9.79 KB |
Networking
The System.Net libraries received some good performance attention in .NET Core 2.0, but significantly more so in .NET Core 2.1.
There have been some nice improvements throughout the libraries, such as PR dotnet/corefx#26850 from @JeffCyr improving Dns.GetHostAddressAsync on Windows with a true asynchronous implementation, or PR dotnet/corefx#26303 providing an optimized endian-reversing routine which was then used by PR dotnet/corefx#26329 from @justinvp to optimize IPAddress.HostToNetworkOrder/NetworkToHostOrder:
| Method | Toolchain | Mean |
|---|---|---|
| NetworkToHostOrder | .NET Core 2.0 | 10.760 ns |
| NetworkToHostOrder | .NET Core 2.1 | 1.461 ns |
or in PRs like dotnet/corefx#28086, dotnet/corefx#28084, and dotnet/corefx#22872 avoiding allocations in Uri:
| Method | Toolchain | Mean | Allocated |
|---|---|---|---|
| UriAllocations | .NET Core 2.0 | 997.6 ns | 1168 B |
| UriAllocations | .NET Core 2.1 | 650.6 ns | 672 B |
But the most impactful changes have come in higher-level types, in particular in Socket, SslStream, and HttpClient.
At the sockets layer, there have been a variety of improvements, but the impact is most noticeable on Unix, where PRs like dotnet/corefx#23115 and dotnet/corefx#25402 overhauled how socket operations are processed and the allocations they incur. This is visible in the following benchmark that repeatedly does receives that will always complete asynchronously, followed by sends to satisfy them, and which sees a 2x improvement in throughput:
| Method | Toolchain | Mean |
|---|---|---|
| SocketReceiveThenSend | .NET Core 2.0 | 102.82 ms |
| SocketReceiveThenSend | .NET Core 2.1 | 48.95 ms |
Often used on top of sockets and NetworkStream, SslStream was improved significantly in .NET Core 2.1, as well, in a few ways. First, PRs like dotnet/corefx#24497 and dotnet/corefx#23715 from @Drawaes, as well as dotnet/corefx#22304 and dotnet/corefx#29031 helped to clean up the SslStream codebase, making it easier to improve in the future but also removing a bunch of allocations (above and beyond the significant allocation reductions that were seen in .NET Core 2.0). Second, though, a significant scalability bottleneck in SslStream on Unix was fixed in PR dotnet/corefx#25646 from @Drawaes, such that SslStream now scales well on Unix as concurrent usage increases. This, in concert with the sockets improvements and other lower-level improvements, contributes to the managed implementation beneath HttpClient.
HttpClient is a thin wrapper around an HttpMessageHandler, a public abstract class that represents an implementation of an HTTP client. A general-purpose implementation of HttpMessageHandler is provided in the form of the derived HttpClientHandler class, and while it’s possible to construct and pass a handler like HttpClientHandler to an HttpClient constructor (generally done to be able to configure the handler via its properties), HttpClient also provides a parameterless constructor that uses HttpClientHandler implicitly. In .NET Core 2.0 and earlier, HttpClientHandler was implemented on Windows on top of the native WinHTTP library, and it was implemented on Unix on top of the libcurl library. That dependency on the underlying external library has led to a variety of problems, including different behaviors across platforms and OS distributions as well as limited functionality on some platforms. In .NET Core 2.1, HttpClientHandler has a new default implementation implemented from scratch entirely in C# on top of the other System.Net libraries, e.g. System.Net.Sockets, System.Net.Security, etc. Not only does this address the aforementioned behavioral issues, it provides a significant boost in performance (the implementation is also exposed publicly as SocketsHttpHandler, which can be used directly instead of via HttpClientHandler in order to configure SocketsHttpHandler-specific properties).
Here’s an example benchmark making a bunch of concurrent HTTPS calls to an in-process socket server:
On an 8-core Windows machine, here are my results:
| Method | Toolchain | Mean | Gen 0 | Gen 1 |
|---|---|---|---|---|
| ConcurrentHttpsGets | .NET Core 2.0 | 228.03 ms | 1250.0000 | 312.5000 |
| ConcurrentHttpsGets | .NET Core 2.1 | 17.93 ms | 656.2500 | – |
That’s a 12.7x improvement in throughput and a huge reduction in garbage collections, even though the .NET Core 2.0 implementation has most of the logic in native rather than managed code! Similarly, on an 8-core Linux machine, here are my results:
| Method | Toolchain | Mean | Gen 0 | Gen 1 |
|---|---|---|---|---|
| ConcurrentHttpsGets | .NET Core 2.0 | 135.46 ms | 750.0000 | 250.0000 |
| ConcurrentHttpsGets | .NET Core 2.1 | 21.83 ms | 343.7500 | – |
Again, huge improvement!
And More
Through this post I aimed to categorize and group various performance changes to highlight areas of concentrated improvement, but I also want to highlight that performance work has happened across the breadth of runtime and libraries, beyond this limited categorization. I’ve picked a few other examples to highlight some of the changes to elsewhere in the libraries throughout the stack.
One particularly nice set of improvements came to file system enumeration support, in PRs dotnet/corefx#26806 and dotnet/corefx#25426. This work has made enumerating directories and files not only faster but also with significantly less garbage left in its wake. Here’s an example enumerating all of the files in my System.IO.FileSystem library folder from my corefx repo clone (obviously if you try this one out locally, you’ll need to update the path to whatever works on your machine):
The improvements are particularly stark on Windows, where this benchmark shows a 3x improvement in throughput and a 50% reduction in allocation:
| Method | Toolchain | Mean | Allocated |
|---|---|---|---|
| EnumerateFiles | .NET Core 2.0 | 1,982.6 us | 71.65 KB |
| EnumerateFiles | .NET Core 2.1 | 650.1 us | 35.24 KB |
but also on Unix, where this benchmark (with the path fixed up appropriately) on Linux shows a 15% improvement in throughput and a 45% reduction in allocation:
| Method | Toolchain | Mean | Allocated |
|---|---|---|---|
| EnumerateFiles | .NET Core 2.0 | 638.0 us | 56.09 KB |
| EnumerateFiles | .NET Core 2.1 | 539.5 us | 38.6 KB |
This change internally benefited from the Span<T>-related work done throughout the framework, as did, for example, an improvement to Rfc2898DeriveBytes in System.Security.Cryptography. Rfc2898DeriveBytes computes cryptographic hash codes over and over as part of implementing password-based key derivation functionality. In previous releases, each iteration of that algorithm would result in at least one byte[] allocation, but now with Span<T>-based methods like HashAlgorithm.TryComputeHash, due to PR dotnet/corefx#23269 those allocations are entirely avoided. And that results in dramatic savings, especially for longer iteration counts:
| Method | Toolchain | Mean | Allocated |
|---|---|---|---|
| DeriveBytes | .NET Core 2.0 | 9.199 ms | 1120120 B |
| DeriveBytes | .NET Core 2.1 | 8.084 ms | 176 B |
Effort has also been put into improving places where one platform is more deficient than others. For example, Guid.NewGuid() on Unix is considerably slower than it is on Windows. And while the gap hasn’t been entirely closed, as part of removing a dependency on the libuuid library, PR dotnet/coreclr#16643 did significantly improve the throughput of Guid.NewGuid() on Unix:
| Method | Toolchain | Mean |
|---|---|---|
| GuidNewGuid | .NET Core 2.0 | 7.179 us |
| GuidNewGuid | .NET Core 2.1 | 1.770 us |
The list goes on: improvements to array processing (e.g. dotnet/coreclr#13962), improvements to LINQ (e.g. dotnet/corefx#23368 from @dnickless), improvements to Environment (e.g. dotnet/coreclr#14502 from @justinvp), improvements to collections (e.g. dotnet/corefx#26087 from @gfoidl), improvements to globalization (e.g. dotnet/coreclr#17399), improvements around pooling (e.g. dotnet/coreclr#17078), improvements to SqlClient (e.g. dotnet/corefx#27758), improvements to StreamWriter and StreamReader (e.g. dotnet/corefx#22147), and on.
Finally, all of the examples shown throughout this post were already at least as good in .NET Core 2.0 (if not significantly better) as in the .NET Framework 4.7, and then .NET Core 2.1 just made things even better. However, there are a few places where features were missing in .NET Core 2.0 and have been brought back in 2.1, including for performance. One notable such improvement is in Regex, where the Regex.Compiled option was exposed but ignored in .NET Core 2.0. PR dotnet/corefx#24158 brought back the in-memory compilation support for Regex, enabling the same kinds of throughput improvements here previously available in the .NET Framework:
| Method | Toolchain | Mean |
|---|---|---|
| RegexCompiled | .NET Core 2.0 | 473.7 ns |
| RegexCompiled | .NET Core 2.1 | 295.2 ns |
What’s Next?
Huge “thank you”s to everyone who has contributed to this release. As is obvious from this tour, there’s a lot to look forward to in .NET Core 2.1, and this post only scratched the surface of the improvements coming. We look forward to hearing your feedback and to your future contributions in the coreclr, corefx, and other dotnet and ASP.NET repos!
 Light
Light Dark
Dark
3 comments
Wow @stephen thanks for the sum up. Good job to .NET core team!
Thanks 🙂
@Stephen Need your help.
THis my result after running Wrk tool on my local system which is very less. Please Suggest what could be done to improve? I have run on Linux vm with 4 core processor and 8 GM RAM.
Result for Running 30s test @ localhost:5000/api/values 12 threads and 400 connections Thread Stats Avg Stdev Max +/- Stdev Latency 506.98ms 157.65ms 990.47ms 75.59% Req/Sec 79.60 71.89 343.00 81.04% 22537 requests in 30.09s, 3.83MB read Requests/sec: 749.01 Transfer/sec: 130.20KB
‘namespace Asp.netCoreWebApplication.Controllers
{ [Route(“api/[controller]”)]
[ApiController]
public class ValuesController : ControllerBase
{
// GET api/values
[HttpGet]
public ActionResult<IEnumerable<string>> Get() { return new string[] { “value1”, “value2″ };
}
}
}”’
This is my result for Running 30s test @ http://localhost:5000/api/values 12 threads and 400 connections Thread Stats Avg Stdev Max +/- Stdev Latency 506.98ms 157.65ms 990.47ms 75.59% Req/Sec 79.60 71.89 343.00 81.04% 22537 requests in 30.09s, 3.83MB readRequests/sec: 749.01Transfer/sec: 130.20KB