
Profile-guided optimization in .NET Core 2.0
This post was co-written by Daniel Podder and Bertrand Le Roy.
.NET Core 2.0 introduces many new optimizations that will make your code even faster. A lot of work has been done in the base class library to improve performance, but in this post, we’d like to talk about a specific category of optimization: profile-guided optimization (or PGO, pronounced “pogo”).
What is profile-guided optimization?
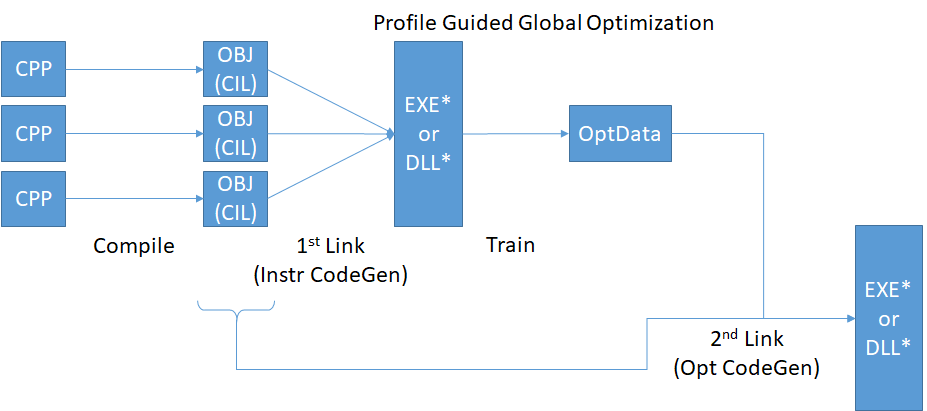
PGO is a native compilation technology used by the C++ compiler to generate better optimized code. It consists of a 2 step compilation process: a training run that records information about execution, and an optimized build step that feeds back the training results to generate better code. Historically, the most important benefit in performance is the improvements in laying out code in the image to have better working and reference set locality.
Because PGO only applies to the internal native compiled components of the runtime and JIT, .NET Core users do not need to take any specific action in order to realize the benefits of this work: all managed applications automatically get the benefit of PGO because it is applied to the runtime and JIT, which are the components that drive managed execution. The expected benefits will vary on various .NET applications depending upon size and make-up of your application.
In this release, we’ve applied those optimizations to the native parts of the runtime, based on profiling data from typical .NET applications.
In a future release, we’re planning on applying similar optimizations to the managed components of the .NET Core stack. We’ll also add new training scenarios in order to include a broader sample of representative code.
PGO in .NET Core 2.0
We’ve been using PGO on .NET Framework on Windows for many years. On Windows x64, we already released with PGO in .NET Core 1.1. With .NET Core 2.0, we’re bringing the same optimizations to Windows x86 and Linux x64.
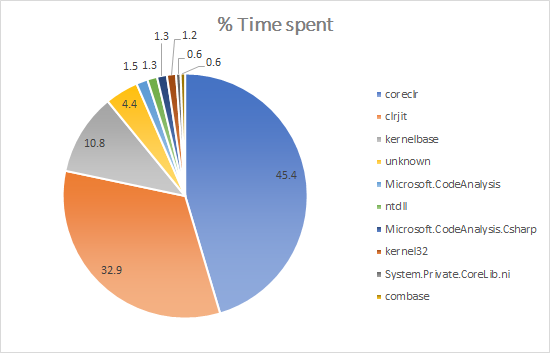
In order to determine what components to focus on, we measured what native DLLs applications were spending the most time running during startup. We observed that more than 3/4 of startup time was spent in only two DLLs: coreclr.dll (libcoreclr.so on Linux) and clrjit.dll (libclrjit.so on Linux).
The case of the jitter is particularly interesting. In previous releases, we had two different jitters: JIT32 for x86, and RyuJIT for x64. JIT32 is also the historic jitter that we used in the .NET Framework, and that has seen years of optimization. It’s generally faster at generating code at startup, but the resulting code is not as good and as fast as RyuJIT’s. With 2.0, we’ve standardized on RyuJIT on all architectures and platforms. RuyJIT has slower startup in some scenarios, but PGO allows us to mitigate that performance price, and bring it close to JIT32 performance. The quality of the jitted code is what truly justifies it, however. In some cases, such as SIMD, the code quality is so much higher that its performance beats what JIT32 was producing by factors of several hundreds.
On Linux, our goal is to bring parity of performance, but the fragmentation of the ecosystem makes PGO a much harder task than on Windows. The compiler toolchains are different from distro to distro, and even different versions of a tool such as LLVM can cause significant degradation in our ability to apply PGO. We want .NET to be able to target all those platforms, but we also want the versions that we ship to be all optimized equally well.
A simplifying factor on Linux is that we’re now building a unique “Linux” version of .NET, that we’re then packaging into native installers and tarballs. This made it possible to apply the PGO optimizations to all the distributions that consume those common bits with reduced complexity.
Along with PGO, we’re also deploying link-time optimization (LTO), corresponding to the -flto clang switch. LTO applies optimizations at the level of the entire linked binaries rather than module by module. We were already applying LTO on Windows in previous versions, and our measurements of the performance impact justified applying it to more platforms. Interestingly, we found that on Linux, LTO on its own doesn’t significantly affect the results, but together with PGO, the benefits are nearly doubled from PGO on its own.
Results
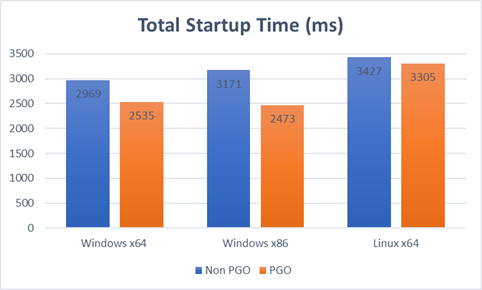
The following results show total startup times defined as time to main plus first request measured on a representative ASP.NET Core application after a warm-up iteration. Times are in milliseconds (lower is better).
Windows x64 results
| App Startup | .NET Core 2.0 non-PGO | .NET Core 2.0 PGO | PGO improvement |
|---|---|---|---|
| Time to Main | 647 | 537 | 17% |
| First Request | 2322 | 1998 | 14% |
| Total Startup | 2969 | 2535 | 15% |
Windows x86 results
| App Startup | .NET Core 2.0 non-PGO | .NET Core 2.0 PGO | PGO improvement |
|---|---|---|---|
| Time to Main | 679 | 550 | 19% |
| First Request | 2492 | 1923 | 23% |
| Total Startup | 3171 | 2473 | 22% |
Linux x64 results
| App Startup | .NET Core 2.0 non-PGO | .NET Core 2.0 PGO | PGO improvement |
|---|---|---|---|
| Time to Main | 1421 | 1394 | 2% |
| First Request | 2006 | 1910 | 5% |
| Total Startup | 3427 | 3305 | 4% |
The Linux numbers leave room for improvement in future versions: the time to main is higher than it is on Windows, and the PGO wins are less important overall.
How to profile and optimize your own application?
The tools employed to get PGO on the native parts of the .NET stack are not specific to .NET, and are available for anyone to apply to their own code, or to a custom build of .NET:
The CMake script used to apply these optimizations on the Core CLR is also available on GitHub.
Conclusion
.NET Core 2.0 is an important performance release of an already very fast platform. We’re committed to continuing on that trend, and to making .NET the fastest general-purpose development environment. PGO is an integral part of this strategy, that automatically benefits all .NET Core 2.0 applications.
 Light
Light Dark
Dark
0 comments