Diagnostic Tools debugger window in Visual Studio 2015
Note: this post has been updated for Visual Studio 2015 RTM
This blog post introduces the new Diagnostic Tools window in Visual Studio 2015. First we’ll define what we mean by diagnostic tools, then we’ll introduce the Diagnostic Tools window, and then we’ll dive into the different tools in the window.
What are Diagnostic Tools?
First let’s define what we mean when we say “Diagnostic Tools” in Visual Studio. Diagnostic tools means different things to different people, and some would consider the debugger itself to be a diagnostic tool. In this context, when we say Diagnostic Tools, we mean tools that allow you to see historical information (data collected over time), as opposed to just a single moment in time (like when you are stopped at a live breakpoint). By that definition, there are three main examples of diagnostic tools that were available previously in Visual Studio 2013:
- The Output window: allows you to see program output and other debugger events while it is running
- IntelliTrace: allows you to see interesting events in your application and set the debugger back in time so that you can look at historical data in the Call Stack, and Locals windows. You can also see the list of every method call and its parameters (even when that method is no longer on any call stack).
- The Performance and Diagnostics hub: allows you to perform a comprehensive performance analysis of your app as it runs without the debugger. You have your choice of performance tools to use, such as the CPU Usage tool and the Memory Usage tool, depending on the nature of the performance issue.
As you will see, we have taken all of these diagnostic tools and brought them closer together into a unified window. This new experience offers you two benefits:
- The ability to monitor performance while debugging, and correlate performance data with debugging activity, and
- A much richer and more useful experience for IntelliTrace and the Output window, dramatically shortening the time it takes you to diagnose an issue or verify a fix.
Diagnostic Tools window
Our vision for Diagnostics Tools during debugging is just beginning, and for our first release in Visual Studio 2015 CTP 5, the main change that you will notice when debugging is the new Diagnostic Tools window. If your project type and debugging configuration is supported (as described at the end of the post), you will now see a “Diagnostic Tools” window appear when you start debugging (press F5):
The diagnostic tools in this window surface information in two complementary ways: by adding graphs to the timeline in the upper half of the window, and by providing detailed information in the tabs in the bottom half of the window. Diagnostic tools use graphs to surface at-a-glance information, and when you see something of interest you can select a range of time (as described in the next section) to filter the detailed information in the tabs below.
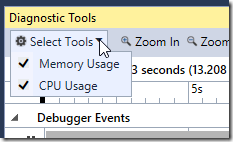
With the current release, you will see 3 tools in the Diagnostics Tools window: Events, Memory Usage tool, and CPU Usage tool. You can enable or disable the CPU and Memory tools by clicking on the select tools dropdown:
It is worth noting that the Events tool two different tracks showing events that occur while debugging: Break events, and IntelliTrace events. Next we’ll examine each one of those tracks under the Debugger, and then we’ll talk about the CPU Usage and Memory Usage tools.
Break events track and automatic time range selection
The Debugger break event track at the top of the timeline provides a visual history of events that stopped or resumed the execution of the application. This includes breakpoints being hit, stepping through code, clicking the Break All (pause) button, breaking exceptions, and Debugger.Break() statements in code. The rectangles indicate the amount of time the app was running in between break events, and colored line that you see when hovering over the rectangles indicates whether the app was paused due to a breakpoint being hit (indicated by red), for a step running to completion (indicated by yellow), or for Break All (indicated by blue).
You will notice that the range of time selected and the current zoom level in the timeline will update automatically as you set breakpoints and step, to reflect your latest debugging actions. The detail tabs at the bottom of the window are filtered to the selected range of time so that you automatically see data for your most recent debug actions.
When you press F5 or click Continue, the next time you hit a breakpoint in the debugger the time selection will start at the time you pressed F5, and end at the current breakpoint:
Notice that the red rectangle indicates the duration that the program ran since the last breakpoint (or since starting the program if this is the first breakpoint hit).
When you step in the debugger (e.g. with F10, F11, or Ctrl+F10), the start time of the selection will stay the same, but the end of the selection will expand to include the last step:
If you want something other than the automatic time selection, you can change the selection at any time by clicking on one of the debug break actions to snap the selected range of time to that event:
…or by clicking and dragging on the graphs or the ruler to select a more specific range of time:
The new and improved IntelliTrace experience
In Enterprise SKUs IntelliTrace enhances the debugging experience and saves you valuable debugging time! It does that by capturing additional events with useful information about your program’s execution, allowing you to identify potential root causes with fewer debugging iterations. The data it collects appear as events the IntelliTrace track and in the table in the Events details tab.
For all events (except for Output events), IntelliTrace also captures information that allows you to set the debug windows back in time and see the call stack, and local variables at the time that the event occurred. Simply select an event in the table and click “Activate Historical Debugging” to take advantage of this feature.
You can also change IntelliTrace’s collection options (In Tools -> Options -> IntelliTrace) to capture call information and see a full history of every method call and the parameters passed. For a deep dive on the IntelliTrace experience please see the dedicated IntelliTrace blog post.
IntelliTrace shows debug messages from the Output window
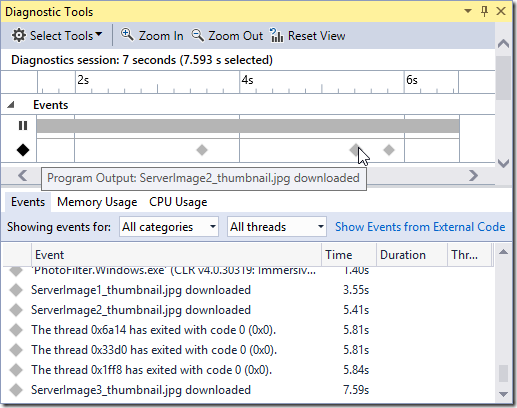
Messages that are sent to the Debug tab of the Output window are captured by IntelliTrace so that you can see where debug output occurred over time in the Output track:
This allows you to visually scan and quickly identify the information that interests you. You can hover the mouse over each individual event to quickly see the output message, and select the range of time to see the detailed list of output events in the debugger details tab.
In the table you will see the time stamps for each output event. Not only does this provide useful timing information that is not available in the Output window, it also saves you from having to change your code to log this information manually when you need it. If you find that you prefer to use the Output window, it is still there and you can continue to use it – but please let us know what we can do to make the Debugger Events tool work better for you.
Memory Usage tool while debugging
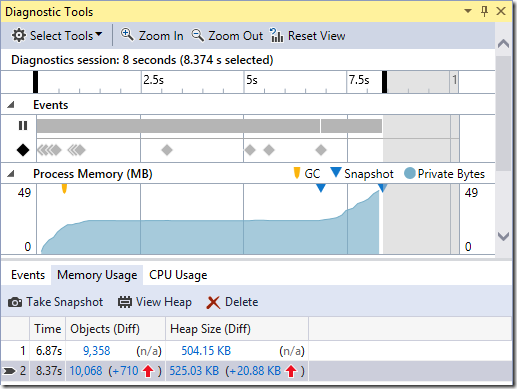
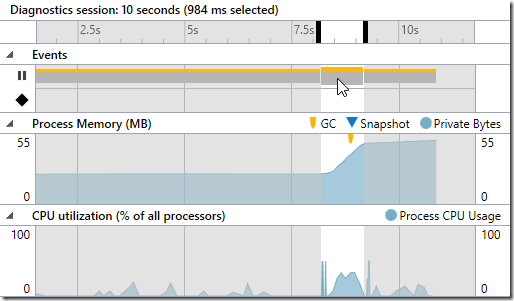
You will notice that we have brought the Memory Usage tool into the debugging experience, allowing you to monitor memory usage and investigate memory issues while you are debugging.
You can simply glance at the graphs to see the Memory impact of your app, and the break events allow you to identify the parts of the graph that are related to recent debugging activity. You can take snapshots before and after various debug actions and then drill-into those snapshots to analyze memory usage and memory growth. For more on memory please see the dedicated Memory Usage blog post.
Monitoring and measuring performance
Debugger PerfTips (announced in CTP3) provide performance information right in your code as you set breakpoints and step with the debugger.
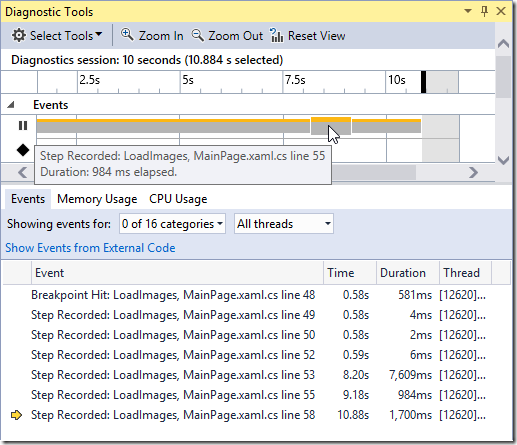
You might find yourself searching for pen and paper to write down the values shown in the PerfTips. Now you can click on the PerfTips to bring the Diagnostic Tools window into focus so that you can see all previous PerfTip values. The elapsed time for previous PerfTips can be found by hovering over the events in the Debugger break event track, and in the duration column for break events in the Debugger Events details tab.
Note that in the screenshot above we filtered out all IntelliTrace events showing, which allows you to focus in on just the PerfTip history using the break events in the table.
The CPU Usage graph allows you to see how much CPU resources are used by your code. You can use the break events track to correlate spikes in CPU with code that was running between breakpoints.
If you spot a potential issue when debugging, you can get a per-function breakdown of CPU Usage by running the CPU Usage tool without the debugger. To do this go to Debug -> Start Diagnostic Tools without Debugging, select CPU Usage, and click Start.
Supported project types and configurations
The following startup project types and debugging configurations are supported by the Diagnostic Tools window in Visual Studio 2015:
- Managed WPF, WinForms, Console projects
- Native Win32, Console, and MFC projects
- ASP.NET projects running on a local IIS and IIS Express
- Managed or Native Windows Store projects
- Debugging sessions started using Debug –> Attach to Process
- Debugging apps running on remote desktop devices
The Diagnostic Tools window currently does not support:
- Windows Store projects that are using JavaScript
- Windows Store projects that are running on a Windows Phone
- Debugging when Managed or Native Compatibility Mode is checked in Tools –> Options –> Debugging
Give it a try and tell us what you think!
We are excited about the new experience for our diagnostic tools in Visual Studio and the new capabilities it provides to developers. You can try out these new features now by downloading Visual Studio 2015 RC, and if you do, please give us your feedback so that we can improve. You can leave general comments & questions at the end of this blog post or via Send-a-Smile, and submit feature requests to our Diagnostics UserVoice.
For an in-depth look at how to use these features, be sure check out the following blog posts:
- IntelliTrace in Visual Studio Enterprise 2015
- Walkthrough of Live Debugging using IntelliTrace in Visual Studio 2015 (Text Editor)
- Walkthrough of Live Debugging using IntelliTrace in Visual Studio 2015 (Social Club)
- Memory Usage tool while debugging in Visual Studio 2015
- Diagnosing Event Handler Leaks with the Memory Usage Tool in Visual Studio 2015
- PerfTips: Performance information at-a-glance while debugging with Visual Studio
… and videos:
- PerfTips and the Diagnostic Tools Window
- Visual Studio 2015 Diagnostic Tools
- Historical Debugging with IntelliTrace in Visual Studio 2015
- Debugging Performance Issues Using Visual Studio 2015





 Light
Light Dark
Dark
0 comments