Visual Studio Code Java Debugger Adding Step Filter and Expression Evaluation
Happy new year! We’d like to thank you all for using Visual Studio Code for your Java development as well as for sharing your feedback. Within just three months, we’ve published 5 releases for our Debugger for Java extension for Visual Studio Code and received 400K+ downloads. With our new 0.5.0 release, we’re adding two new exciting features: Expression Evaluation and Support Step Filters.
Expression Evaluation
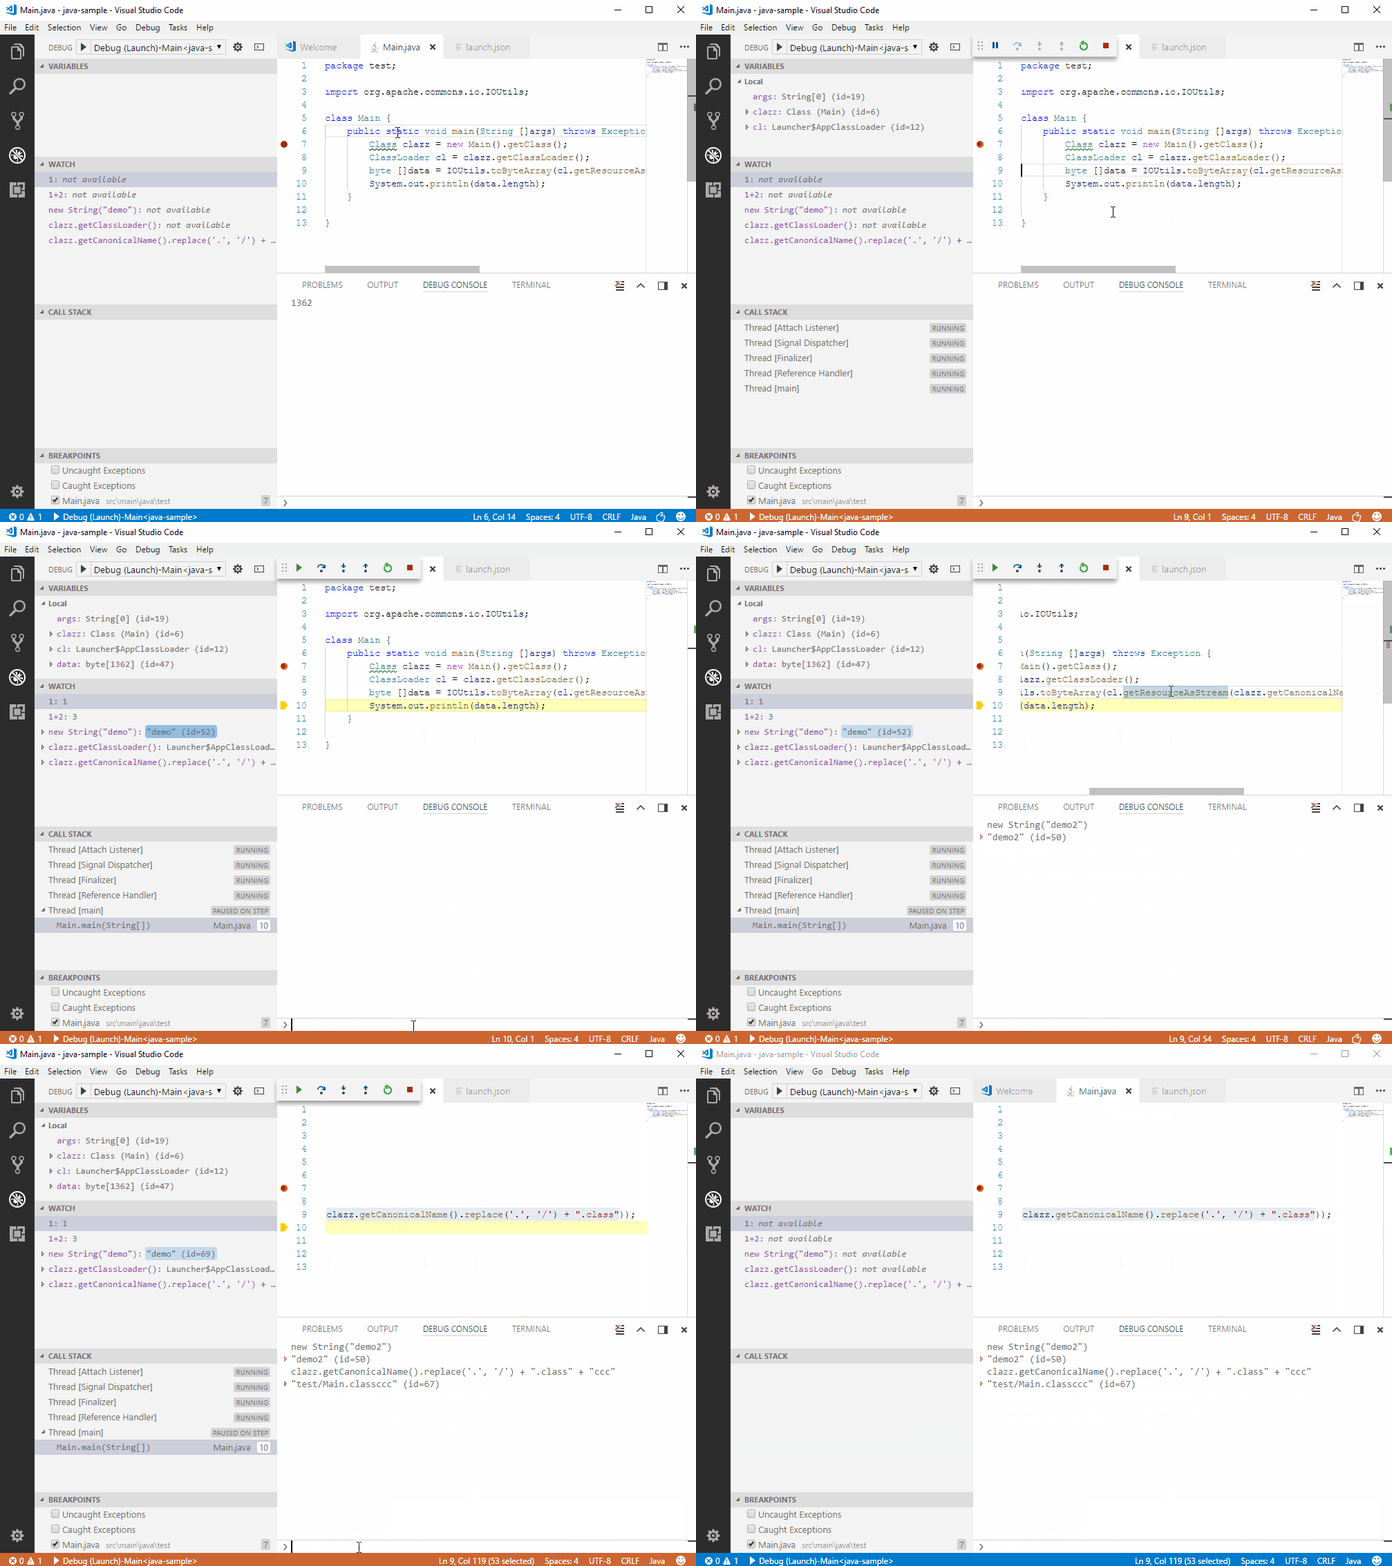
The debugger now enables you to evaluate expressions in variable watch window as well as debug console at runtime. So now you can see the value of both the simple variables, single-line expressions, as well as short code fragments within the running context. You can then monitor and validate the change of the value when your code is being executed. See below
Support step filter
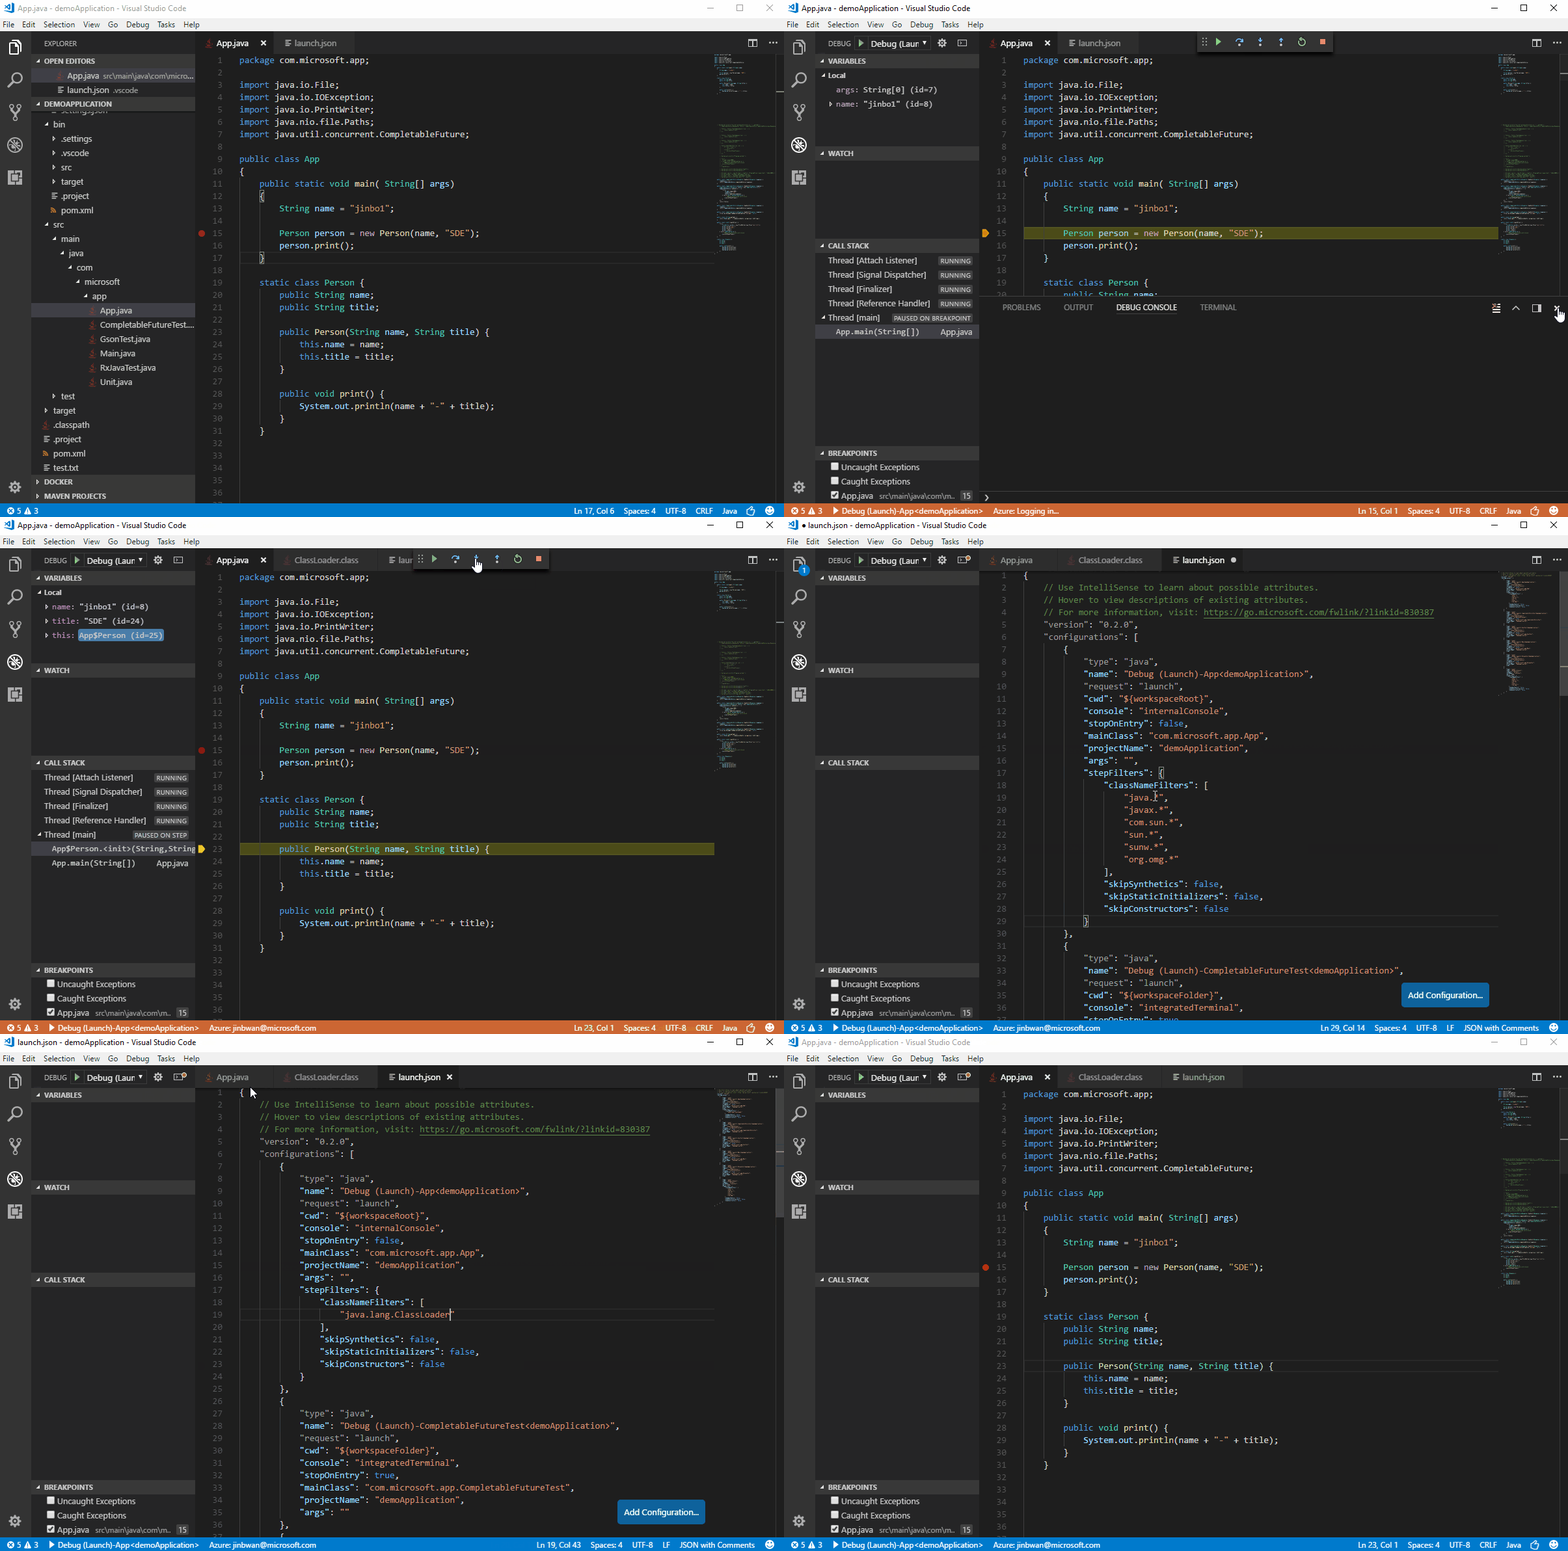
Step filters are commonly used to filter out types that you do not wish to see or step through while debugging. With this feature, you can configure the packages to filter within your launch.json so they could be skipped when you step through. See below
Other updates
This release also includes a few other enhancements:
- Publish the binaries to the maven central repository
- Adopt new Visual Studio Code 1.19.0 debug activation events
- Improving searching performance by looking up the stack frame’s associated source file from source containers directly instead of leveraging the original jdt search engine
- Bug fixes
You can find more details in our changelog.
Try it out
If you’re trying to find a performant editor for your Java project, please give Visual Studio Code a try
- Install the Java Extension Pack which includes the Language Support for Java(TM) by Red Hat, Debugger for Java and Test Runner/Debugger for Java.
- Learn more about Java on Visual Studio Code.
- Explore our step by step Java Tutorials on Visual Studio Code.
- You can submit a bug or feature request to Java Debugger Extension and participate in our community-driven Gitter channel for discussion.


 Light
Light Dark
Dark
0 comments