Ask Learn
Preview
Ask Learn is an AI assistant that can answer questions, clarify concepts, and define terms using trusted Microsoft documentation.
Please sign in to use Ask Learn.
Sign inThis browser is no longer supported.
Upgrade to Microsoft Edge to take advantage of the latest features, security updates, and technical support.
Note
Access to this page requires authorization. You can try signing in or changing directories.
Access to this page requires authorization. You can try changing directories.
This post demonstrates how the OMS Log search queries listed in the mapping table for each ACS Audit Report can be used to drive visualizations for an OpsMgr Featured Audit Collection Services (ACS) Dashboard based on the security events collected by the Security and Audit Solutions in OMS Log Analytics.

The ACS Summary Tile and Dashboard can be configured using the OMS View Designer feature in your OMS Log Analytics workspace. Adding the Security and Audit solution to an OMS workspace will allow Windows security events, Windows application events, and Windows firewall logs to be collected using direct agents or MMA agents that the user enabled.
Here are the steps to create the Summary Tile for the ACS Dashboard, and the Visualization Parts (Views) in the Dashboard Overview that provides a highlight for each ACS Audit Report using the log search queries listed in the mapping table:
(Note: Total time to create the ACS Dashboard in your OMS workspace using the View Designer may take up to 2 hours.)
Step 1: Create the ACS Summary Tile
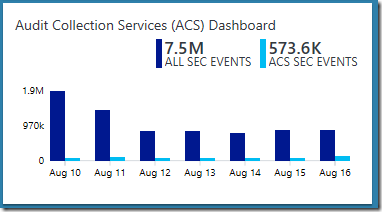
Preferred Tile Type: Two Timelines Tile
Explanation: To compare the total number of security events collected by the Security and Audit Solution with all the security events that are reported by the ACS Audit Reports, in total and over the last 7 days.
Configuration Overview:
Step 2: Create the Further Information and Forensic Views in the Dashboard Overview
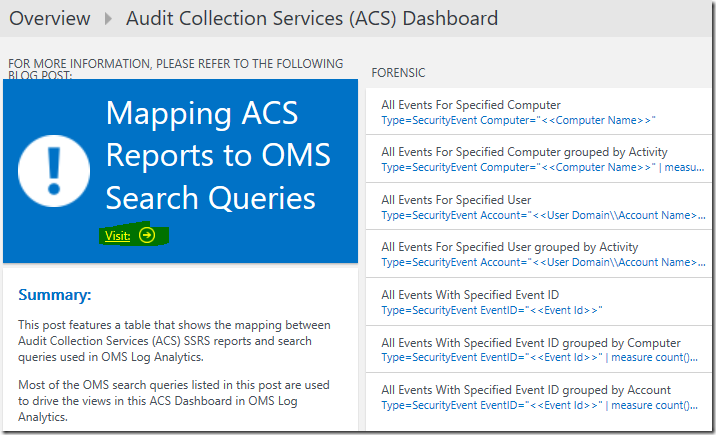
Further Information View:
Preferred Visualization Part: Information Part
Explanation: Provides a shortcut to the ACS Reports to OMS Search Queries Mapping Table for the user to acquire further information on the topic.
Configuration Overview:
Label: Mapping ACS Reports to OMS Search Queries
Summary Text:
This post features a table that shows the mapping between Audit Collection Services (ACS) SSRS reports and search queries used in OMS Log Analytics.
Most of the OMS search queries listed in this post are used to drive the views in this ACS Dashboard in OMS Log Analytics.
Forensic View:
Preferred Visualization Part: List of Queries Part
Explanation: Displays a list of search queries to analyze security events collected for a specific computer, a particular user or an Event ID. The user can click on each query and fill in the values for the filter replacing the <<string>> to display its results.
Configuration Overview:
(Note: Please re-type the double quote characters as they may be re-encoded into a format that is not compatible with OMS Log Analytics)
For more information, please refer to the following post:
Leveraging OMS Log Search to Analyze Security Events for a Specific Computer/User/EventID
https://blogs.msdn.microsoft.com/wei_out_there_with_system_center/2016/08/03/leveraging-oms-log-search-to-analyze-security-events-for-a-specific-computerusereventid/
Step 3: Create the Planning and System Integrity Check Views in the Dashboard Overview
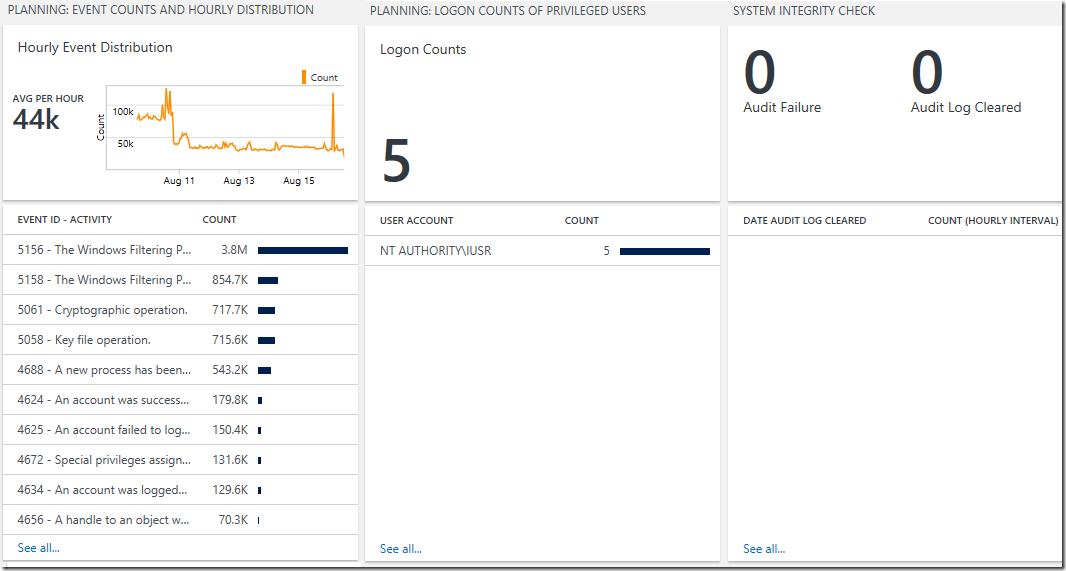
Event Counts and Hourly Distribution View:
Preferred Visualization Part: Line chart, Callout, & List Part
Explanation: The header displays a line chart of the distribution of all security events collected by the Security and Audit Solution on an hourly interval within the last 7 days. The callout shows the average amount of security events collected per hour and the list displays the top 10 security events with the highest count collected over the last 7 days.
Configuration Overview:
For more information, please refer to the following post:
Leveraging OMS Log Search to Help Planning and Tuning of Audit Policies
https://blogs.msdn.microsoft.com/wei_out_there_with_system_center/2016/08/02/leveraging-oms-log-search-to-help-planning-and-tuning-of-audit-policies/
Logon Counts of Privileged Users View:
Preferred Visualization Part: Number and List Part
Explanation: The header has a single number showing the total number of logon counts of privilege users and the list displays the top 10 privilege users with the highest logon counts over the last 7 days.
Configuration Overview:
(Note: Please re-type the double quote characters as they may be re-encoded into a format that is not compatible with OMS Log Analytics)
For more information, please refer to the following post:
Leveraging OMS Log Search to Help Planning and Tuning of Audit Policies
https://blogs.msdn.microsoft.com/wei_out_there_with_system_center/2016/08/02/leveraging-oms-log-search-to-help-planning-and-tuning-of-audit-policies/
System Integrity Check View:
Preferred Visualization Part: Two number and List Part
Explanation: The header has one number showing the number of audit failures and a separate number showing the number of times the audit logs were cleared over the last 7 days. The list displays the number of times the audit log was cleared per hour over the last 10 hours.
Configuration Overview:
For more information, please refer to the following post:
Leveraging OMS Log Search to Capture Audit Failures and Audit Log Tampering:
https://blogs.msdn.microsoft.com/wei_out_there_with_system_center/2016/08/04/leveraging-oms-log-search-to-track-audit-failures-and-audit-log-tampering/
Step 4: Create the Access Violation Related Activities View in the Dashboard Overview
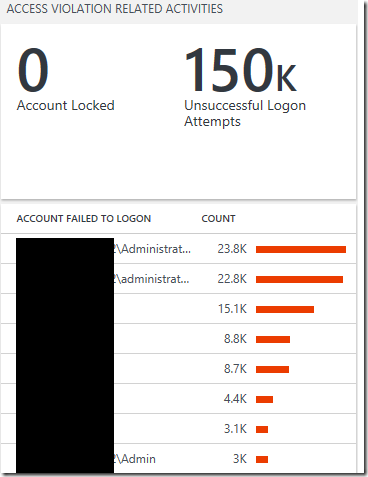
Access Violation Related Activities View:
Preferred Visualization Part: Two number and List Part
Explanation: The header has one number showing the total number of accounts locked and a separate number showing the number unsuccessful logon attempts over the last 7 days. The list displays the top 10 accounts with the highest number of failed logon attempts over the last 7 days.
Configuration Overview:
For more information, please refer to the following post: Leveraging OMS Log Search to Identify Potential Access Violation Activities
https://blogs.msdn.microsoft.com/wei_out_there_with_system_center/2016/07/30/leveraging-oms-log-searches-to-identify-potential-access-violation-activities/
Step 5: Create the Account Management Views in the Dashboard Overview

User Accounts Created Or Deleted View:
Preferred Visualization Part: Two number and List Part
Explanation: The header has one number showing the total number of user accounts created and a separate number showing the total number of user accounts deleted over the last 7 days. The list displays the top 10 user accounts created or deleted related security events with the highest count over the last 7 days.
Configuration Overview:
For more information, please refer to the following post:Leveraging OMS Log Search for Account Management and Audit Reporting
https://blogs.msdn.microsoft.com/wei_out_there_with_system_center/2016/07/31/leveraging-oms-log-search-for-account-management-and-audit-reporting/
Domain and Built-in Administrators Membership Changes View:
Preferred Visualization Part: Two number and List Part
Explanation: The header has one number showing the total number of members added and a separate number showing the number members removed over the last 7 days. The list displays the top 10 user membership change related security events with the highest count over the last 7 days.
Configuration Overview:
(Note: Please re-type the double quote characters as they may be re-encoded into a format that is not compatible with OMS Log Analytics)
For more information, please refer to the following post:
Leveraging OMS Log Search for Account Management and Audit Reporting
https://blogs.msdn.microsoft.com/wei_out_there_with_system_center/2016/07/31/leveraging-oms-log-search-for-account-management-and-audit-reporting/
Password Change Attempts by Non-owner View:
Preferred Visualization Part: Number and List Part
Explanation: The header has a single number showing the total number of password change attempts by non-owner and the list displays the top 10 account that are non-owners with the highest number of password changes over the last 7 days.
Configuration Overview:
(Note: Please re-type the double quote characters as they may be re-encoded into a format that is not compatible with OMS Log Analytics)
For more information, please refer to the following post:
Leveraging OMS Log Search for Account Management and Audit Reporting
https://blogs.msdn.microsoft.com/wei_out_there_with_system_center/2016/07/31/leveraging-oms-log-search-for-account-management-and-audit-reporting/
Step 6: Create the Policy Views in the Dashboard Overview

Account and Audit Policy Changed View:
Preferred Visualization Part: Two number and List Part
Explanation: The header has one number showing the total number of account policy changed and a separate number showing the total number of audit policy changed over the last 7 days. The list displays the top 10 account and audit policy changed related security events with the highest count over the last 7 days.
Configuration Overview:
For more information, please refer to the following post:
Leveraging OMS Log Search to Track Policy and Permission Changes
https://blogs.msdn.microsoft.com/wei_out_there_with_system_center/2016/08/05/leveraging-oms-log-search-to-track-policy-and-permission-changes/
For more information, please refer to the following post:
Leveraging OMS Log Search to Track Policy and Permission Changes
https://blogs.msdn.microsoft.com/wei_out_there_with_system_center/2016/08/05/leveraging-oms-log-search-to-track-policy-and-permission-changes/
For more information, please refer to the following post:
Leveraging OMS Log Search to Track Policy and Permission Changes
https://blogs.msdn.microsoft.com/wei_out_there_with_system_center/2016/08/05/leveraging-oms-log-search-to-track-policy-and-permission-changes/
Step 7: Create the Usage Views in the Dashboard Overview
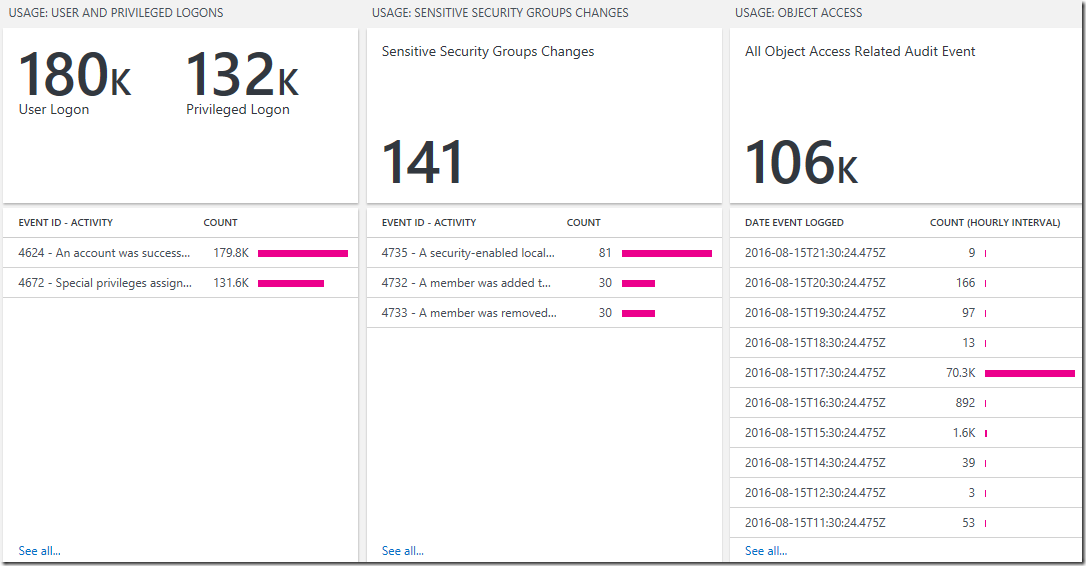
User and Privileged Logons View:
Preferred Visualization Part: Two number and List Part
Explanation: The header has one number showing the total number of user logon events and a separate number showing the total number of privileged logon events over the last 7 days. The list displays the top 10 user and privileged logon related security events with the highest count over the last 7 days.
Configuration Overview:
For more information, please refer to the following post:Leveraging OMS Log Search to Report on User Logon and Object Access Events
https://blogs.msdn.microsoft.com/wei_out_there_with_system_center/2016/08/05/leveraging-oms-log-search-to-report-on-user-logon-and-object-access-events/
Sensitive Security Groups Changes View:
Preferred Visualization Part: Number and List Part
Explanation: The header has a single number showing the total number of sensitive security groups changes and the list displays the top 10 related security events with the highest count over the last 7 days..
Configuration Overview:
For more information, please refer to the following post:
Leveraging OMS Log Search to Report on User Logon and Object Access Events
https://blogs.msdn.microsoft.com/wei_out_there_with_system_center/2016/08/05/leveraging-oms-log-search-to-report-on-user-logon-and-object-access-events/
For more information, please refer to the following post:Leveraging OMS Log Search to Report on User Logon and Object Access Events
https://blogs.msdn.microsoft.com/wei_out_there_with_system_center/2016/08/05/leveraging-oms-log-search-to-report-on-user-logon-and-object-access-events/
A shout out and kudos to my colleague Meir Mendelovich (OMS PM) for sharing his knowledge and his time in helping me validate the mapping table and ACS Dashboard in OMS.
To view the complete mapping between all Audit Collection Services (ACS) SSRS reports and search queries used in OMS Log Analytics, refer to:
https://blogs.msdn.microsoft.com/wei_out_there_with_system_center/2016/07/25/mapping-acs-reports-to-oms-search-queries/
Additional Resources:
Log Analytics View Designer by Brian Wren
https://azure.microsoft.com/en-us/documentation/articles/log-analytics-view-designer/
Log Analytics View Designer Tile Reference by Brian Wren
https://azure.microsoft.com/en-us/documentation/articles/log-analytics-view-designer-tiles/
Log Analytics View Designer visualization part reference by Brian Wren
https://azure.microsoft.com/en-us/documentation/articles/log-analytics-view-designer-parts/
Ask Learn is an AI assistant that can answer questions, clarify concepts, and define terms using trusted Microsoft documentation.
Please sign in to use Ask Learn.
Sign in