Ask Learn
Preview
Please sign in to use this experience.
Sign inThis browser is no longer supported.
Upgrade to Microsoft Edge to take advantage of the latest features, security updates, and technical support.
Note
Access to this page requires authorization. You can try signing in or changing directories.
Access to this page requires authorization. You can try changing directories.
Arvind Shyamsundar
Reviewed by: Gjorgji Gjeorgjievski, Sunil Agarwal, Vassilis Papadimos, Denzil Ribeiro, Mike Weiner, Mike Ruthruff, Murshed Zaman, Joe Sack
In a previous post we have introduced you to the parallel INSERT operator in SQL Server 2016. In general, the parallel insert functionality has proven to be a really useful tool for ETL / data loading workloads. As an outcome of various SQLCAT engagements with customers, we learnt about some nuances when using this feature. As promised previously, here are those considerations and tips to keep in mind when using parallel INSERT...SELECT in the real world. For convenience we have demonstrated these with simple examples!
To start with, our baseline timing for the test query which used serial INSERT (see Appendix for details) is 225 seconds. The query inserts 22,537,877 rows into a heap table, for a total dataset size of 3.35GB. The execution plan in this case is shown below, as you can see both the FROM portion and the INSERT portion are serial.

As mentioned in our previous post, we currently require that you use a TABLOCK hint on the target of the INSERT (again this is the same heap table as shown above) to leverage the parallel INSERT behavior. If we do this, you will see the dramatic difference with the query taking 14 seconds. The execution plan is as below:

For row store targets, it is important to note that the presence of a clustered index or any additional non-clustered indexes on the target table will disable the parallel INSERT behavior. For example, here is the query plan on the same table with an additional non-clustered index present. The same query takes 287 seconds without a TABLOCK hint and the execution plan is as follows:

When TABLOCK is specified for the target table, the query completes in 286 seconds and the query plan is as follows (there is still no parallelism for the insert – this is the key thing to remember.)

Also, please refer to The Data Loading Performance Guidewhich has more considerations on ‘Bulk Loading with Indexes in Place’.
It is quite common to find IDENTITY columns being used as the target table for INSERT…SELECT statements. In those cases, the identity column is typically used to provide a surrogate key. However, IDENTITY will disable parallel INSERT, as you can see from the example below. Let’s modify the table to have an identity column defined:
 CREATE TABLE DB1BCoupon_New(
[IdentityKey] bigint NOT NULL IDENTITY(1,1),
[ItinID] [bigint] NULL,
[Coupons] [smallint] NULL,
[Year] [smallint] NULL,
[Quarter] [smallint] NULL,
… (table definition is truncated for readability). When we run the below INSERT query:
 INSERT tempdb.[dbo].[DB1BCoupon_New] WITH (TABLOCK)
(ItinID, Coupons, ... Gateway, CouponGeoType)
SELECT ItinID, Coupons, ... Gateway, CouponGeoType
FROM DB1b.dbo.DB1BCoupon_Rowstore AS R
WHERE Year = 1993
OPTION (MAXDOP 8);
We see that the parallel insert is disabled (query plan below). The query itself completes in 104 seconds, which is a great improvement, but that is primarily because of the minimal logging. As an aside, the highlighted Compute Scalar below is because of the identity value calculation.

It is important to know that if there is an IDENTITY column in the target table or if a SEQUENCE object is referenced in the query, the plan will be serial. To work around this limitation, consider using a ROW_NUMBER() function as shown below. Do note that in this case, you can either leverage IDENTITY_INSERT (which has its own considerations), or declare the column in the table without the IDENTITY property. For this demo, I set IDENTITY_INSERT ON:
SET IDENTITY_INSERT [dbo].[DB1BCoupon_New] ON
Here is the abridged version of this query:
 INSERT tempdb.[dbo].[DB1BCoupon_New] with (TABLOCK)
(IdentityKey, ItinID, Coupons, ..., CouponType, TkCarrier,
OpCarrier, FareClass, Gateway, CouponGeoType)
SELECT ROW_NUMBER() OVER (ORDER BY (SELECT NULL)) AS IdentityKey,
ItinID, Coupons, ..., CouponType, TkCarrier,
OpCarrier, FareClass, Gateway, CouponGeoType
FROM DB1b.dbo.DB1BCoupon_Rowstore AS R
WHERE Year = 1993
OPTION (MAXDOP 8);
It turns out that this re-write of the query actually performs worse than the serial INSERT with the identity being generated. This re-write with the window function took 161 seconds in our testing. And as you can see from the plan below, the main challenge here seems to be that the source data is being read in serial.

This looks disappointing, but there is hope! Read on…
In the test setup, we also had created a clustered ColumnStore (CCI) version of the source table. When the test query is modified to read from the CCI instead of the rowstore version (with the above re-write for identity value generation), the query runs in 12 seconds! The main difference between this and the previous case is the parallelism in the data read, and the parallel window function which is new to SQL 2016. And the Columnstore scan does run in Batch mode.

Here is the drilldown into the Window Aggregate. As you can see in the ‘Actual Execution Mode’ attribute, it is running in Batch mode. And it uses parallelism with 8 threads. For more information on batch mode Window Aggregate, one of the best references is Itzik Ben-Gan’s two part series: Part 1 and Part 2.

When the target table is a clustered Columnstore index, it is interesting to note the ‘row group quality’ (how ‘full’ are the compressed row groups) after the insert. To test this, I re-created the target table with a clustered Columnstore index (CCI) defined on it. The table started as empty, and the INSERT statement was issued with a TABLOCK hint. The insert took 77 seconds (this is somewhat expected due to the compression required for the CCI) and the query plan is shown below:

The compute scalar operator above is purely because of the partition scheme applied. Now, let’s look at the Columnstore row groups created, by using the DMV query below:
 select partition_number, row_group_id, state_desc, transition_to_compressed_state_desc, trim_reason_desc, total_rows, size_in_bytes, created_time
from sys.dm_db_column_store_row_group_physical_stats
order by created_time desc
Here is the result:

The important thing to note for this parallel insert case is that multiple row groups are created and inserted into concurrently, each by one of the CCI insert threads. If we compare this to a case where parallel insert is not used, you will see differing timestamps for the various segments, which is an indirect way of telling that the insert was serial in that case. For example, if I repeat this test without TABLOCK on the destination table, then the query takes 418 seconds. Here is the query plan:

Let’s review briefly the row groups created in this case. We will use these results to discuss ‘row group quality’ in the next section. Here is the output from the row group DMV for the serial INSERT case:

The point of the previous two examples above is that in general, the parallel INSERT operation prefers throughput as opposed to segment (a.k.a. row group) quality. In some cases, if row group quality (having as ‘full’ a row group / having close to a million rows each) is important, then you may need to carefully adjust the degree of parallelism. For example:
Therefore, it is critical to adjust the degree of parallelism to balance throughput and row group quality.
Now, back to the heap, let’s see the effect of varying the degree of parallelism (DoP). Any allocation bottlenecks (primarily the number of data files and the I/O bandwidth) are the main constraint when it comes to increasing throughput with parallel INSERT. To overcome these, in our test setup, we have 480 data files for TEMPDB. This may sound excessive, but then we were testing on a 240 processor system! And this configuration was critical for testing parallel insert ‘at-scale’ as you will see in the next section.
For now, here are the test results with varying the DoP. For all cases, TABLOCK was used on the target table. In each case the INSERT query was the only major query running on the system. The chart and table below show the time taken to insert 22,537,877 rows into the heap, along with the Log I/O generated.
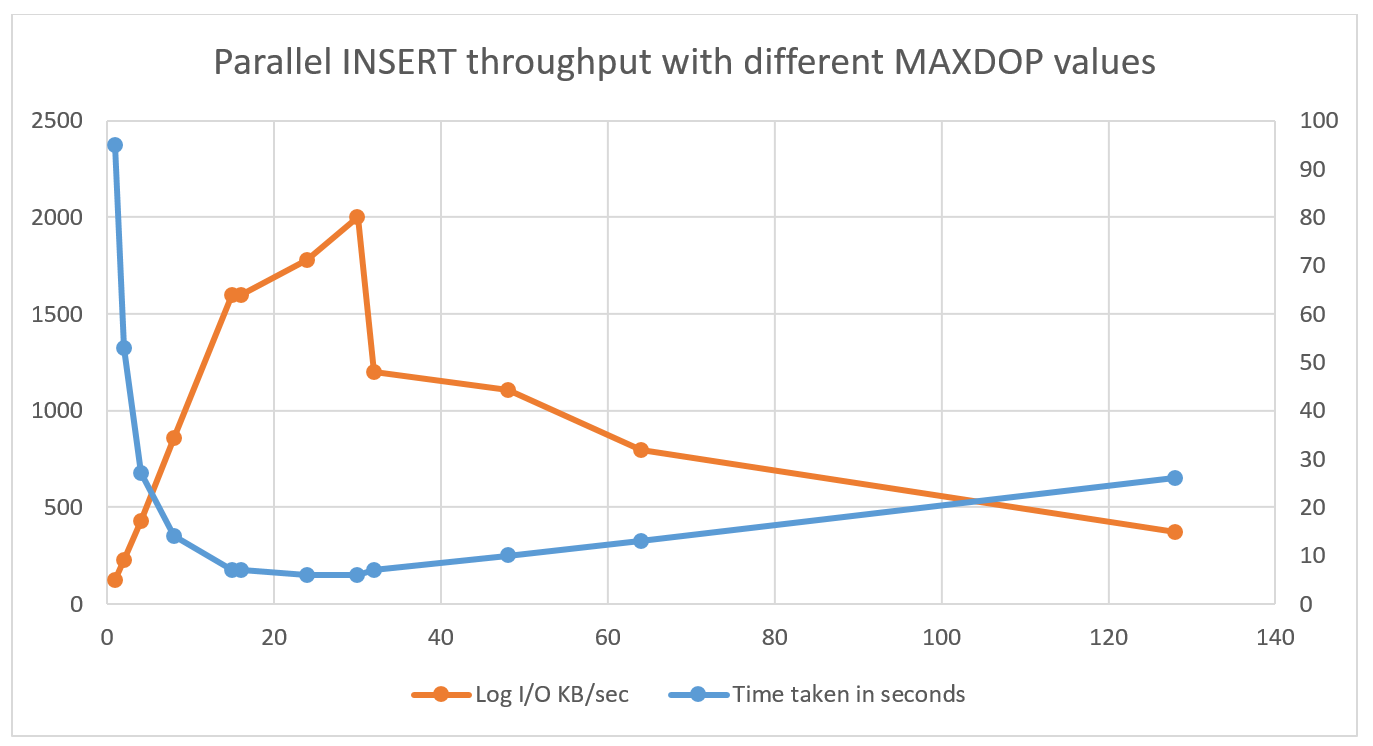
Here’s the raw data in case you prefer to see numbers:
| Degree of parallelism | Time taken in seconds | Log I/O KB/sec |
| 1 | 95 | 122 |
| 2 | 53 | 225 |
| 4 | 27 | 430 |
| 8 | 14 | 860 |
| 15 | 7 | 1596 |
| 16 | 7 | 1597 |
| 24 | 6 | 1781 |
| 30 | 6 | 2000 |
| 32 | 7 | 1200 |
| 48 | 10 | 1105 |
| 64 | 13 | 798 |
| 128 | 26 | 370 |
| 240 | 14 | 921 |
What can we conclude here? The ‘sweet spot’ seems to be the number 15, which (not coincidentally) is the number of cores per physical CPU in the test setup. Once we cross NUMA node boundaries, the costs of cross-node memory latency are steep – more details on this in the next section. An important note here is that your mileage will vary depending on the specific system configuration. Please ensure adequate tests are done in the specific environment before concluding on an optimal value for DoP.
Next, we decided to stress the system with multiple such parallel INSERT statements running. To do this optimally we used the RML utilities and created a simple SQL script which would each create a #temp table, parallel insert into it and then drop the table. The results are impressive, we are able to max out the system on the CPU front in some cases (given that these operations are minimally logged and in TEMPDB, there is no other major bottleneck.)

Here are the test results with various combinations of MAXDOP and concurrent requests into temporary tables. The MAXDOP 15 value seems to be the most efficient in this case because that way, each request lines up nicely with the NUMA node boundaries (each NUMA node in the system has 30 logical CPUs.) Do note that the values of MAXDOP and the number of connections were chosen to keep 240 threads totally active in the system.
| MAXDOP | Number of connections | Total rows inserted | End to end test timing seconds | Effective rows / second | CPU% | Log I/O KB / sec |
| 5 | 48 | 1,081,818,096 | 50 | 21,636,362 | 100 | 15850 |
| 8 | 30 | 676,136,310 | 33 | 20,488,979 | 90 | 15300 |
| 15 | 16 | 360,606,032 | 14 | 25,757,573 | 100 | 15200 |
| 30 | 8 | 180,303,016 | 11 | 16,391,183 | 75 | 13100 |
When we used the TABLOCK hint in the previous tests on heap tables, we also ended up leveraging another important optimization which has been around for a while now: minimal logging. When we monitor the amount of log space utilized in these cases, you will see a substantially lower amount of log space used in the case where TABLOCK is specified for the (heap) target table. Do note that for Columnstore indexes, minimal logging depends on the size of the insert batch, as is described by Sunil Agarwal in his blog post. Here’s a chart which compares these cases (Note: the graph below has a logarithmic scale for the vertical axis to efficiently accommodate the huge range of values!)
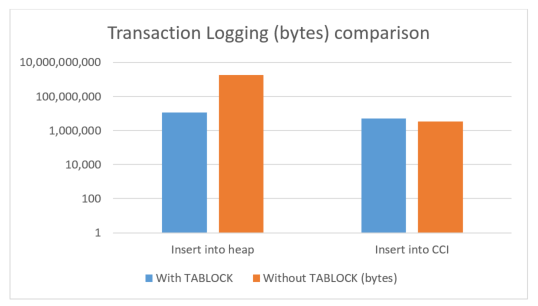
Given below is the raw data for the above chart:
| Log space used in TEMPDB | With TABLOCK | Without TABLOCK (bytes) |
| Insert into heap | 11,273,052 | 1,832,179,840 |
| Insert into CCI | 4,932,964 | 3,477,720 |
In the case of the CCI insert, the amount of transaction logging is very comparable. However, the insert into heap still requires a TABLOCK for minimal logging as is clearly evident in the large amount of transaction logging when TABLOCK is not specified.
[Update 16 Nov 2016: SQL Server 2016 SP1 reverts the behavior for inserts into local temporary tables to be the same as normal tables. For the record, the previous behavior (struck out below) for local temporary tables is only applicable to builds prior to SQL 2016 SP1. The KB article has also been updated to reflect the changes in SP1.
In the previous post, we mentioned that one of the key requirements for the INSERT operation to be parallel is to have a TABLOCK hint specified on the target table. This requirement is to ensure consistency by blocking any other insert / update operations. Now when it comes to ‘local’ temporary tables (the ones which have a single # prefix), it is implicit that the current session has exclusive access to the local temporary table. In turn, this satisfies the condition that otherwise needed a TABLOCK to achieve. Hence, if the target table for the INSERT is a ‘local’ temporary table, the optimizer will consider parallelizing the INSERT in case the costs are suitably high. In most cases, this will result in a positive effect on performance but if you observe PFS resource contention caused by this parallel insert, you can consider one of the following workarounds:
[Update 23 Aug 2016: For the rare cases where parallel insert may cause excessive PFS contention, there is a way to disable parallel INSERT to isolate the issue; see this KB article for details.]
A few additional points to consider when leveraging this exciting new capability are listed below. We would love your feedback (please use the Comments section below) on if any of the items below are blocking you in any way in your specific workloads.
Whew! We covered a lot here, so here’s a quick recap:
We hope you enjoyed this post, and if you did, we’d love to hear your comments! If you have questions as well please do not hesitate to ask!
For the tests in this post, we are using the Airline Origin and Destination Survey (DB1B) Coupon dataset. There are large number of rows in that table (we tested with one slice, for the year 1993) and this being a real-world dataset, it is quite representative of many applications. The destination table schema is identical to the source table schema. The test query is a very simple INSERT…SELECT of the form:
 INSERT tempdb.[dbo].[DB1BCoupon_New]
(ItinID, Coupons, ..., Gateway, CouponGeoType)
SELECT ItinID, Coupons, ..., Gateway, CouponGeoType
FROM DB1b.dbo.DB1BCoupon_Rowstore AS R
WHERE Year = 1993
OPTION (MAXDOP 8);
The use of the MAXDOP query hint is so that we can test with differing parallelism levels. The tests were performed on a SQL Server 2016 instance running on Windows Server 2012 R2. The storage used was high-performance local PCIe storage cards. SQL Server was configured to use large pages (-T834) and was set to a maximum of 3.7TB of RAM.
Here's the definition for the partition function:
CREATE PARTITION FUNCTION [pfn_ontime](smallint) AS RANGE RIGHT FOR VALUES (1987, 1988, 1989, 1990, 1991, 1992, 1993, 1994, 1995, 1996, 1997, 1998, 1999, 2000, 2001, 2002, 2003, 2004, 2005, 2006, 2007, 2008, 2009, 2010, 2011, 2012, 2013, 2014, 2015, 2016)
Here's the definition for the partition scheme used:
CREATE PARTITION SCHEME [ps_ontime] AS PARTITION [pfn_ontime] ALL TO ([PRIMARY])
Here's the definition for the table used:
 CREATE TABLE [dbo].[DB1BCoupon_Rowstore](
[ItinID] [bigint] NULL,
[Coupons] [smallint] NULL,
[Year] [smallint] NULL,
[Quarter] [smallint] NULL,
[Origin] [varchar](4) NULL,
[OriginAirportID] [smallint] NULL,
[OriginAirportSeqID] [int] NULL,
[OriginCityMarketID] [int] NULL,
[OriginCountry] [varchar](3) NULL,
[OriginStateFips] [smallint] NULL,
[OriginState] [varchar](3) NULL,
[OriginStateName] [varchar](50) NULL,
[OriginWac] [smallint] NULL,
[RPCarrier] [varchar](3) NULL,
[Passengers] [real] NULL,
[Distance] [real] NULL,
[DistanceGroup] [smallint] NULL,
[ItinGeoType] [smallint] NULL,
[MktID] [bigint] NULL,
[SeqNum] [smallint] NULL,
[DestAirportID] [smallint] NULL,
[DestAirportSeqID] [int] NULL,
[DestCityMarketID] [int] NULL,
[Dest] [varchar](4) NULL,
[DestCountry] [varchar](3) NULL,
[DestStateFips] [smallint] NULL,
[DestState] [varchar](3) NULL,
[DestStateName] [varchar](50) NULL,
[DestWac] [smallint] NULL,
[Break] [varchar](1) NULL,
[CouponType] [varchar](1) NULL,
[TkCarrier] [varchar](3) NULL,
[OpCarrier] [varchar](3) NULL,
[FareClass] [varchar](1) NULL,
[Gateway] [bit] NULL,
[CouponGeoType] [smallint] NULL
)
ON [ps_ontime] ([Year])
Please sign in to use this experience.
Sign in