Lesson learned from an Availability Group performance case
Writer: Simon Su Technical Reviewer: Pam Lahoud , Sourabh Agarwal, Tejas Shah
Problem description
One of my customers implemented a very high workload synchronous AG (Availability Group) solution and he needs 10k transactions/sec in AG databases. With the in-memory technology, this 10K/sec goal was achieved but they found a very strange behavior in transaction processing of SQL Server. During stress testing about every 5~10 minutes the transactions/sec counter (actually it is “SQL Server 2016 XTP Transactions:Transactions Created/sec” counter) could drop to zero suddenly and quickly resume to normal within a second or tens of micro-seconds. Normally you will not observe this interesting thing because the duration of the dip is so short. My customer’s transaction is very time-sensitive so he has his own transaction/sec calculation formula and he found this short sharp drop in his monitor log. If we observe the “SQL Server 2016 XTP Transactions:Transactions Created/sec ” in his captured performance monitor log from primary replica, it looks like below: ![]()
I highlight the sharp drop with red circle in above chart. If we export the performance monitor log to text file, the “Transaction Created/sec” counter has below values: ![]()
You can see that the counter suddenly dropped to 33 at 37:53.4 as highlighted above. I do not think this drop is serious since SQL server keeps the same high transaction processing speed from next second. However, my customer is curious to this little dip and he want to find out the root cause of it.
How to troubleshoot AG performance delay?
For AG performance troubleshooting, we have two very good public articles: https://blogs.msdn.microsoft.com/saponsqlserver/2013/04/21/sql-server-2012-alwayson-part-11-performance-aspects-and-performance-monitoring-i/
If you are not familiar with AG performance troubleshooting concepts and steps please read above two articles first. Let us look at the two key performance counters to check the transaction delay in my customer’s synchronous-commit mode replicas:
- SQL Server:Database Replica –> Transaction Delay
- SQL Server:Database Replica –> Mirrored Write Transactions/sec
In performance monitor, these two counters look like below: ![]()
The “Transaction Delay” value is an accumulation of the delay of all the current transaction delay in millisecond. You can see that the “Transaction Delay” counter has the same spikes as the sudden drop of the “Transactions Created/ Sec”. Its spikes indicate that at those time points the AG transactions have time delay during commits. This gives us a very good start point. We can focus on the transaction delay in our AG performance troubleshooting.
So who causes the transaction delay? Is it primary replica, secondary replica, or other factors like network traffic?
As a must go-through step for performance troubleshooting we captured performance monitor logs to check how the performance behaved on both replicas. We want to find out whether there is any performance bottleneck existing in primary or secondary. For example, whether CPU usage is high when transaction delay spike happens, whether disk queue length is long, disk latency is large, etc. We expect to find something that has the same spike trend as the “Transaction Created/ sec” or “Transaction Delay”. Unfortunately, we do not anything interesting. CPU usage is as low 30%, Disk speed is quite fast. No disk queue length at all. We then checked AG related counters, like the log send queue and the recovery queue as the above two links mentioned but again we do not find anything helpful. We have below conclusions according to the performance monitor log:
--There is no overall CPU performance bottleneck
--There is no disk performance bottleneck, especially no disk issue on second replica.
--There is no network traffic issue.
In short, the performance monitor log does not tell us much why the transaction delay is happening.
Who introduces the transaction delay?
To investigate the details of the AG transaction performance, we need to study the performance of data movement between the two synchronous replicas. I wrote another article discussing the detailed steps to troubleshoot log block movement latency:
Troubleshooting data movement latency between synchronous-commit AlwaysOn Availability Groups https://blogs.msdn.microsoft.com/psssql/2018/04/05/troubleshooting-data-movement-latency-between-synchronous-commit-always-on-availability-groups/
I use similar script as above article to capture Xevent traces on both replicas. From the xevent logs we find out that the transaction latency is not caused by below factors:
<>Network transfer
<>Local log harden
<>Remote Log harden
The latency is happening on the primary replica after the primary receives the LSN harden message from remote node. This is a big milestone because it gives us clear direction where to investigate further. We should focus on the primary to know why it cannot commit the transaction in time. Below is the figure to tell you where comes the delay:
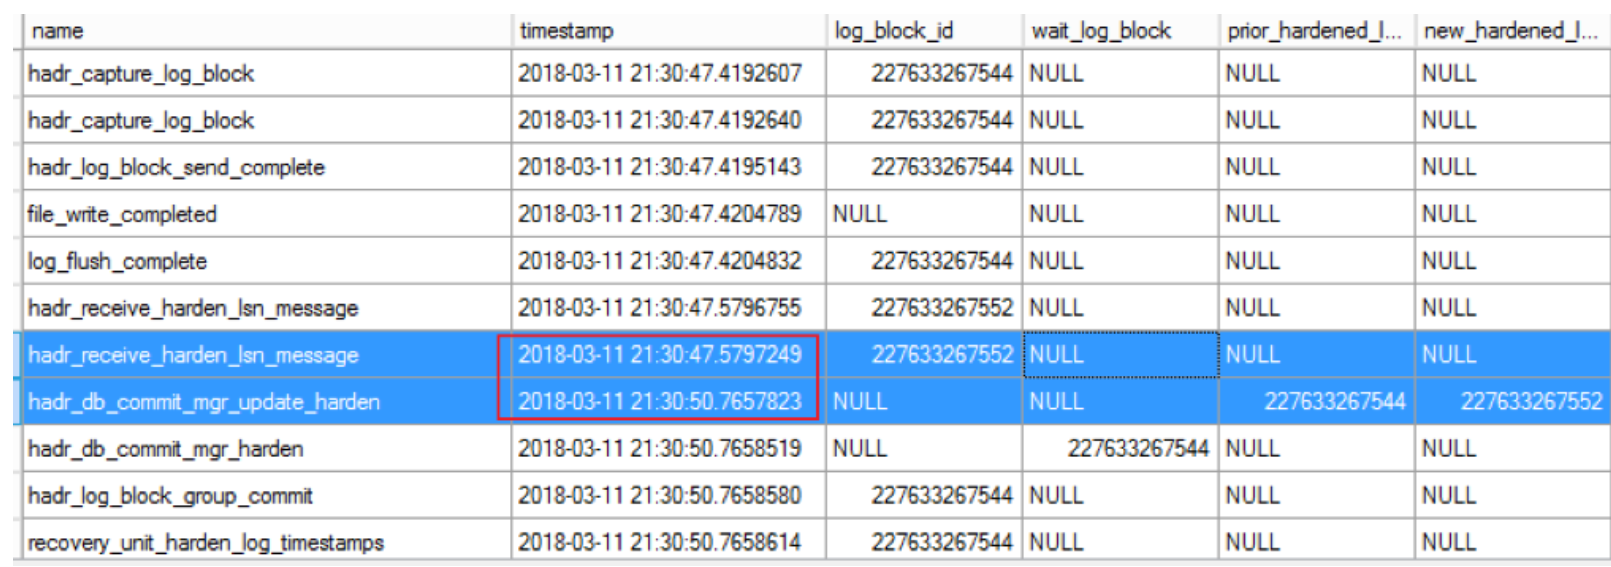
From above xevent log we can see the delay (about 3.2 seconds gap) occurs mainly between xevents of hadr_receive_harden_lsn_message and hadr_db_commit_mgr_update_harden, i.e. between step 13 and step 14 in below figure: 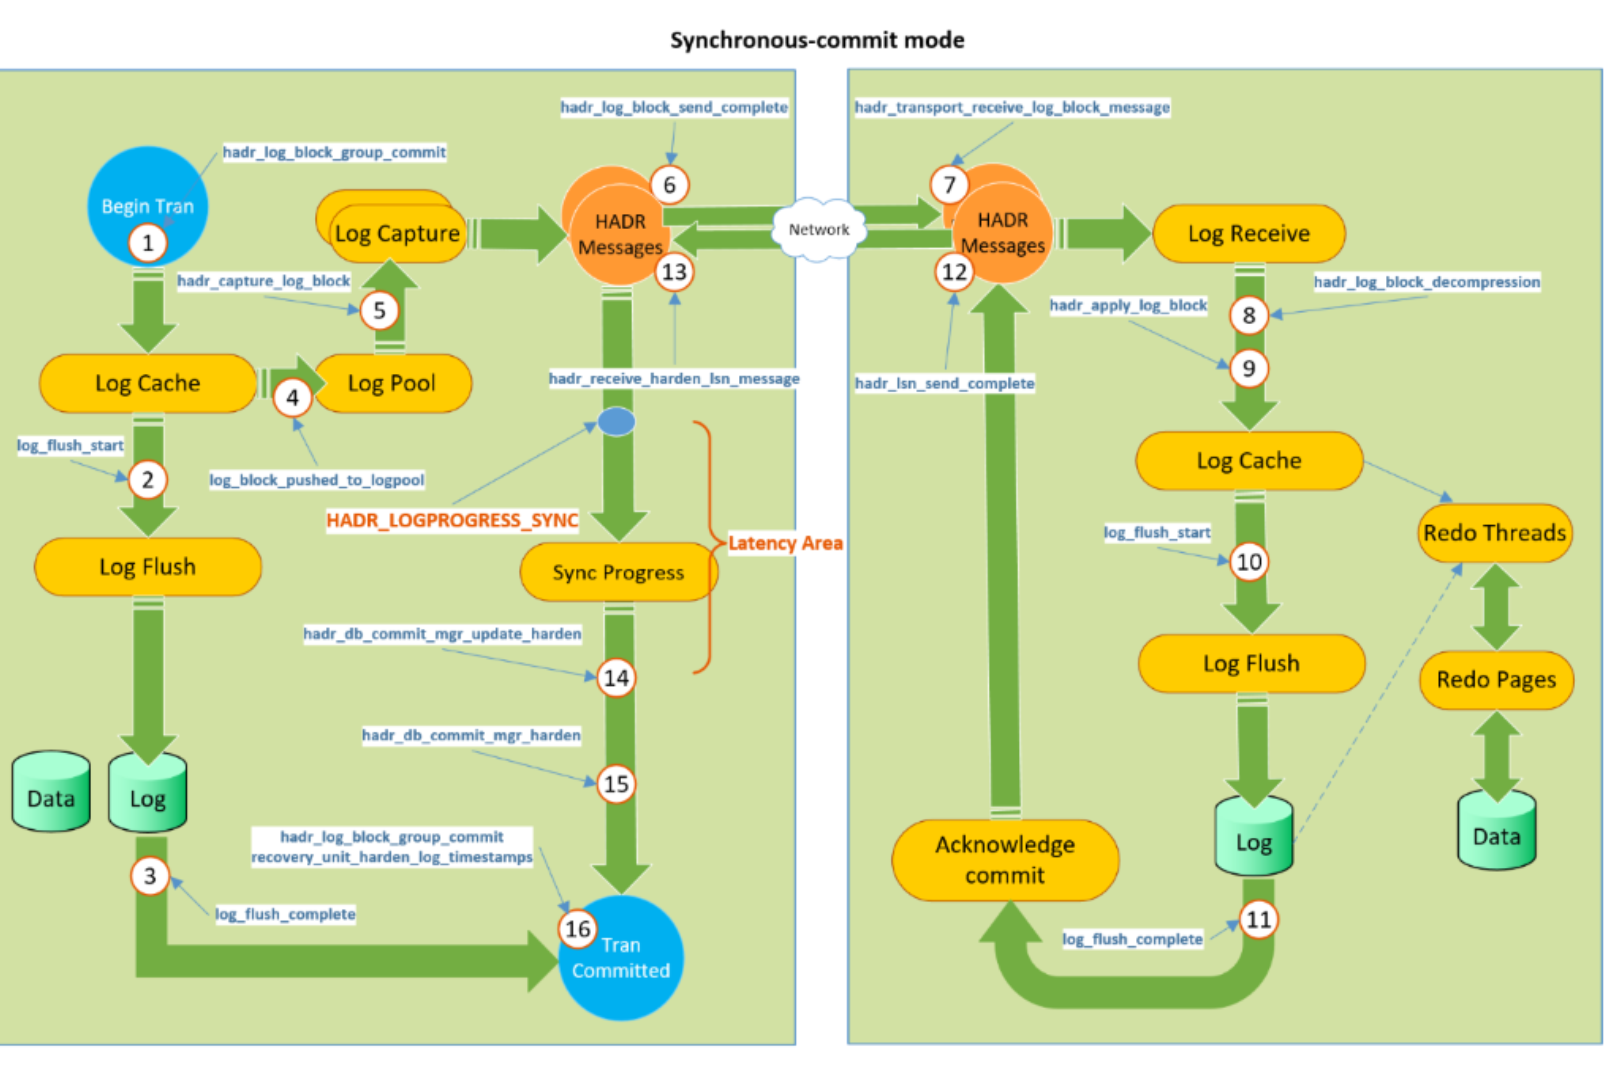
Normally once hadr_receive_harden_lsn_message arrives from remote replicas, SQL server will process the message and update LSN progress very quickly. Now we see it has delay to process the messages.
HADR_LOGPROGRESS_SYNC Wait
Now comes the challenge. How to troubleshoot this further, why step 13-14 produces the latency? To get the answer of this I use below script (wait.sql) to understand the request status for every second:
declare @i integer =0
WHILE(1=1)
BEGIN
set @i=@i+1
RAISERROR ('-- sys.dm_exec_requests --', 0, 1) WITH NOWAIT
SELECT GETDATE() 'runtime', * from sys.dm_exec_requests where session_id >50
RAISERROR ('-- sys.dm_os_waiting_tasks --', 0, 1) WITH NOWAIT
SELECT getdate() 'runtime',* from sys.dm_os_waiting_tasks WHERE session_id >50
--Please don’t use so small value in production, it will eat up one core’s usage.
WAITFOR DELAY '00:00:01.000';
END
GO
I am lucky that from the script output I have a big finding. Whenever the transaction sharp drop occurs there are always HADR_LOGPROGRESS_SYNC waits happening there as well: 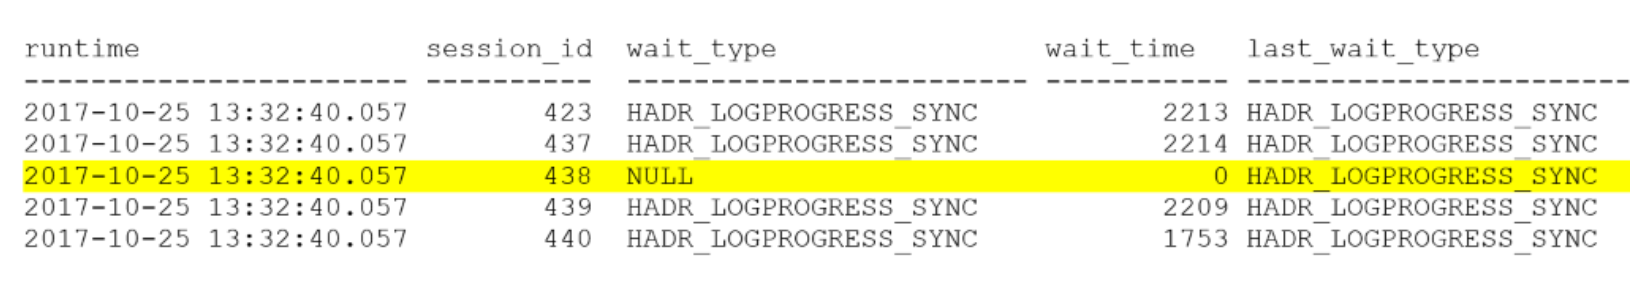
HADR_LOGPROGRESS_SYNC wait is “Concurrency control wait when updating the log progress status of database replicas”. To update log progress for an AG database, like the latest harden LSN from remote replica etc, a thread has to acquire the HADR_LOGPROGRESS_SYNC lock first. For any given point in time, only one thread can hold this lock, and when this lock is held by someone other threads who want to update the log progress have to wait until the lock release. One example is that thread A holds this lock to update the latest harden LSN is 1:20:40, after thread A finishes, it releases the lock, and then thread B holds this lock and update remote harden LSN to 1:20:44. LSN progress update has to be serialized to make the log consistent.
Besides HADR_LOGPROGRESS_SYNC waits in the output, there are also lots of HADR_SYNC_COMMIT occurring. This is expected because we know that there is latency happening at that time (see the transaction delay spike at the beginning of this article). Here is the screenshot of the HADR_SYNC_COMMIT threads: 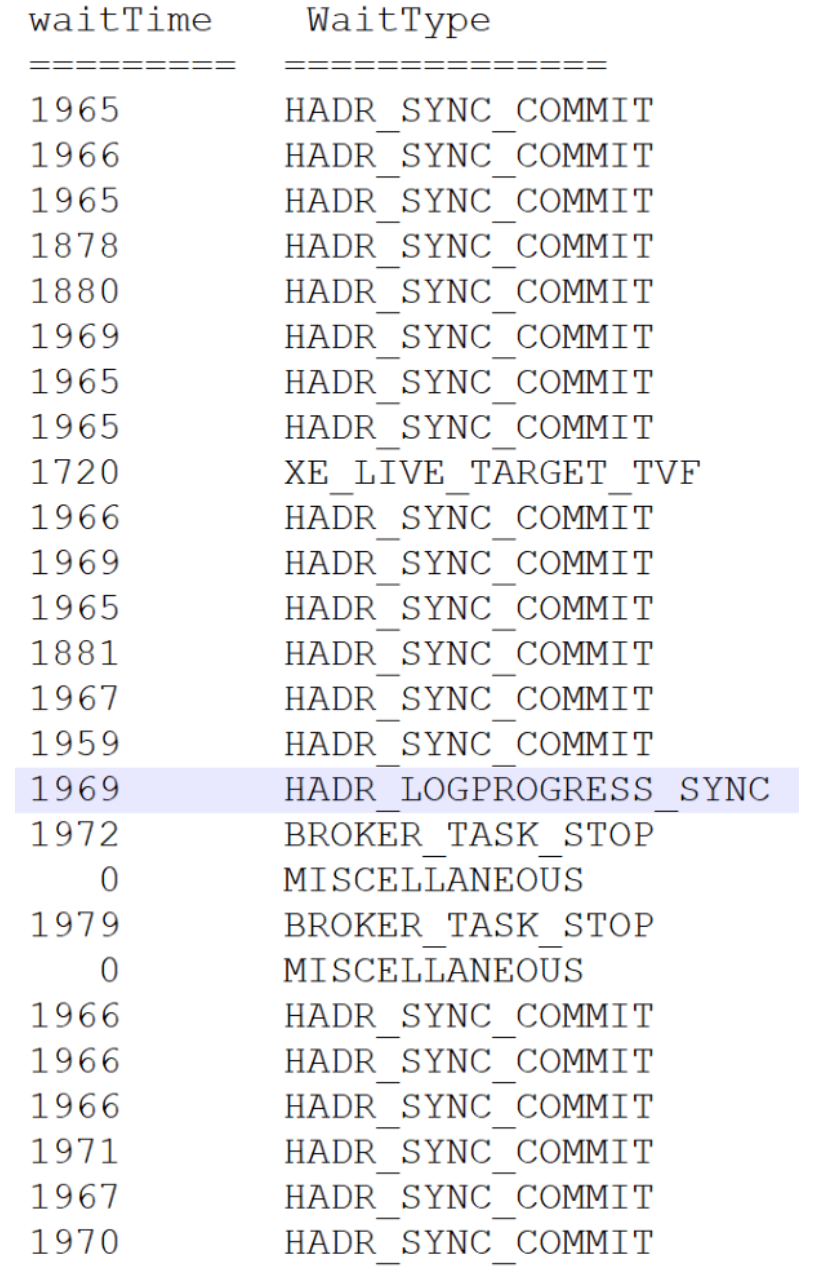
What are the relationship between HADR_LOGPROGRESS_SYNC wait and HADR_SYNC_COMMIT wait? It takes me sometime to understand that for synchronous replica, log block could contain several log records from different transactions and these transactions are grouped to commit to replica, this is the behavior of what is called “Group Commit” in Availability Groups. When the log block is hardened on remote replica, it will send the harden LSN to primary (we call this sync progress messages). The primary receives the harden LSN and then will acquire HADR_LOGPROGRESS_SYNC lock to update the latest harden LSN to the primary database. All those transactions waiting on HADR_SYNC_COMMIT will be signaled that the remote commit is done if their expected harden LSN is less that the latest harden LSN from remote replica. When local commit and remote commit are both done then the user transaction is called “committed”. Note that we are talking synchronous-commit mode replicas here. If the thread cannot acquire HADR_LOGPROGRESS_SYNC lock to update the latest LSN then there could be lots of threads being in HADR_SYNC_COMMIT wait because they are not able to get signal from the log progress update thread.
Now comes to the million dollars question. Why is there long HADR_LOGPROGRESS_SYNC wait happening? In other words, who owns the HADR_LOGPROGRESS_SYNC lock for that long time? From the HADR_LOGPROGRESS_SYNC wait figure shown above, we see that SPID 438 has last_wait_type of HADR_LOGPROGRESS_SYNC, is it possible it is the owner of the HADR_LOGPROGRESS_SYNC lock? Later investigation actually confirms that SPID 438 is holding HADR_LOGPROGRESS_SYNC at that time. However why does it hold the lock so long?
Scheduler Yielding issue
We checked the output of wait.sql to see if we can get the answer why SPID 438 held the lock for more than 2 seconds. From the output I see SPID 438 status is “background” so I am not able to know whether it is “running” or in runnable queue. To figure out whether this thread is really running or runnable we can check the active worker thread of its scheduler. If the active worker thread of the scheduler is the same as this thread then we know this thread is on the scheduler running. I wrote below article to demonstrate how to troubleshoot thread scheduling and yielding:
Troubleshooting SQL Server Scheduling and Yielding https://blogs.msdn.microsoft.com/psssql/2018/04/05/troubleshooting-sql-server-scheduling-and-yielding/
I use the same technology to capture logs. The finding is simple. The HADR_LOGPROGRESS_SYNC thread was in runnable queue for about 100ms-1 second and therefore it cause lots of HADR_SYNC_COMMIT waits with the same waiting duration, and no doubt it then caused the transaction delay spike as you see in the beginning of this article. Here is the scheduler yield_count looks like: 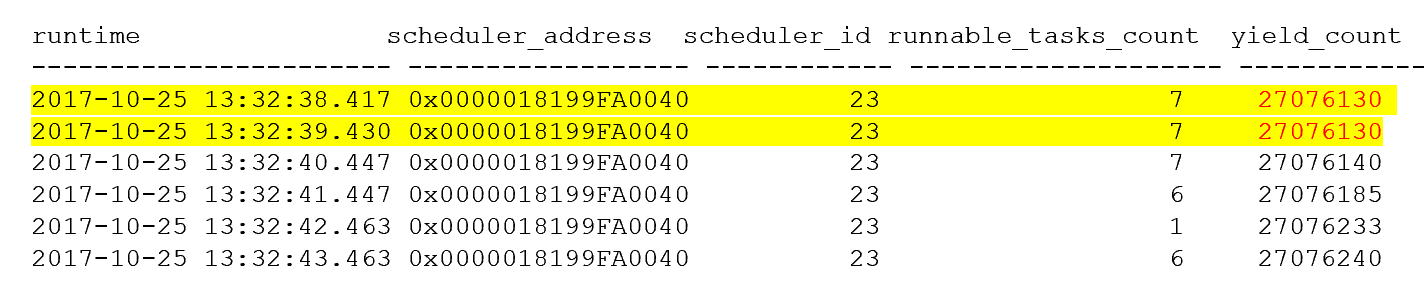
You can see that yield_count (27076130) of scheduler 23 does not change within 1 second which means someone is actively running on the scheduler without yielding to other threads. You also see runnable task is 7 which means there are 7 threads are waiting in runnable queue.
The wait_info xevent trace also confirms the HADR_LOGPROGRESS_SYNC thread is in runnable queue waiting for a while: 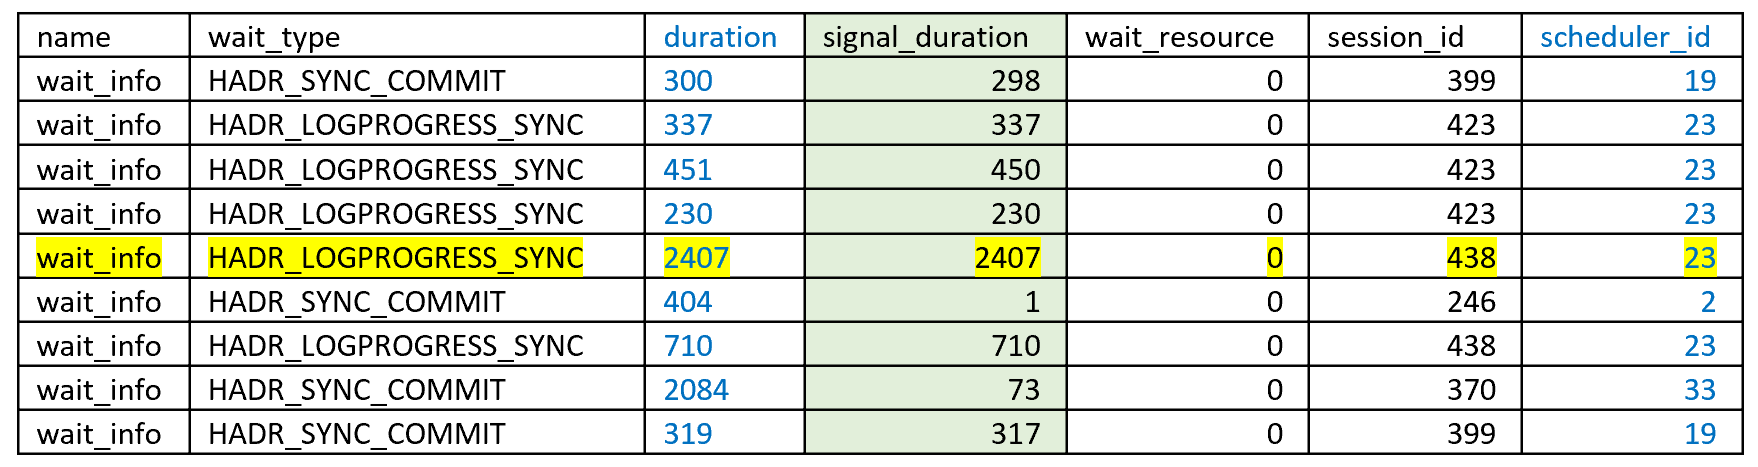
You see for SPID 438 the signal_duration (2407ms) is the same as duration column. This means it has been sitting in runnable queue for about 2407 ms.
Who is holding the scheduler without yielding
From above investigation we understand that the thread who owns the HADR_LOGPROGRESS_SYNC lock cannot get chance to run on scheduler in time and hence it causes transaction delay spike (i.e. sharp transaction rate drop). Using the technology described in the article “Troubleshooting SQL Server Scheduling and Yielding” we finally find out the “offending” thread is running a query which will access a big in-memory table. The memory table is big and its index is also very huge, and it often takes hundreds of microseconds to run. In case the worker thread who picks up the HADR_LOGPROGRESS_SYNC message to process is on the same scheduler then they have chance to competing for CPU resource at the same time. In this case, SQL Server is running the query without yielding for about one second, and then this one-second non-yielding scheduler time causes the HADR_LOGPROGRESS_SYNC thread to wait in runnable queue for one second. Because of this, all of the HADR_LOGPROGRESS_SYNC waiter need to wait for 1 second for the lock, which in turn block those threads in HADR_SYNC_COMMIT waits for one second accordingly.
The solution is simple. We involved product group to add yielding code when scanning the in-memory table and then the problem is fixed ( in SQL2016 SP1 CU7, see https://support.microsoft.com/en-us/help/4057280/high-cpu-usage-when-large-index-use-in-query-on-memory-optimized-table).