Troubleshooting data movement latency between synchronous-commit AlwaysOn Availability Groups
Writer: Simon Su
Technical Reviewer: Pam Lahoud, Sourabh Agarwal, Tejas Shah
Applies to: SQL Server 2014 SP2, SQL Server 2016 SP1, SQL Server 2017 RTM
In synchronous-commit mode AG nodes sometimes you may observe your transactions are pending on HADR_SYNC_COMMIT waits. HADR_SYNC_COMMIT waits indicate that SQL server is waiting for the signal from the remote replicas to commit the transaction. To understand the transaction commit latency you can refer to below articles:
Troubleshooting High HADR_SYNC_COMMIT wait type with AlwaysOn Availability Groups https://blogs.msdn.microsoft.com/sql_server_team/troubleshooting-high-hadr_sync_commit-wait-type-with-always-on-availability-groups/
SQL Server 2012 AlwaysOn – Part 12 – Performance Aspects and Performance Monitoring II https://blogs.msdn.microsoft.com/saponsqlserver/2013/04/24/sql-server-2012-alwayson-part-12-performance-aspects-and-performance-monitoring-ii/
In above link you will learn that the transaction delay can be evaluated by below two performance counters:
- SQL Server:Database Replica –> Transaction Delay
- SQL Server:Database Replica –> Mirrored Write Transactions/sec
For example, assume there are poor performing AG nodes and you see “SQL Server:Database Replica –> Transaction Delay” is 1000 ms (milliseconds), and “SQL Server:Database Replica –> Mirrored Write Transactions/sec” is 50, then it means on average each transaction has a delay of 1000ms/50=20 ms.
Given above example, can we know where the delay of 20 ms is from? What are the factors that cause this latency? To find out the answers of this kind of questions we need to understand how synchronous-commit works: https://blogs.msdn.microsoft.com/psssql/2011/04/01/alwayson-hadron-learning-series-how-does-alwayson-process-a-synchronous-commit-request/
To track the data movement between replicas we are lucky we have updated xevents: https://support.microsoft.com/en-us/help/3173156/update-adds-alwayson-extended-events-and-performance-counters-in-sql-s
In synchronous-commit mode the basic logic of the log blocks movement is as below:
In primary:
1.1 Log block->LogCache->LogFlush->LocalHarden(LDF) 1.2 Log block->logPool->LogCapture->SendToRemote
(1.1 and 1.2 happens in parallel )
In remote synchronous replica:
The harden process is similar as primary: logBlock receive->LogCache->LogFlush->HardenToLDF->AckPrimary
The xevents (see the first link in this article) happened in different places of log block movement. I have below figure to give you the detailed log movement flow of each steps and those related Xevents: 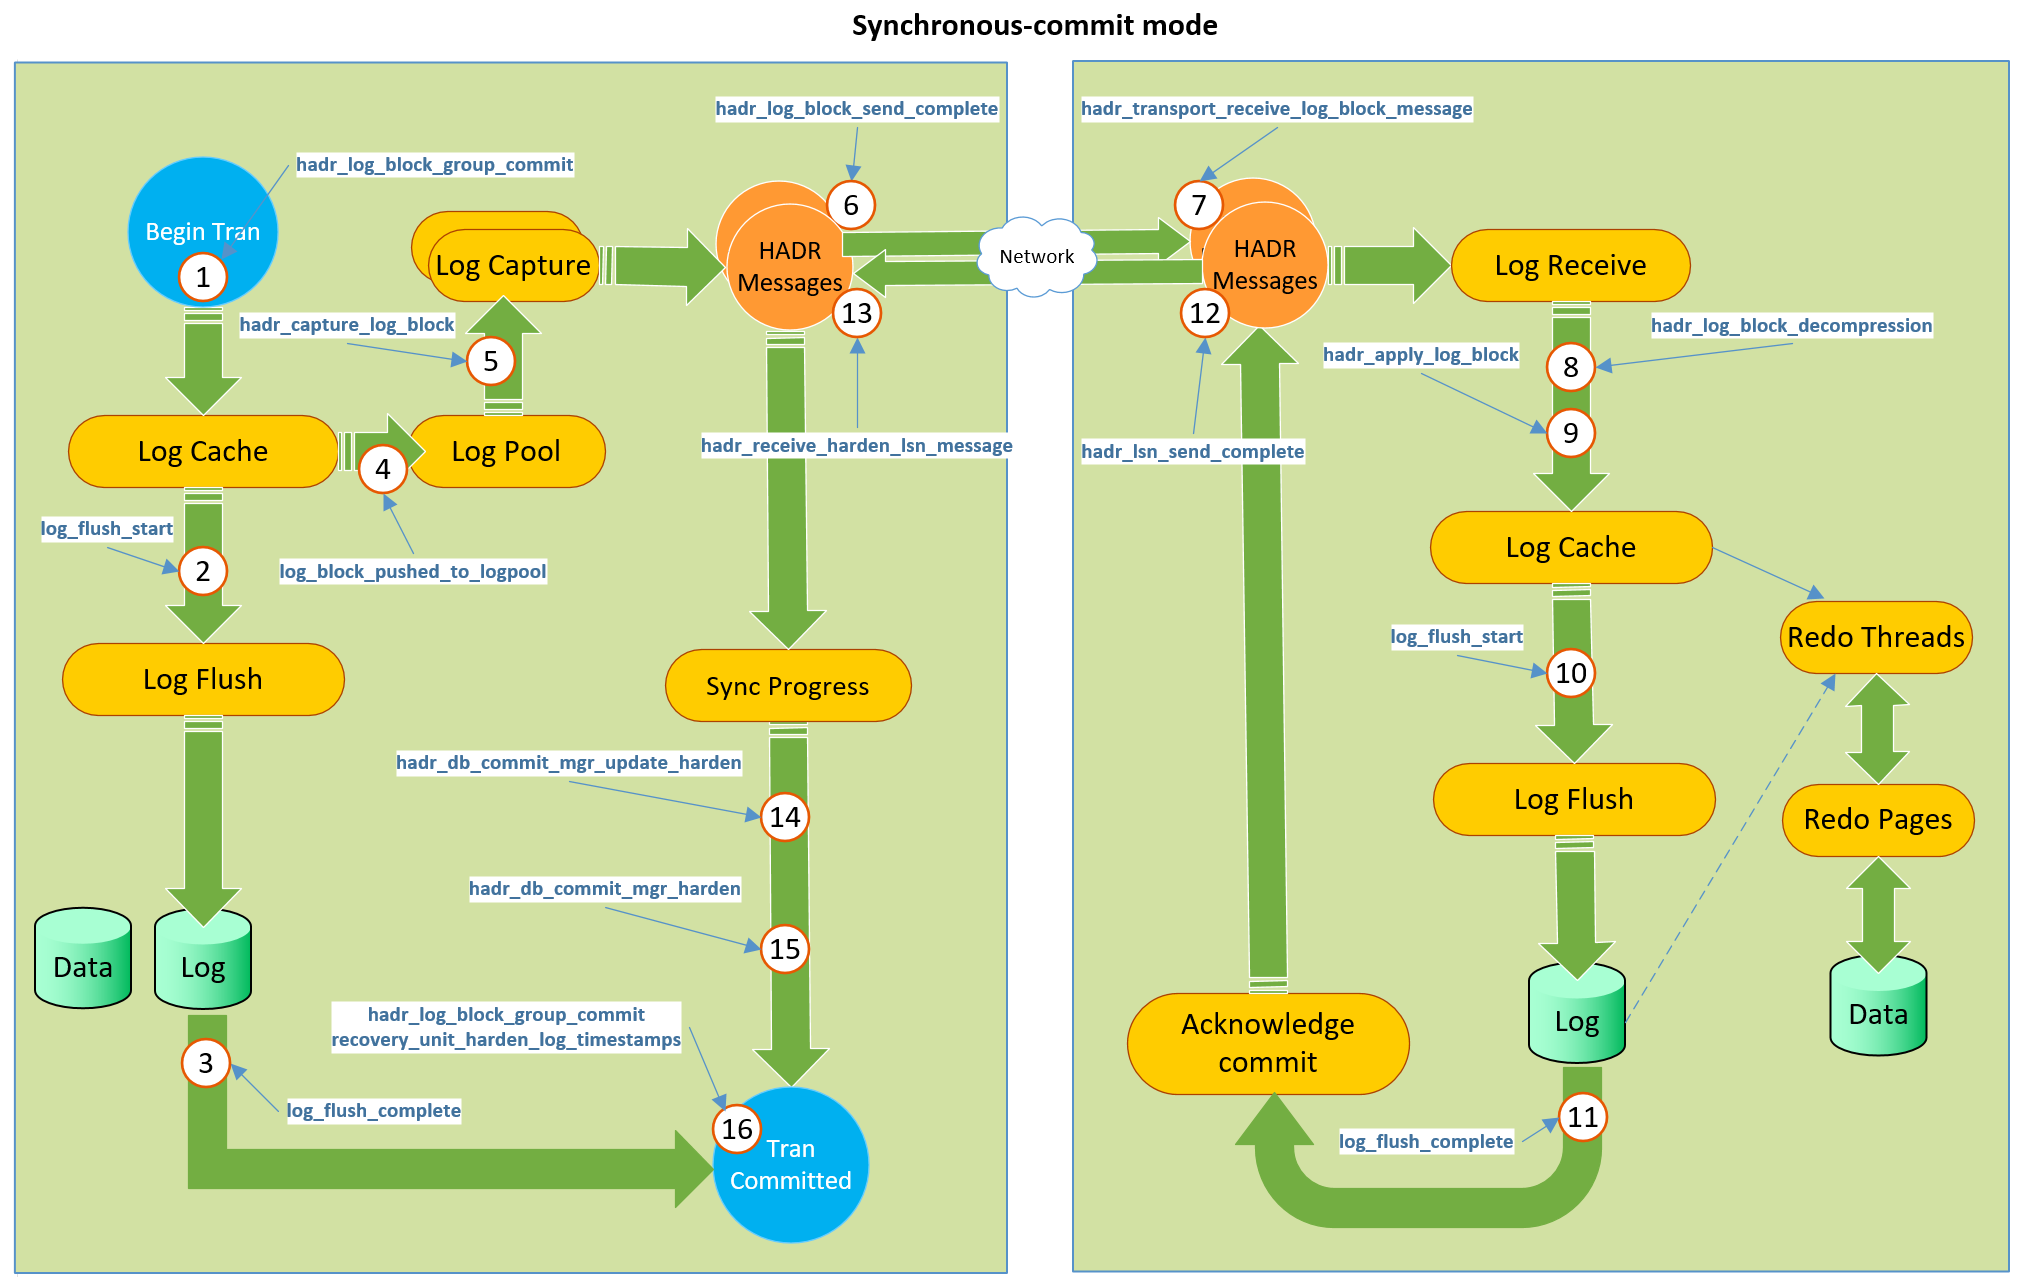
As showed above when the Xevent trace is captured we can know the precious time point of each step of the log block movement and you can know exactly where the transaction latency is from. Commonly the delay is from three parts:
1. The duration of log harden in primary
It equals to the time delta of Log_flush_start(step 2) and Log_flush_complete (step 3)
2. The duration of log harden in remote replica
It equals to the time delta of Log_flush_start (step 10) and Log_flush_complete (step 11)
3. The duration of network traffic
The sum of time deltas of (primary:hadr_log_block_send_complete ->secondary:hadr_transport_receive_log_block_message, step 6-7) and (secondary:hadr_lsn_send_complete->primary:hadr_receive_harden_lsn_message,step 12-13)
I use below script to capture xevents:
/* Note: this trace could generate very large amount of data very quickly, depends on the actual transaction rate. On a busy server it can grow several GB per minute, so do not run the script too long to avoid the impact to the production server. */
CREATE EVENT SESSION [AlwaysOn_Data_Movement_Tracing] ON SERVER ADD EVENT sqlserver.file_write_completed, ADD EVENT sqlserver.file_write_enqueued, ADD EVENT sqlserver.hadr_apply_log_block, ADD EVENT sqlserver.hadr_apply_vlfheader, ADD EVENT sqlserver.hadr_capture_compressed_log_cache, ADD EVENT sqlserver.hadr_capture_filestream_wait, ADD EVENT sqlserver.hadr_capture_log_block, ADD EVENT sqlserver.hadr_capture_vlfheader, ADD EVENT sqlserver.hadr_db_commit_mgr_harden, ADD EVENT sqlserver.hadr_db_commit_mgr_harden_still_waiting, ADD EVENT sqlserver.hadr_db_commit_mgr_update_harden, ADD EVENT sqlserver.hadr_filestream_processed_block, ADD EVENT sqlserver.hadr_log_block_compression, ADD EVENT sqlserver.hadr_log_block_decompression, ADD EVENT sqlserver.hadr_log_block_group_commit , ADD EVENT sqlserver.hadr_log_block_send_complete, ADD EVENT sqlserver.hadr_lsn_send_complete, ADD EVENT sqlserver.hadr_receive_harden_lsn_message, ADD EVENT sqlserver.hadr_send_harden_lsn_message, ADD EVENT sqlserver.hadr_transport_flow_control_action, ADD EVENT sqlserver.hadr_transport_receive_log_block_message, ADD EVENT sqlserver.log_block_pushed_to_logpool, ADD EVENT sqlserver.log_flush_complete , ADD EVENT sqlserver.log_flush_start, ADD EVENT sqlserver.recovery_unit_harden_log_timestamps ADD TARGET package0.event_file(SET filename=N'c:\mslog\AlwaysOn_Data_Movement_Tracing.xel',max_file_size=(500),max_rollover_files=(4)) WITH (MAX_MEMORY=4096 KB,EVENT_RETENTION_MODE=ALLOW_SINGLE_EVENT_LOSS,MAX_DISPATCH_LATENCY=30 SECONDS,MAX_EVENT_SIZE=0 KB,MEMORY_PARTITION_MODE=NONE,TRACK_CAUSALITY=OFF,STARTUP_STATE=ON)
GO
For demo purpose I just run “insert into [AdventureWorks2014]..t1 values(1)” and then capture the xevent trace on primary and secondary, and below are the screenshot of the captured xevents:
Primary: 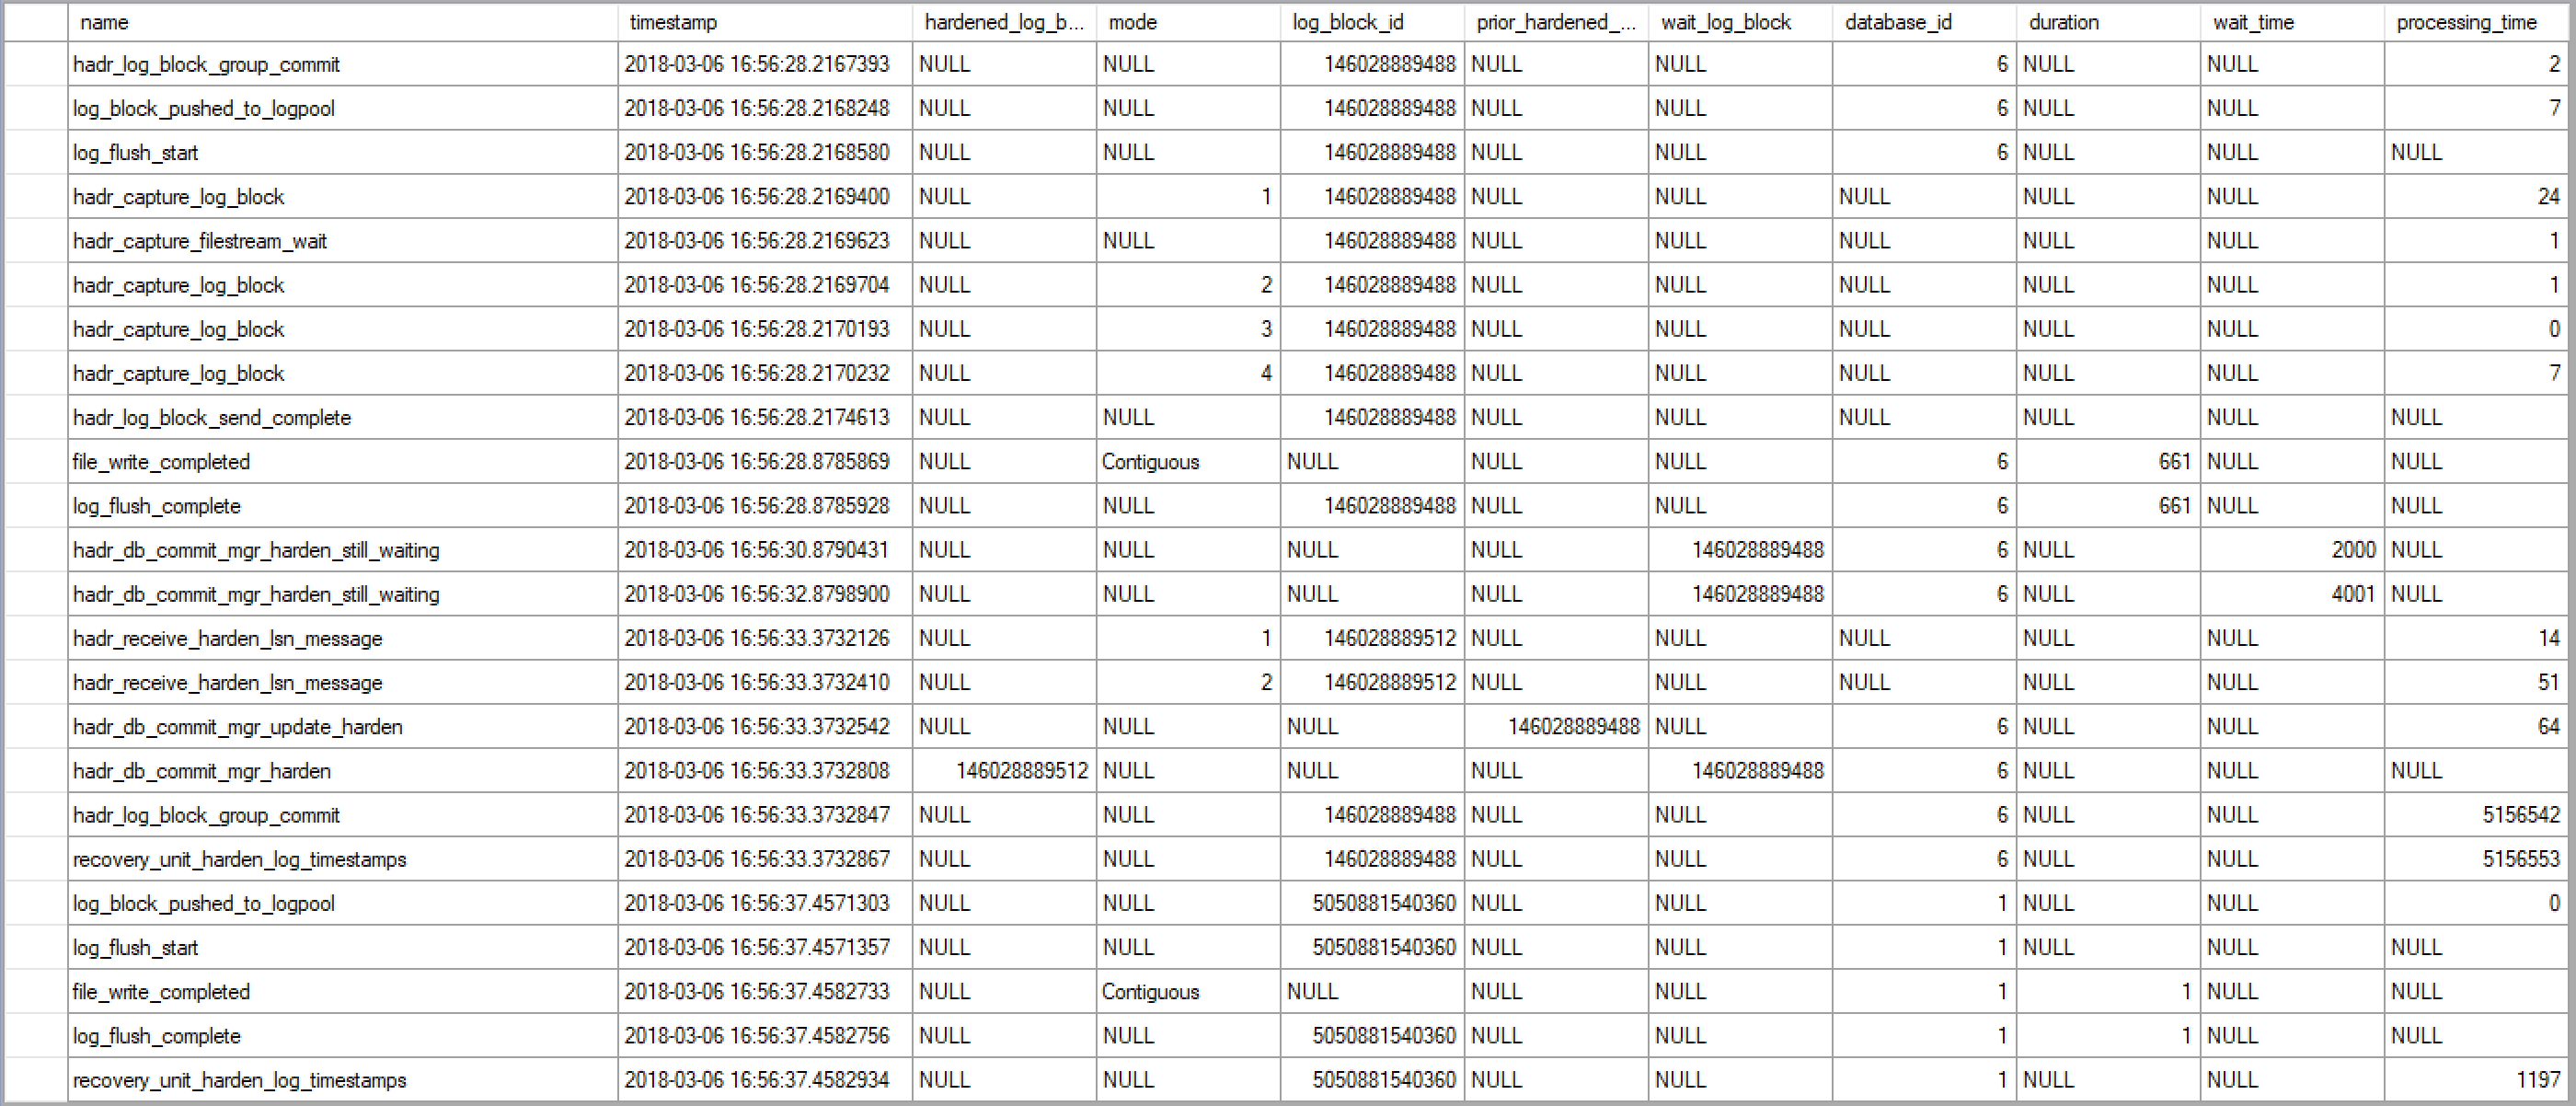
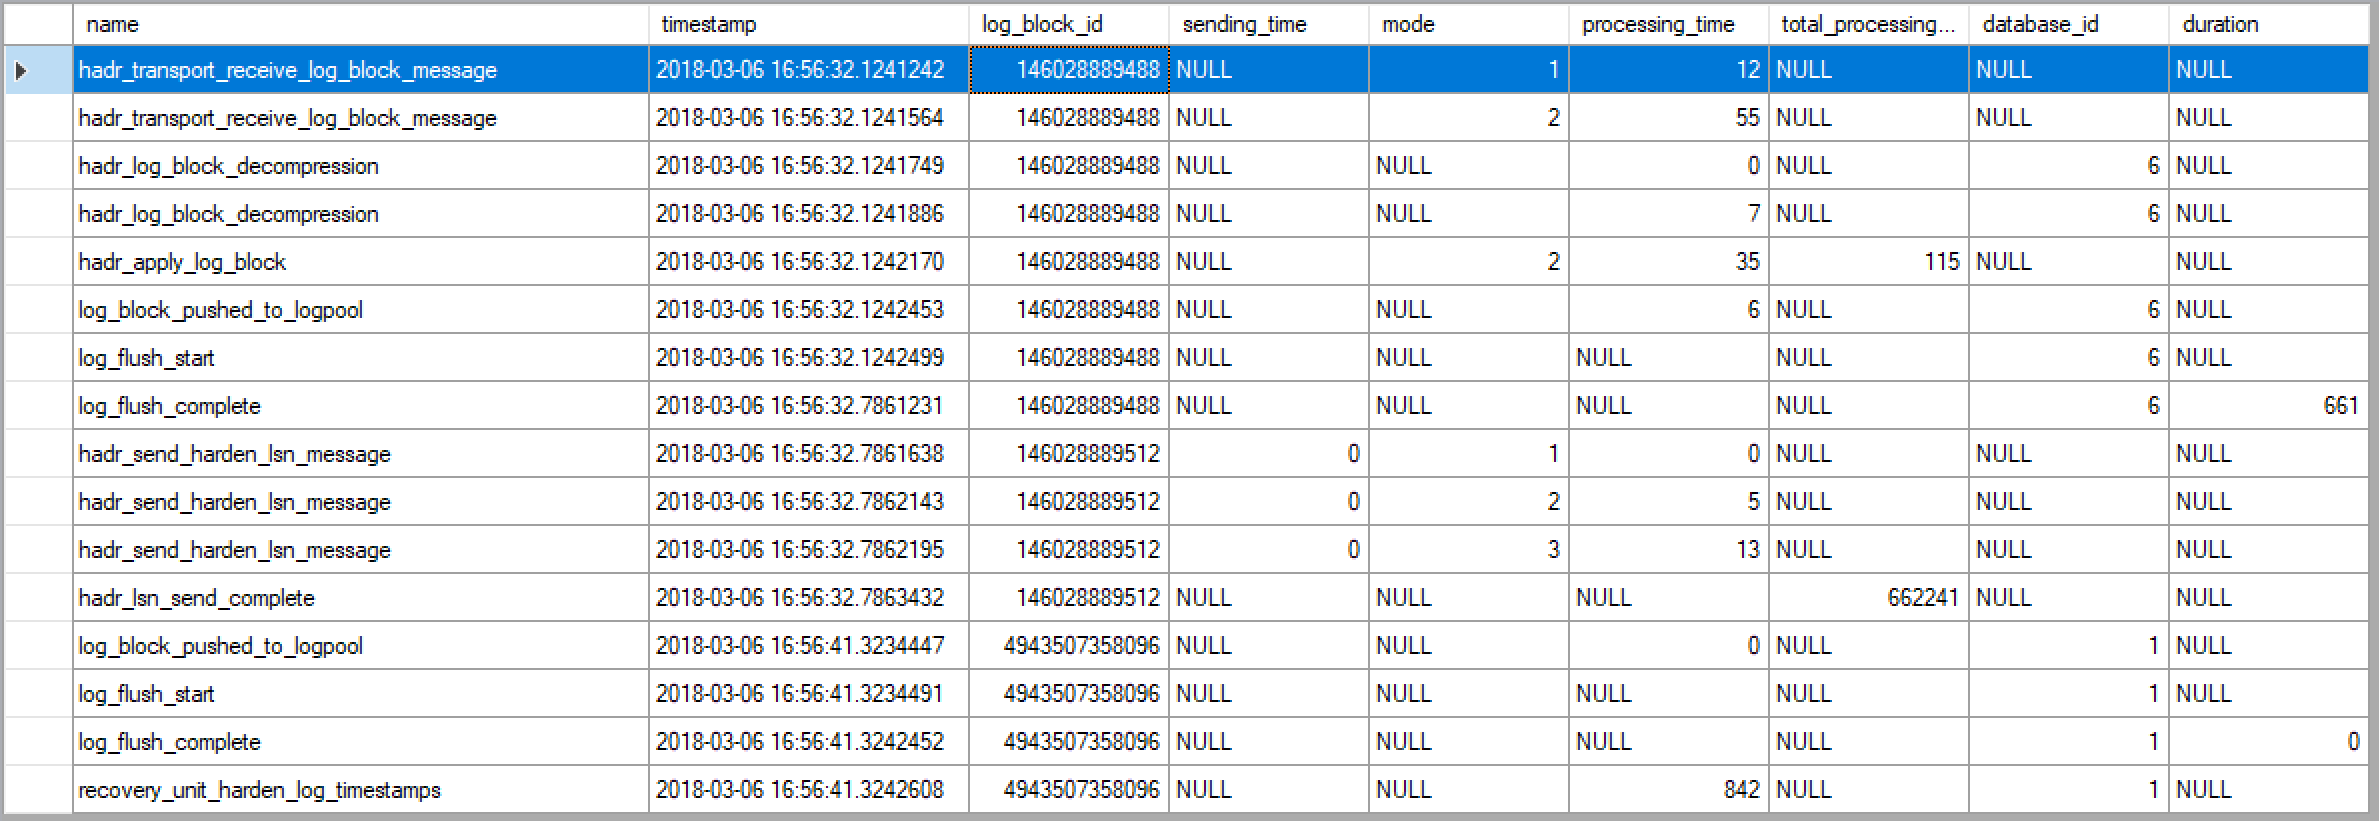
In second synchronous replica:
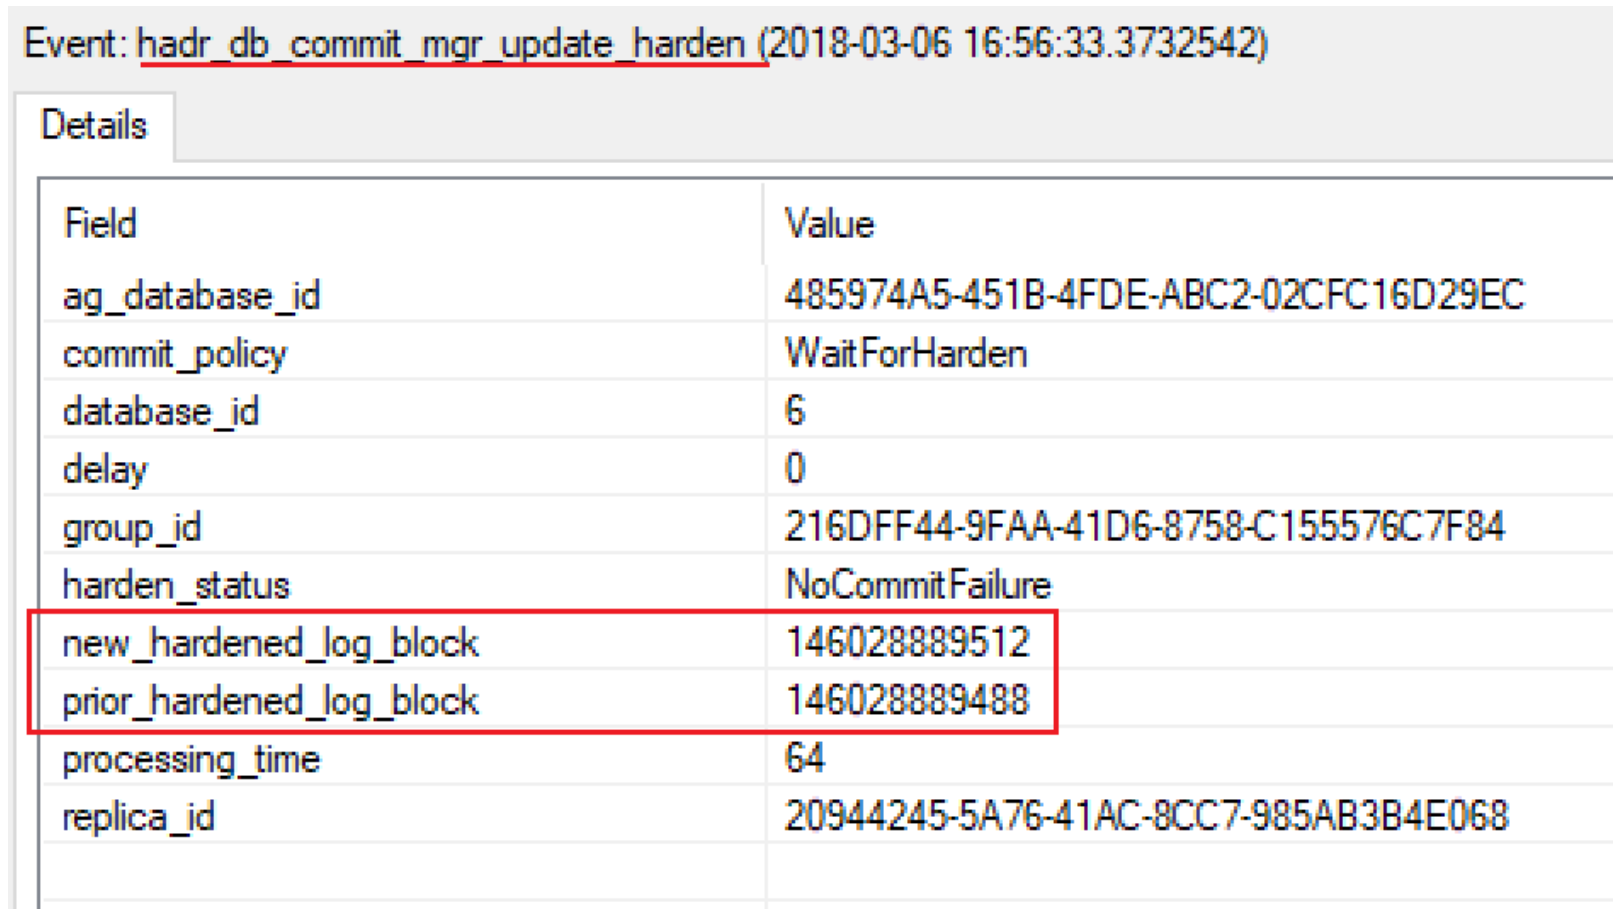
Note: You may notice that the log_block_id (146028889512) of hadr_receive_harden_lsn_message is not the same as others (146028889488). This is because the return id is always the next immediate id of the harden log block, we can use hadr_db_commit_mgr_update_harden xevent to correlate the xevents:
With above xevent log we now get below detailed time latency breakdowns of the transaction commit:
| From | To | latency | |
| Network: Primary->Second | Primary: hadr_log_block_send_complete 2018-03-06 16:56:28.2174613 | Secondary: hadr_transport_receive_log_block_message 2018-03-06 16:56:32.1241242 | 3.907 seconds |
| Network: Secondary->Primary | Secondary:hadr_lsn_send_complete 2018-03-06 16:56:32.7863432 | Primary:hadr_receive_harden_lsn_message 2018-03-06 16:56:33.3732126 | 0.587 seconds |
| LogHarden(Primary) | log_flush_start 2018-03-06 16:56:28.2168580 | log_flush_complete 2018-03-06 16:56:28.8785928 | 0.663 seconds |
| Log Harden(Secondary) | Log_flush_start 2018-03-06 16:56:32.1242499 | Log_flush_complete 2018-03-06 16:56:32.7861231 | 0.663 seconds |
I list the time delta (the latency) just for network and log harden process there, there could be other latency places happening as well, like log block compressing/decompressing etc, but mainly the latency comes from these three parts:
- Network latency between replicas. In above example, it is 3.907+0.587=4.494 seconds
- Log harden on Primary=0.663 seconds
- Log harden on Secondary=0.663 seconds
To get the total transaction delay, we cannot simply sum them up because Log flush on primary and the network transfer are happening in parallel. Say, the network takes 4.494 seconds, but primary log harden finished (log_flush_complete:2018-03-06 16:56:28.8785928) far before the primary gets confirmation from replica (hadr_receive_harden_lsn_message:2018-03-06 16:56:33.3732126). Luckily, we do not need to manually determine which timestamp to use to calculate the total commit time of a transaction. We can use the time delta between the two hadr_log_block_group_commit xevents to know the time to commit. For example, in above log:
Primary: hadr_log_block_group_commit: 2018-03-06 16:56:28.2167393
Primary: hadr_log_block_group_commit: 2018-03-06 16:56:33.3732847
Total time to commit=delta of above two timestamps= 5.157 seconds
This number is equal to the network transfer time plus the log harden time on the secondary. This makes sense because the secondary has to wait for the network for the log block available before log harden, it cannot harden the log in parallel like in the primary.
If you look at the second hadr_log_block_group_commit event it has a column of “processing_time” which is the exactly the commit time of the transaction that we are talking about: 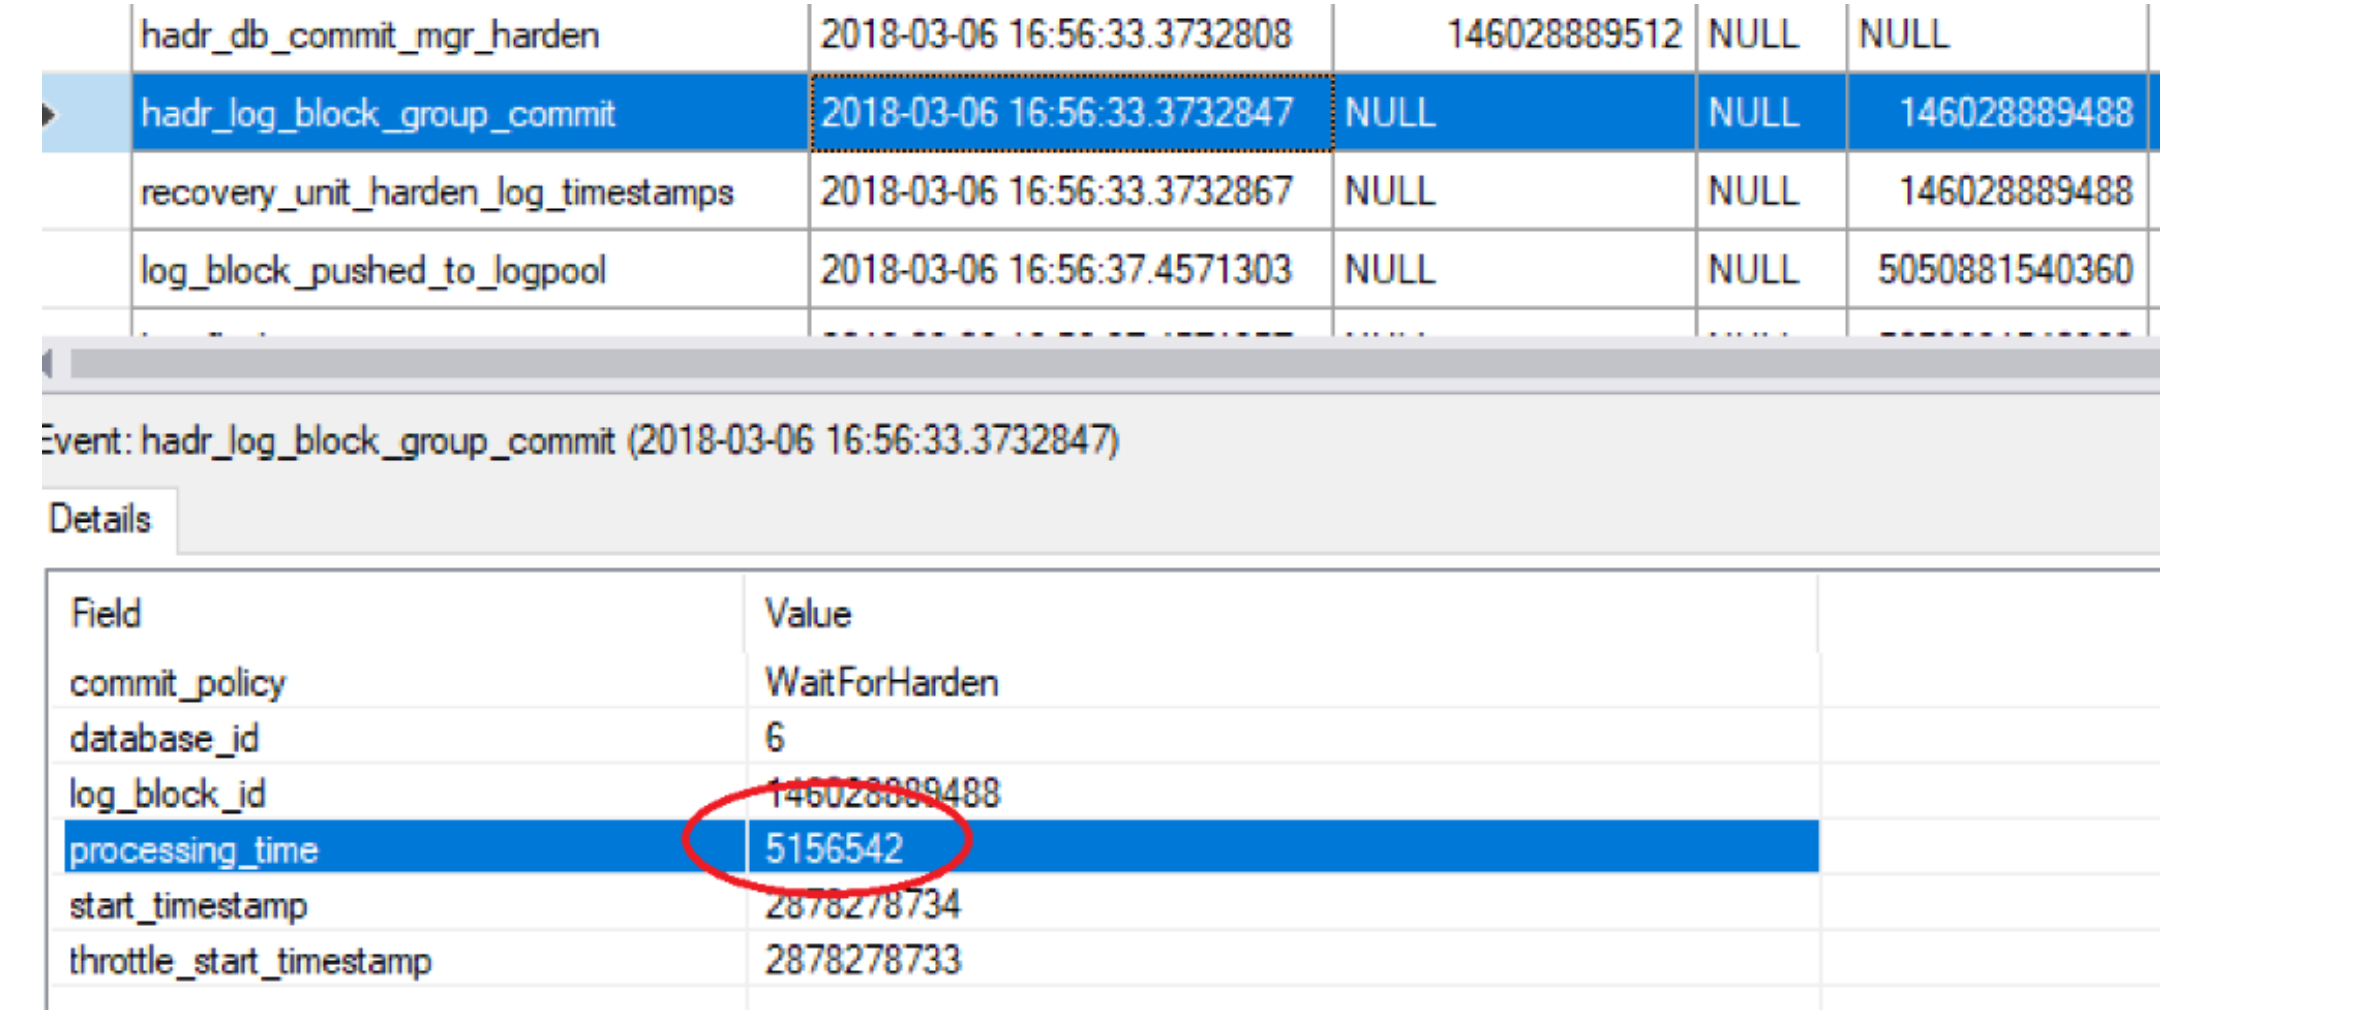
So now you have an overall picture about the log block movement between synchronous-commit mode replicas, and you know where is the latency (if any) from, replicas, network, or disk (log harden) or others.
By the way, you may notice that there is “hadr_db_commit_mgr_harden_still_waiting” xevent happening in primary Xevents. This event happens every 2 seconds (the 2 seconds is hardcoded) when the primary is waiting for the acknowledge message from second replica. If the ack comes back within 2 seconds you won’t see this xevent.
2018.9.8 update
=================
I have developed a tool to analyze the trace automatically:
https://blogs.msdn.microsoft.com/psssql/2018/09/08/aglatency-report-tool-introduction/
Reference
New in SSMS – Always On Availability Group Latency Reports https://blogs.msdn.microsoft.com/sql\_server\_team/new-in-ssms-always-on-availability-group-latency-reports/
AlwaysOn Availability Groups Troubleshooting and Monitoring Guide https://msdn.microsoft.com/library/dn135328