How to monitor and alert potential Disk and VM Level IO Throttling on Linux VMs using ARM
Introduction
This blog post will present a step-by-step guide to enable disk performance monitoring on Linux VMs running on Azure using the Linux Diagnostics Extension 3.0 (LAD3). This article is a continuation of a previous post regarding the monitoring of potential Disk and VM level throttling on Windows VM. For a full introduction on what is Throttling and what is the difference between Disk Level and VM Level throttling, please visit this page.
This guideline is applicable to all Azure VMs deployed with Azure Resource Manager running with any supported Linux Distro.
Test VM Configuration
Azure settings
For the guideline presented in this article, we will use a sample VM configured as follows:
VM Name: "MonitorUbuntuVM"
VM size: DS2_v2
Operating System : Ubuntu Linux 16.04 LTS
Disk Layout:
- OS disk type : Premium P10.
- Attached 4 data disks to VM:
- 2x Premium P10 (128 GB - Disk limits: 500 IOPS or 100 MB/s - Disk Cache Setting: None)
- 1x Premium P20 (512 GB - Disk limits: 2300 IOPS or 150 MB/s - Disk Cache Setting: None)
- 1x Premium P30 (1024 GB - Disk limits: 5000 IOPS or 200 MB/s - Disk Cache Setting: None)
Guest OS settings
The OS disk (sda) has 1 partition mounted on '/'.
The temporary storage disk (sdb) has 1 partition mounted on '/mnt'.
The P30 disk (sdc) has 1 partition formatted with ext4 and mounted on '/p30'.
The P20 disk (sde) has 1 partition formatted with ext4 and mounted on '/p20'.
The 2 P10 disks (sdd + sdf) have been configured in a RAID 0 array with mdadm, and mounted on '/p10_RAID'.
The below lsblk output will show the disk layout in details:
 # lsblk
NAME      MAJ:MIN RM   SIZE RO TYPE  MOUNTPOINT
fd0         2:0    1     4K  0 disk
sda         8:0    0    30G  0 disk
└─sda1      8:1    0    30G  0 part  /
sdb         8:16   0    14G  0 disk
└─sdb1      8:17   0    14G  0 part  /mnt
sdc         8:32   0  1023G  0 disk
└─sdc1      8:33   0  1023G  0 part  /p30
sdd         8:48   0   127G  0 disk
└─sdd1      8:49   0   127G  0 part
  └─md127   9:127  0 253.9G  0 raid0 /p10_RAID
sde         8:64   0   511G  0 disk
└─sde1      8:65   0   511G  0 part  /p20
sdf         8:80   0   127G  0 disk
└─sdf1      8:81   0   127G  0 part
  └─md127   9:127  0 253.9G  0 raid0 /p10_RAID
Note: starting with MS Azure Linux Agent 2.2.4, the OS disk and the temporary storage storage disk will always be associated to sda and sdb devices.
Disk Performance target
Basing on Premium Storage Disk limit documentation, each mountpoint performance target can be summarized as follows:
| Mount point | Max IOPS | Max MBps |
| / | 500 | 100 |
| /p30 | 5000 | 200 |
| /p20 | 2300 | 150 |
| /p10_RAID | 2x 500 = 1000 | 2x 100 = 200 |
VM Performance Target
It is important to identify any storage limitations imposed by the VM size In this scenario, the disk caching is disabled on all the attached disks (None), so we need to look up the uncached disk throughput limit of the VM (IOPS / MBps) at column "Max uncached disk throughput: IOPS/MBps" as following:
/en-us/azure/virtual-machines/linux/sizes-general#dsv2-series 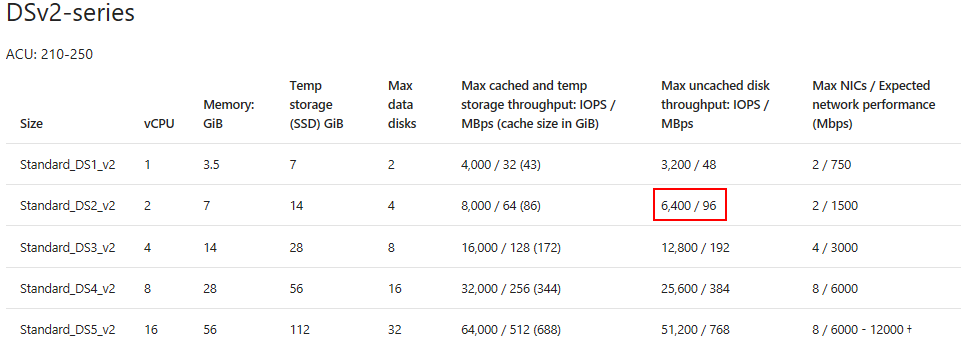
The test VM Disk Limits are then set to 6400 IOPS / 96 MBps.
How to measure Disk and VM Level Throttling using Metrics?
Azure VMs collects 2 types of metric data: host-level and guest-level.
Host metrics are measured directly at the physical host (node) where the VM is running and do not require any extension running inside the Guest VM. These metrics cannot be used to detect Disk Level Throttling. You can monitor Read and Write operations separately but not aggregated, therefore they cannot even be used for VM Level Throttling.
Guest Metrics are collected from within the Guest environment and they require the Diagnostics Extension to be installed and running in the VM. These metrics can help detecting both Disk and VM Level Throttling. Following section will describe how to install the Diagnostic Extension.
How to configure Linux Diagnostic Extension to collect Guest Metrics?
Configuration of LAD3 extension for Linux VM is possible through command line option (Azure CLI or PowerShell) and Azure Portal.
Configuration Through Command Line
As described in the Extension documentation’s page you need to define the metrics configuration through a public configuration file.
Reflecting how Linux manage the storage layout, we can choose between two categories of metrics: Disk Drive and Mount Points.
Disk Metrics
This category contains metrics for the individual Disk Drives presented to the VMs (sda, sdc, sdd, etc…). Useful Disk Metrics available under the Disk Class (built-in) are: TransfersPerSeconds (IOPS), BytesPerSeconds (Throughput), AverageTransferTime (latency) and AverageDiskQueueLength.
Note: current implementation of System Center XPlatform Provider for Operations Manager (SCXCore) prevents LAD3 from collecting metrics Disk Drives configured with RAID. To detect Disk Level Throttling we shall use Mount Points Metrics as described in next paragraph.
Warning: although the Disk class provides a _Total aggregated metric, because of the same behavior, this will not include RAID devices; therefore, we cannot use this value to detect VM Level Throttling.
Below json snippets define metric collection items within the “performanceCounterConfiguration” array in the configuration file, for disk sdc:
IOPS – Transfers Per Second
 {
  "unit": "CountPerSecond",
  "type": "builtin",
  "counter": "TransfersPerSecond",
  "counterSpecifier": "/builtin/Disk/TransfersPerSecond/sdc",
  "annotation": [
    {
      "locale": "en-us",
      "displayName": "sdc IOPS"
    }
  ],
  "condition": "Name=\"sdc\"",
  "class": "Disk"
}
Bps – Bytes per Second
 {
  "unit": "BytesPerSecond",
  "type": "builtin",
  "counter": "BytesPerSecond",
  "counterSpecifier": "/builtin/Disk/BytesPerSecond/sdc",
  "annotation": [
    {
      "locale": "en-us",
      "displayName": "sdc BPS"
    }
  ],
  "condition": "Name=\"sdc\"",
  "class": "Disk"
}
Monitoring IOPS and MBps is sufficient to detect Throttling, but to evaluate its intensity with accuracy it is necessary to refer to other metrics like Average Latency and Average Queue Lenght:
Average Latency
 {
  "unit": "Millisecond",
  "type": "builtin",
  "counter": "AverageTransferTime",
  "counterSpecifier": "/builtin/Disk/AverageTransferTime/sdc",
  "annotation": [
    {
      "locale": "en-us",
      "displayName": "sdc AvLat"
    }
  ],
  "condition": "Name=\"sdc\"",
  "class": "Disk"
}
Queue Length
 {
  "unit": "Count",
  "type": "builtin",
  "counter": "AverageDiskQueueLength",
  "counterSpecifier": "/builtin/Disk/AverageDiskQueueLength/sdc",
  "annotation": [
    {
      "locale": "en-us",
      "displayName": "sdc avQL"
    }
  ],
  "condition": "Name=\"sdc\"",
  "class": "Disk"
}
Mount Point Metrics
You can define metrics collection for mount points (/p10_RAID, /p20, p30, /, etc…) and aggregated values (_Total). These metrics are available under the FileSystem Class (built-in).
Monitoring of individual mountpoints is necessary to detect Disk Level Throttling. By monitoring the _Total aggregated value you can detect VM Level Throttling.
Below json snippets define metric collection items within the “performanceCounterConfiguration” array in the configuration file:
Mount Point IOPS – Transfers Per Second
 {
  "unit": "CountPerSecond",
  "type": "builtin",
  "counter": "TransfersPerSecond",
  "counterSpecifier": "/builtin/FileSystem/TransfersPerSecond/p10_RAID",
  "annotation": [
    {
      "locale": "en-us",
      "displayName": "p10_RAID IOPS"
    }
  ],
  "condition": "Name=\"/p10_RAID\"",
  "class": "FileSystem"
}
Mount Point Bps – Bytes per Second
 {
  "unit": "BytesPerSecond",
  "type": "builtin",
  "counter": "BytesPerSecond",
  "counterSpecifier": "/builtin/FileSystem/BytesPerSecond/p10_RAID",
  "annotation": [
    {
      "locale": "en-us",
      "displayName": "p10_RAID BPS"
    }
  ],
  "condition": "Name=\"/p10_RAID\"",
  "class": "FileSystem"
}
Mount Point _Total – Transfers Per Second and Bytes per Second
 {
  "unit": "CountPerSecond",
  "type": "builtin",
  "counter": "TransfersPerSecond",
  "counterSpecifier": "/builtin/FileSystem/TransfersPerSecond/_Total",
  "annotation": [
    {
      "locale": "en-us",
      "displayName": "_Total IOPS"
    }
  ],
  "condition": "Name=\"_Total\"",
  "class": "FileSystem"
},
{
  "unit": "BytesPerSecond",
  "type": "builtin",
  "counter": "BytesPerSecond",
  "counterSpecifier": "/builtin/FileSystem/BytesPerSecond/_Total",
  "annotation": [
    {
      "locale": "en-us",
      "displayName": "_Total BPS"
    }
  ],
  "condition": "Name=\"_Total\"",
  "class": "FileSystem"
}
General Settings
You can also set a sample rate to define how often the metric of the performance counter will be collected. By default, it's set to 15 seconds so every 15 seconds one value for the performance counter will be collected. The smallest supported sample rate is 15 seconds. If your workload is more constant you can choose a higher sample rate like 30 or 60. The sample rate can be quickly changed at any time and you can monitor the added counters thru the Azure portal thru "Metrics”, so you should test the optimal values for monitoring. You can set this value individually for each counter, or globally for all counters at same time.
A copy of the Public Configuration file used in this sample scenario is available here.
Extension Installation
The Azure CLI script below can be used to configure the Diagnostic Extension:
 $my_resource_group=<VM Resource Group Name>
$my_linux_vm=<VM Name>
$my_diagnostic_storage_account=<Diagnostic Storage Account Name>
$my_config_file=<.json Public Configuration File>
$my_diagnostic_storage_account_sastoken=$(az storage account generate-sas --account-name $my_diagnostic_storage_account --expiry 9999-12-31T23:59Z --permissions wlacu --resource-types co --services bt -o tsv)
$my_lad_protected_settings="{'storageAccountName': '$my_diagnostic_storage_account', 'storageAccountSasToken': '$my_diagnostic_storage_account_sastoken'}"
az vm extension set --publisher Microsoft.Azure.Diagnostics --name LinuxDiagnostic --version 3.0 --resource-group $my_resource_group --vm-name $my_linux_vm --protected-settings "${my_lad_protected_settings}" --settings $my_config_file
How to review Collected Metrics?
By navigating to the "Metrics" section of the VM's blade, you can select the configured performance metrics to observe their values in the chart. You can switch the "time range" on the upper right to "past hour" or even a timeframe below ("Custom") to see live monitoring data.
Below screenshots shows configuration of IOPS and Bps measured at mount point level defined for a custom timeframe.
View of TransfersPerSecond (IOPS) metrics. 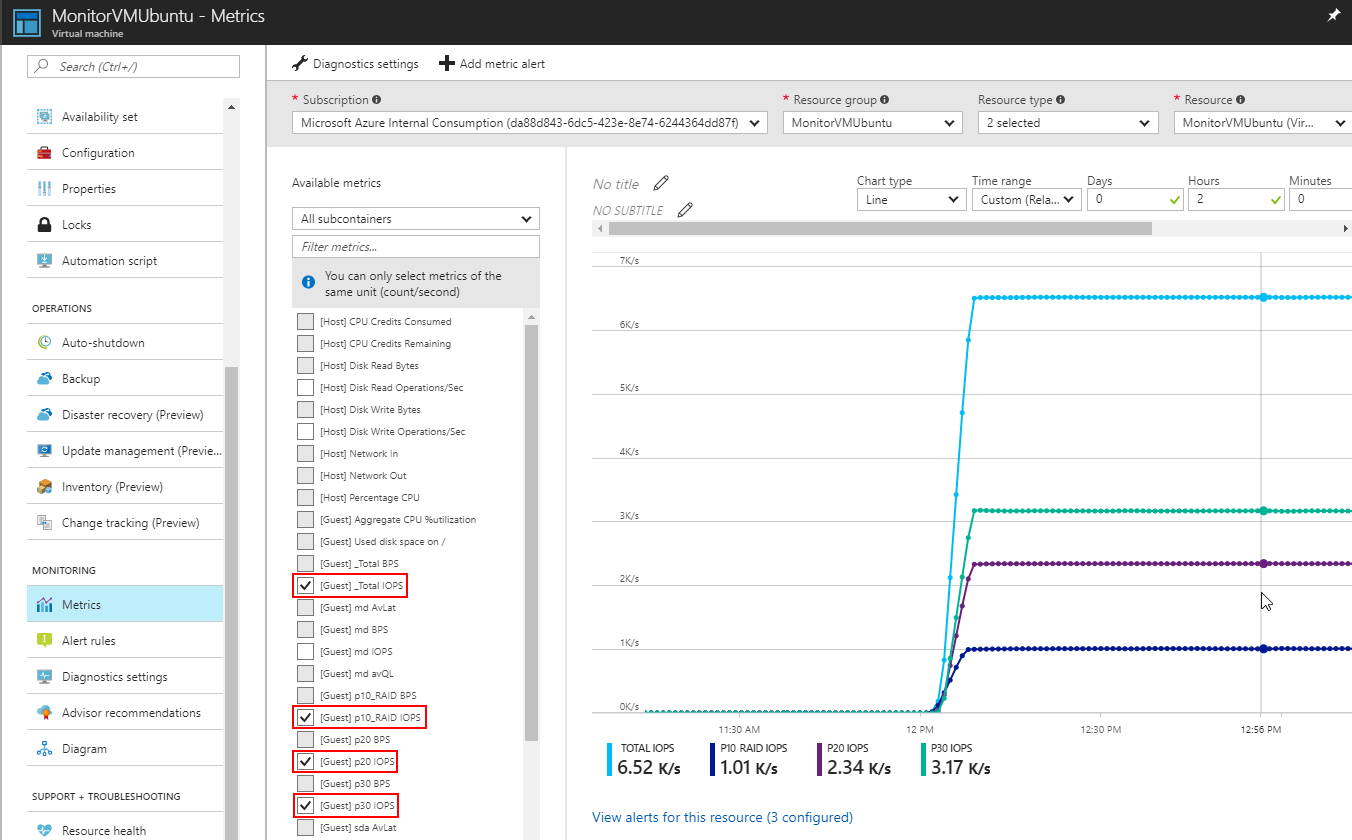
View of BytesPerSecond metrics. 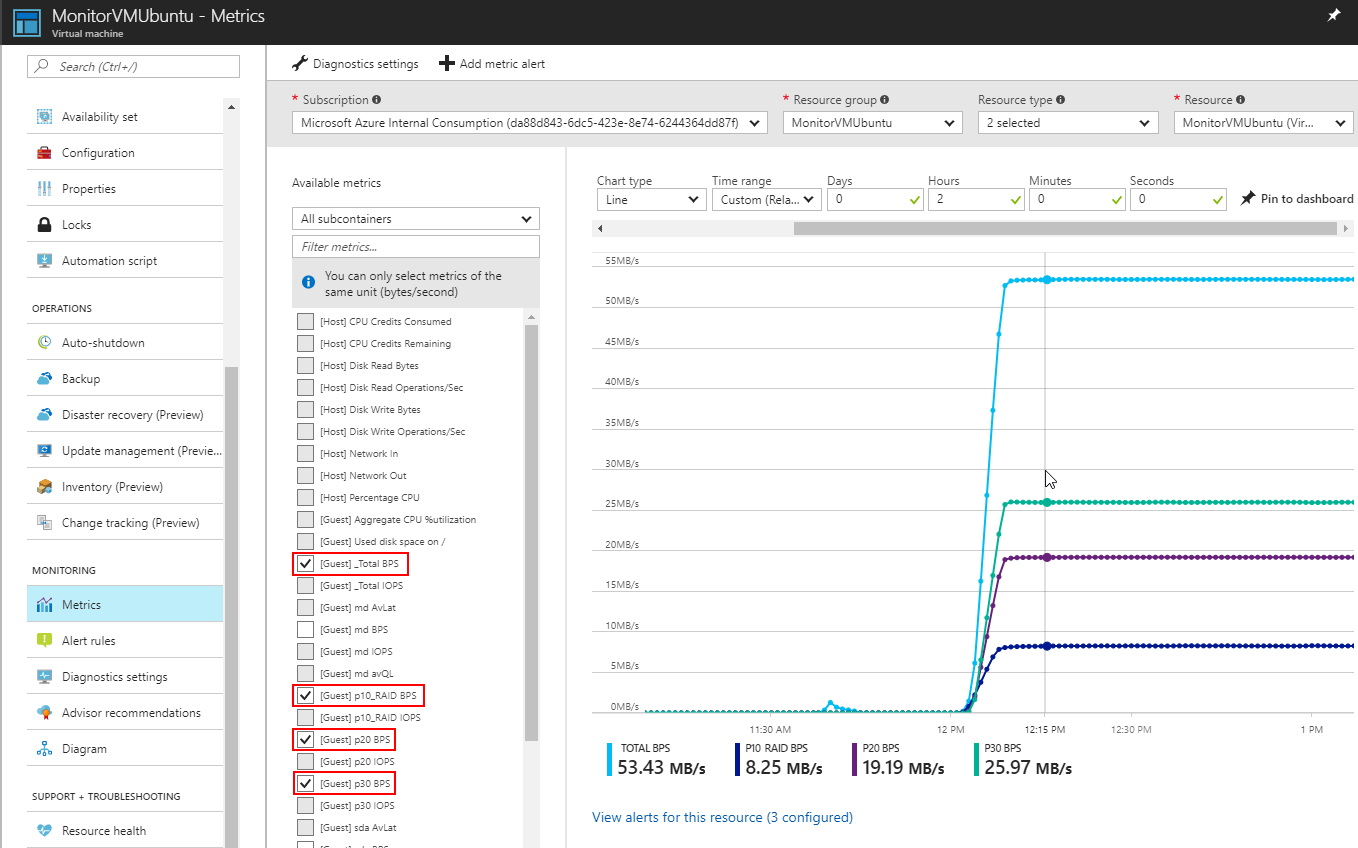
How to configure Metric Alerts?
Disk Level Metric Alert
From the "Metrics" section of the VM's blade you can add rules by clicking the "Add metric alert". This enables notification whenever your workload reaches the performance scalability limit.
Example for configuration of rule for single mount point: 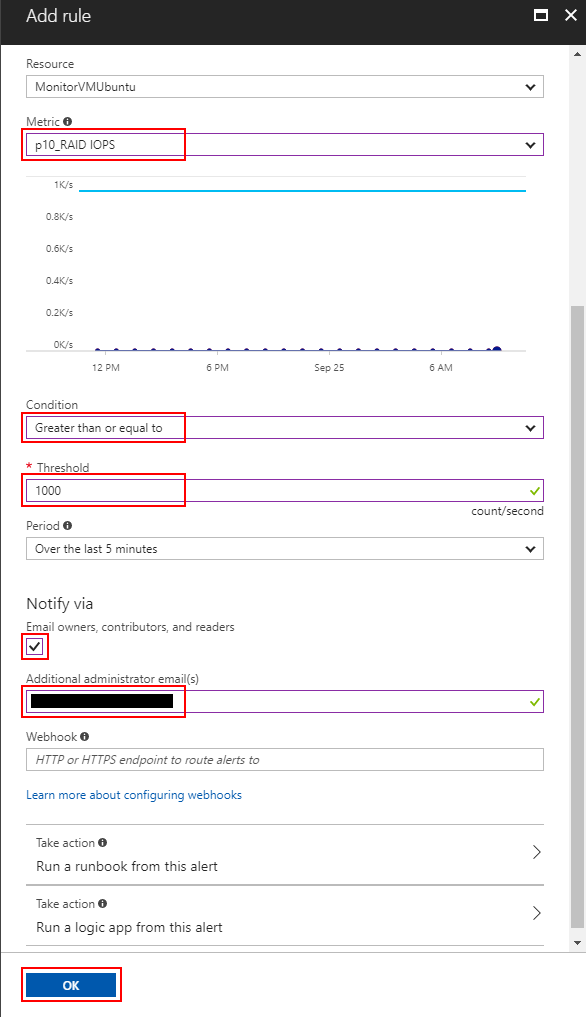
Select your disk performance counter from the "Metric" dropdown (here we choose the counter for the p10_RAID mount point). Then select "Greater than or equal to" from the "Condition" dropdown. Provide a "Threshold" value (here we need to provide the scalability target at disk level, so 1000 IOPS for the striped P10 disks). Select "Over the last 5 minutes" (time span you like to monitor by this alert rule) from the "Period" dropdown. Mark the checkbox to be notified by email and provide an additional email address if required. Finally, you need to provide a name for your rule and click "OK".
Please create rules for all added mountpoint counters.
VM Level Metric Alert
To monitor VM Level Throttling, you need to choose the “_Total” aggregated metric and set the threshold to the target VM limit. For the scenario described in this article the IOPS limit is 6400.
Example for configuration of rule on aggregated _Total counter: 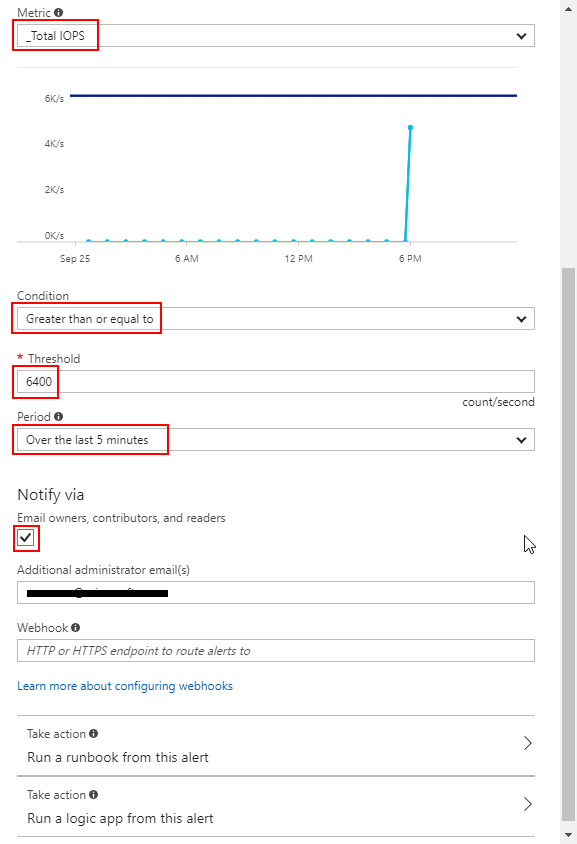
Similar instructions can also be applied for configuring Metric Alert Rules to detect Throttling limit reached for BytesPerSeconds.
How to test Metrics Alert Rules?
You can test Metrics Alert Rules by running benchmarking load with Flexible-IO (fio):
# fio --runtime 7000 fiowrite_p10_RAID.ini
The following fio configuration .ini file can be used to maximize Write Operations per Second against a single mount point ‘p10_RAID’:
 [global]
size=30g
direct=1
iodepth=256
ioengine=libaio
bs=8k

[writer1]
rw=randwrite
directory=/p10_RAID
[writer2]
rw=randwrite
directory=/p10_RAID
[writer3]
rw=randwrite
directory=/p10_RAID
[writer4]
rw=randwrite
directory=/p10_RAID
You can access the ‘Metrics’ section on the VM’s blade and monitor a single mount point, like i.e. ‘/p10_RAID IOPS’ by selecting the guest metric “[Guest] p10_RAID IOPS”.
As per the above screenshot, the p10_RAID volume reached 1020 IOPS, meeting the criteria configured on the alert rule and it lasted for more than 5 minutes. An email notification will be sent.
Sample email alert for reaching the Disk Level limit: 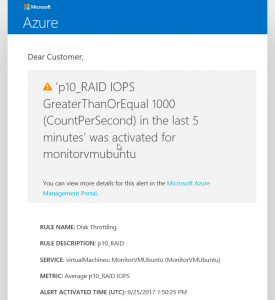
Example notification email for workload has decreased below the Disk level limit (has been resolved, so workload doesn't meet the defined criteria of the alert rule): 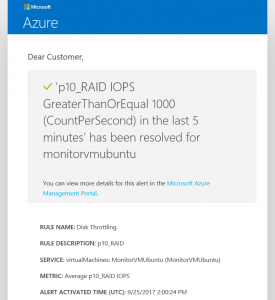
To test the VM Level Throttling Metric Alert you can run multiple simultaneous fio executions against different mount points. You must make sure that the total IOPS generated against all the mount points in the VM are enough to overcome the VM Limit. The fio execution must also be perfectly configured to maximize target mount point IOPS.
In our example we have:
- 1000 IOPS generated over /p10_RAID.
- 2300 IOPS generated over /p20
- 5000 IOPS generated over /p30
Total expected IOPS is 8300, which is greater than 6400. This is also telling us that the only valid combination of tests to reach VM Limit is by maximizing all 3 mountpoints at same time.
Below screenshot shows VM Total IOPS reaching the target 6400 IOPS defined at VM Level: 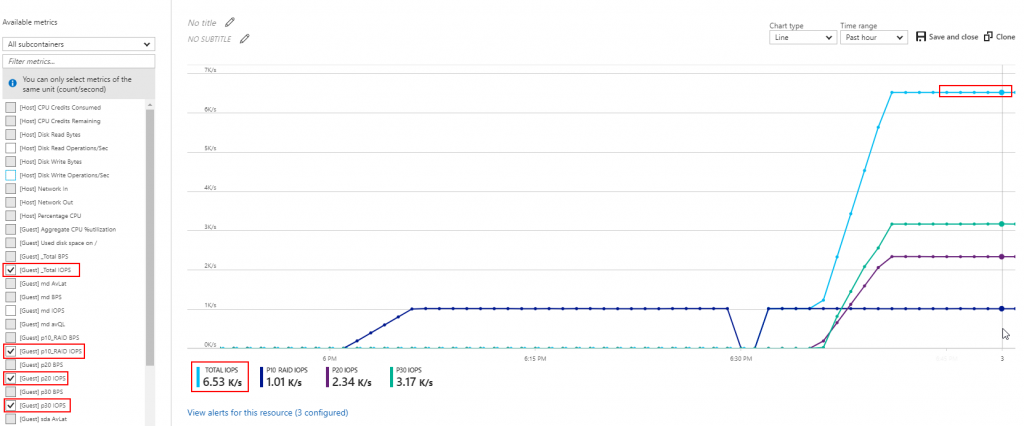
Notification emails showing IOPS Limit reached and then resolved at VM Level: 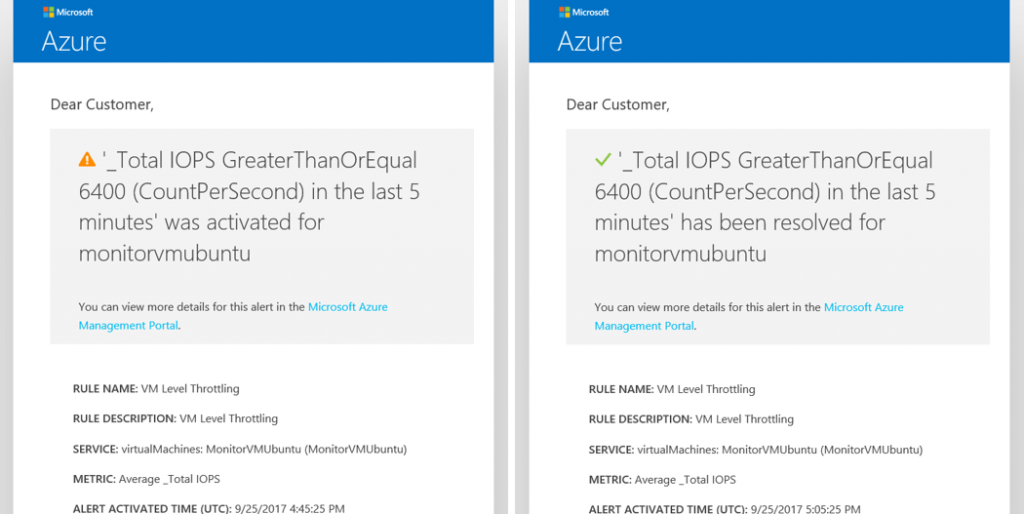
Where is the metrics data stored?
All performance counter metrics will be stored into Azure Storage Tables inside the provided storage account.
Example Storage Table populated by diagnostics metrics using Azure Storage Explorer: 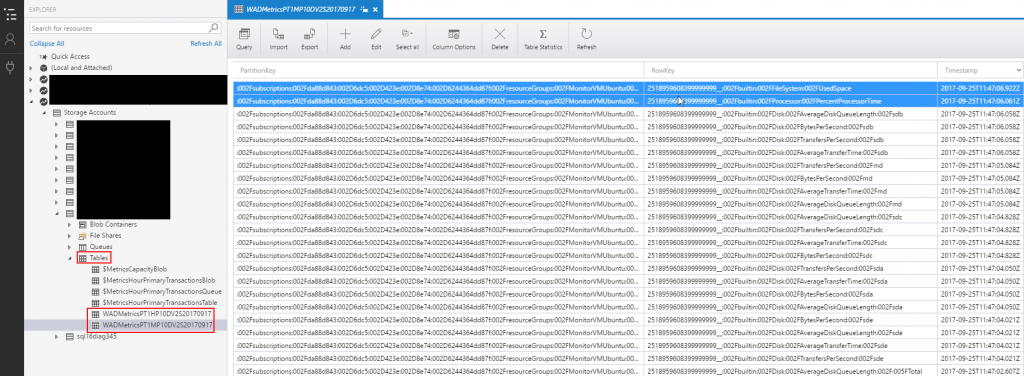
To prevent excessive costs for Monitoring data which is archived in table storage, you should consider doing "data maintenance" from time to time:
https://gallery.technet.microsoft.com/scriptcenter/How-to-clear-out-bfb2b41d
Conclusions
This article provided end to end guidance to enable Storage Performance monitoring and alerting to detect possible Throttling events on Linux VM created with ARM.
If you don't reach the expected scalability targets at Disk or VM level, but your VM is "behaving slow", please contact Azure support.
Next Steps
Learn more on Benchmarking Azure Premium Storage on Linux VM
Configuring Storage on Linux VM
Linux Diagnostic Extension and related components
- Use Linux Diagnostic Extension to monitor metrics and logs
- System Center Cross Platform Provider for Operations Manager
- Open Management Infrastructure
More about Premium Storage
- High-performance Premium Storage and managed disks for VMs
- Azure Premium Storage, now generally available
More about Linux VM sizes