How to monitor and alert potential Disk and VM Level IO Throttling on Windows VMs using ARM
This article will present a step-by-step guide to enable disk performance monitoring on Windows VMs running on Azure.
Goal is to detect potential Disk Level and VM Level IO Throttling.
This guideline is applicable to all Azure VMs deployed with Azure Resource Manager and running any Windows OS version.
Let's start first by explaining some prerequisites concepts:
What is Throttling?
Azure Disks are provisioned with a maximum number of IOPS and Throughput depending on the Storage Type (Standard or Premium). When using Premium Storage there are also other factors to consider, which are VM size and Disk sizes you choose. When applications try to drive IOPS or Throughput above the limits imposed by the VM or Disk size, the Azure platform will throttle it. This manifests in the form of degraded performance in your application. This could add up to higher latency, limited Throughput or limited IOPS.
We can differentiate between two types of Throttling: Disk Level and VM Level Throttling.
For more information about Throttling see:
/en-us/azure/storage/common/storage-premium-storage-performance#throttling
What is Disk Level Throttling?
Basically, you are exceeding the performance limits/scalability targets for a virtual machine disk which will lead to higher latency as all IOs which exceed the limit will be queued.
See limits for managed and unmanaged virtual machine disks here:
/en-us/azure/azure-subscription-service-limits#storage-limits
What is VM Level Throttling?
Basically, you are exceeding the performance limits/scalability targets for a virtual machine as the combined IOs of all attached disks have exceeded the cached or uncached disk throughput limit. This only applies when using Premium Storage Disks. There is no VM Level IO Throttling when using Standard Storage Disks on non-premium VM sizes.
For further information about IO Throttling see: https://blogs.technet.microsoft.com/xiangwu/2017/05/14/azure-vm-storage-performance-and-throttling-demystify/
For the guideline presented in this article, we will use a sample VM configured as follows:
VM Name: "MonitorVM"?
VM size : DS2_v2
Disk Layout:
Attached 4 data disks to VM:
2x P10 (128 GB - Disk limits: 500 IOPS or 100 MB/s - Disk Cache Setting: None)
1x P20 (512 GB - Disk limits: 2300 IOPS or 150 MB/s - Disk Cache Setting: None)
1x P30 (1024 GB - Disk limits: 5000 IOPS or 200 MB/s - Disk Cache Setting: None)
In this scenario, the disk caching is disabled on all the attached disks (see above), so we need to look up the uncached disk throughput limit of the VM (IOPS / MBps) at column "Max uncached disk throughput: IOPS/MBps"? as followed:
/en-us/azure/virtual-machines/windows/sizes-general#dsv2-series 
If we had enabled disk caching on all disk (e.g. ReadOnly/ReadWrite), we would have to look up the cached disk throughput limit of the VM (IOPS / MBps) at column "Max cached and temp storage throughput: IOPS/MBps (cache size in GiB)" (see above).
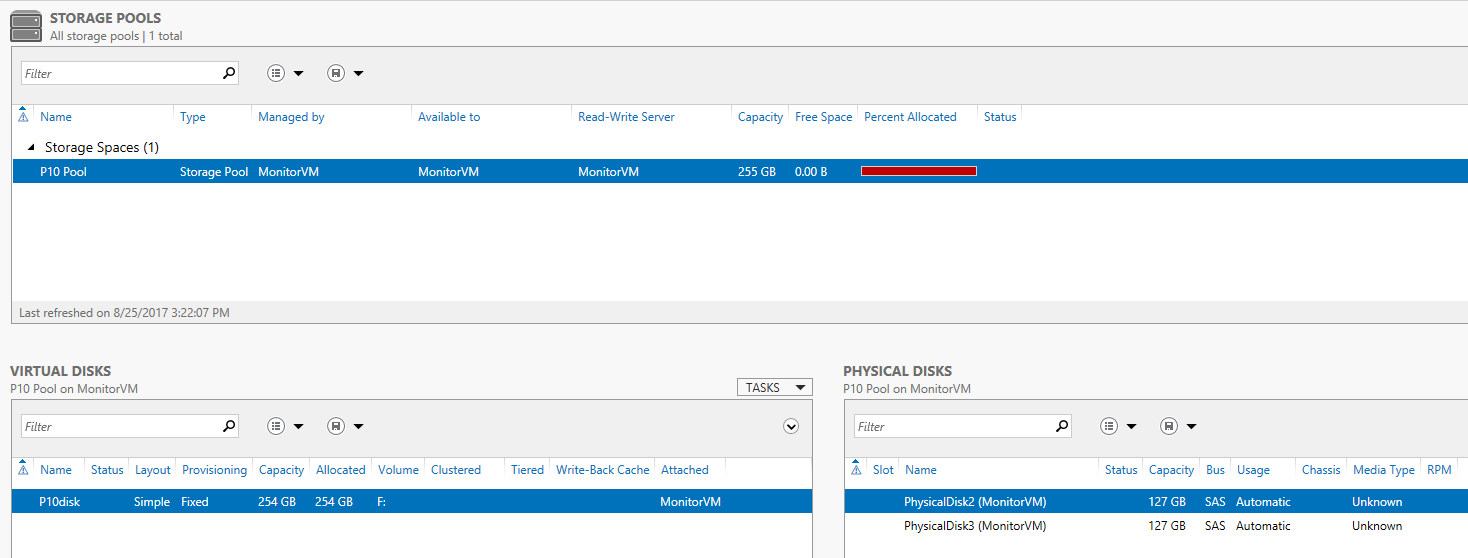
Details about configured disks setup inside the VM "MonitorVM"?:
Created Storage Spaces configuration (striped volume) for 2x P10 disks (Volume F:\), IO limit 1000 IOPS (2x 500 IOPS):
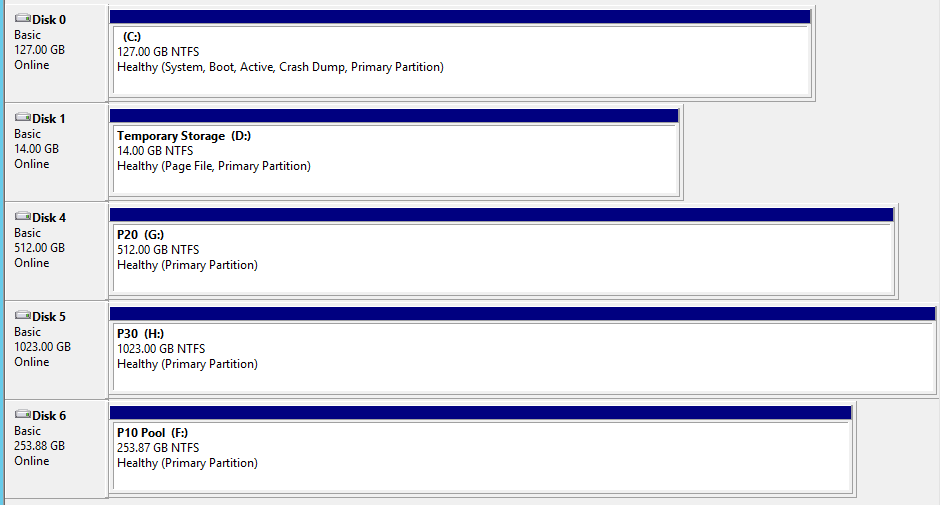
View of Disk Management:
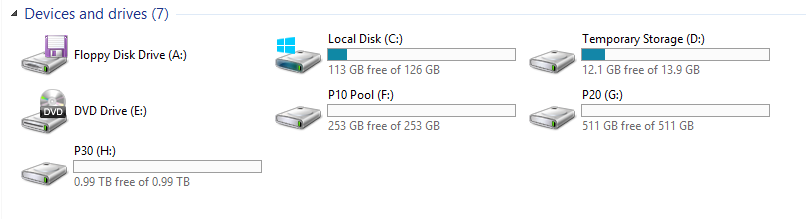
View of File Explorer:
View of Performance Monitor inside the VM "MonitorVM"?:
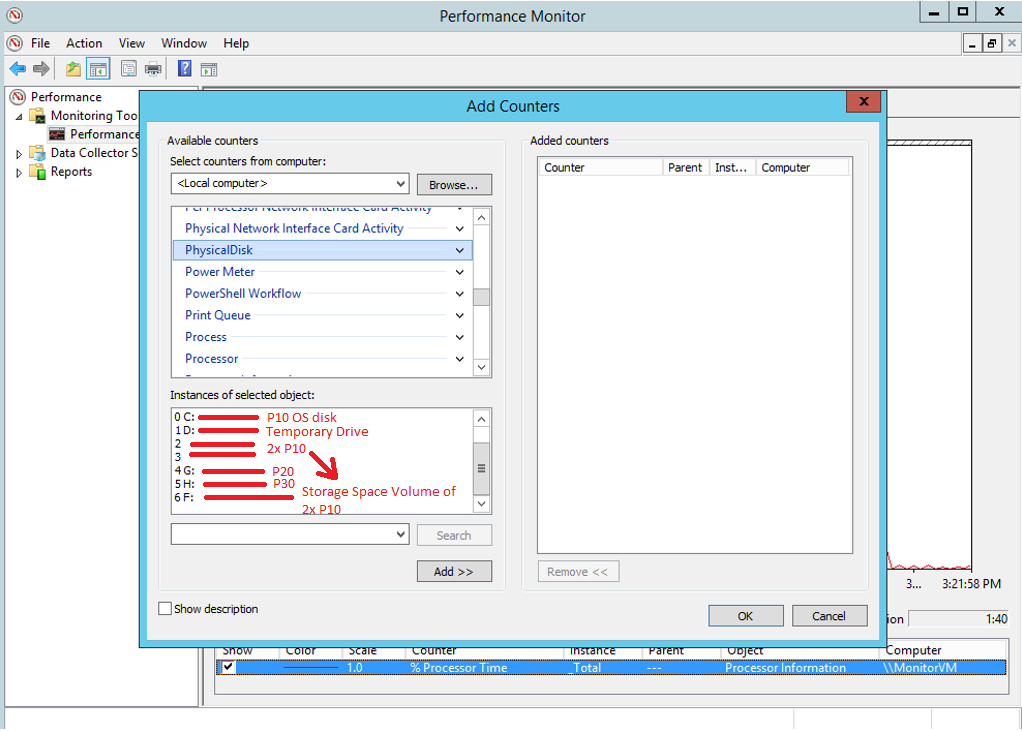
Now that we have collected information about the "instances"? for the VM's PhysicalDisk performance counters from the Performance Monitor within the VM, we can add the following performance counters to the diagnostics settings blade to monitor IOPS in the Azure Portal:
IOPS:
"\PhysicalDisk(_Total)\Disk Transfers/sec" (VM Level Throttling - 6400 IOPS)
"\PhysicalDisk(0 C: )\Disk Transfers/sec" (Disk Level Throttling - OS disk P10 - 500 IOPS)
"\PhysicalDisk(2)\Disk Transfers/sec" (Disk Level Throttling - P10 disk - 500 IOPS)
"\PhysicalDisk(3)\Disk Transfers/sec" (Disk Level Throttling - P10 disk - 500 IOPS)
"\PhysicalDisk(4 G: )\Disk Transfers/sec" (Disk Level Throttling - P20 disk - 2300 IOPS)
"\PhysicalDisk(5 H: )\Disk Transfers/sec" (Disk Level Throttling - P30 disk - 5000 IOPS)
"\PhysicalDisk(6 F: )\Disk Transfers/sec" (Disk Level Throttling - Storage Spaces Drive - 1000 IOPS)
How to enable Performance Counter Monitoring on the Azure Portal?
Performance counters which have been added through the diagnostics settings on the Azure Portal:

- Navigate to your VM "MonitorVM"? in the Azure Portal.
- Select "Diagnostics settings"? on the VM's blade. Switch to "Performance counters"? tab (1. ).
- Choose "Custom"? (2. ) to add new custom performance counter.
- Add text of new performance counter in textbox (3. ) e.g. "\PhysicalDisk(0 C:)\Disk Transfers/sec"?.
- Click "Add"? button (4. ) to add performance counter to collection.
- Provide sample rate by adding number of seconds to textbox (5. ).
- Finally click "Save"? button at the top to save configuration.
The sample rate defines how often the metric of the performance counter will be collected. By default, it's set to 60 seconds so every 60 seconds one value for the performance counter will be collected. If your workload is spiky you may need a smaller sample rate like 10 seconds or even down to 1 second to be able to understand if you have reached a limitation at disk or VM level. If your workload is more constant you can choose a higher sample rate like 30 or 60. The sample rate can be quickly changed at any time and you can monitor the added counters thru the Azure portal thru "Metrics"? so you should test the optimal values for monitoring.
How to review the collected metrics ?
View of the "Metrics"? monitoring within the Azure Portal:
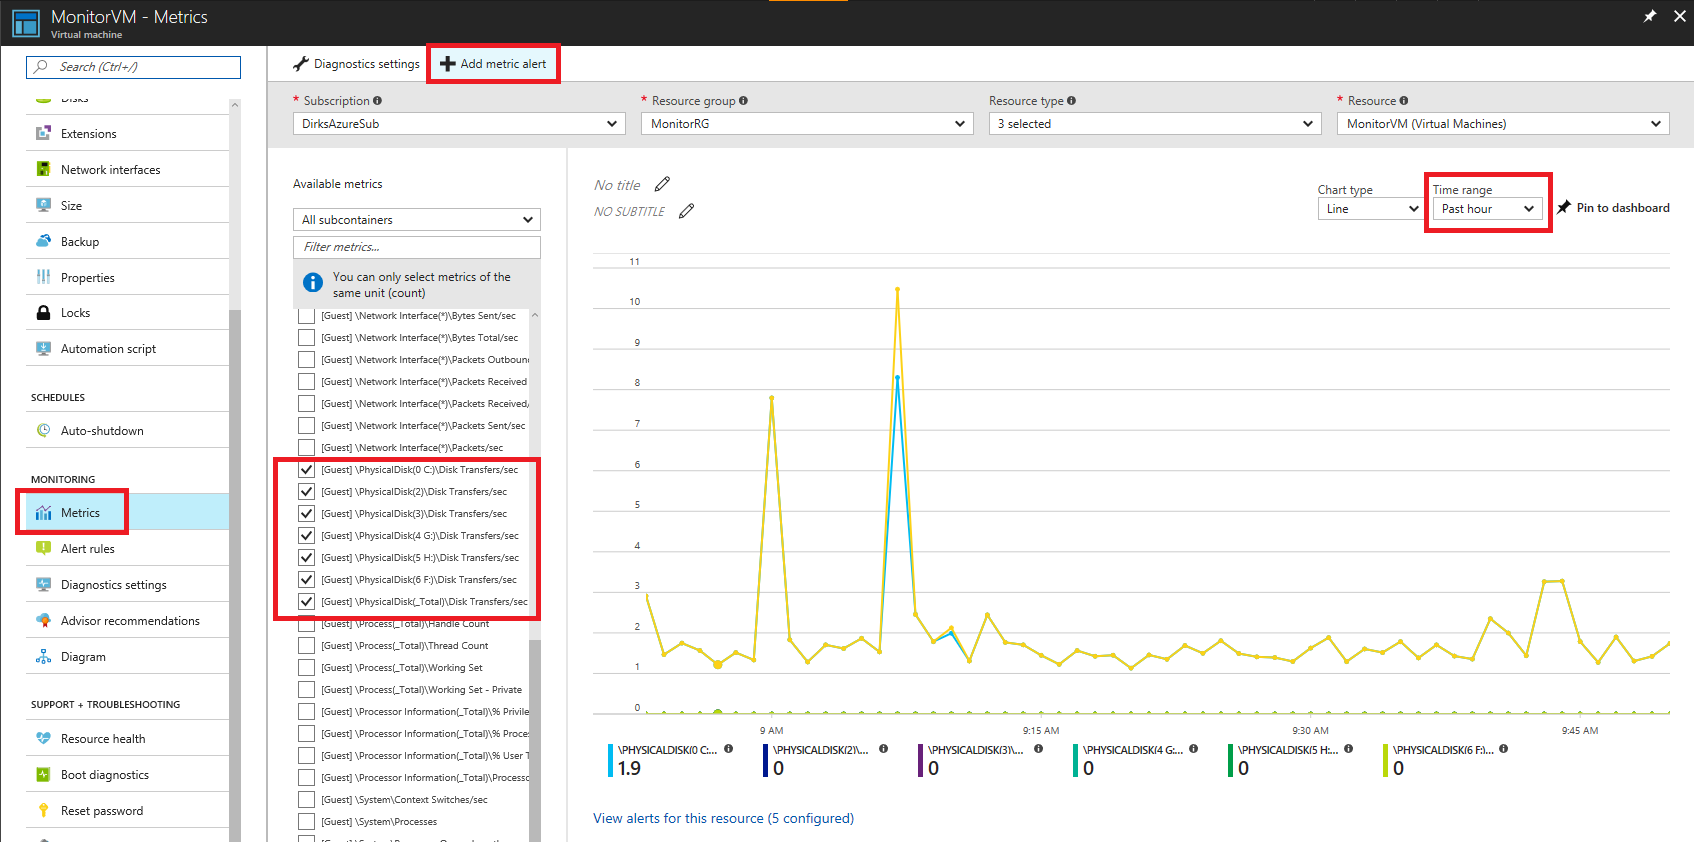
By navigating to the "Metrics"? section of the VM's blade, you can select the added performance counters to see their values in the chart. You can switch the "time range"? on the upper right to "past hour"? or even a timeframe below ("Custom"?) to see live monitoring data.
Now we are going to add rules by clicking the "Add metric alert"? so we will be notified when our workload has reached a limit.
How to enable metric alert Rules?
Example for configuration of rule at disk level:
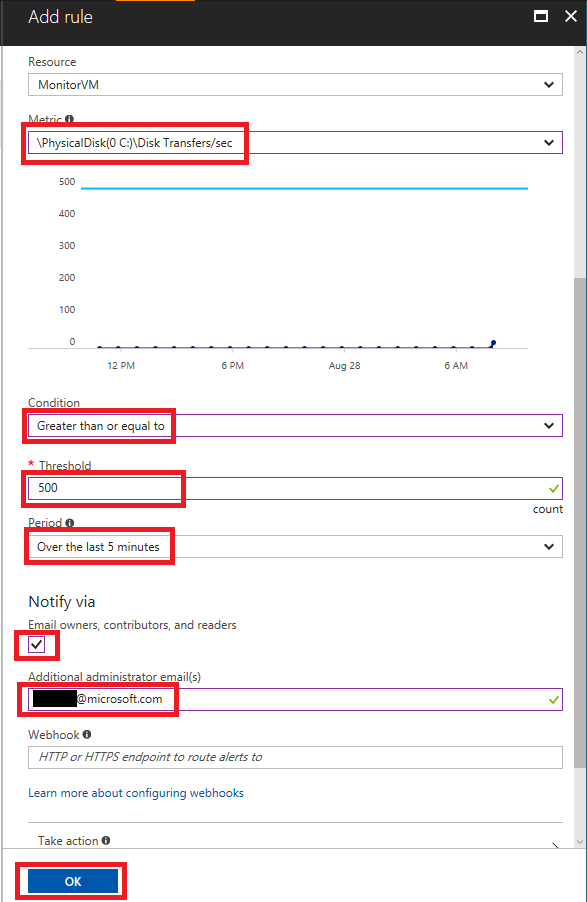
Select your disk performance counter from the "Metric" dropdown? (here we have chosen the counter for the OS disk). Then select "Greater than or equal to" from the "Condition" dropdown?. Provide a "Threshold"? value (here we need to provide the scalability target at disk level, so 500 IOPS for a P10 disk). Select "Over the last 5 minutes" (time span you like to monitor by this alert rule) from the "Period" dropdown?. Mark the checkbox to be notified by email and provide an additional email address if required. Finally, you need to provide a name for your rule and click "OK"?.
Please create rules for all added performance counters.
Example for configuration of rule at VM level:
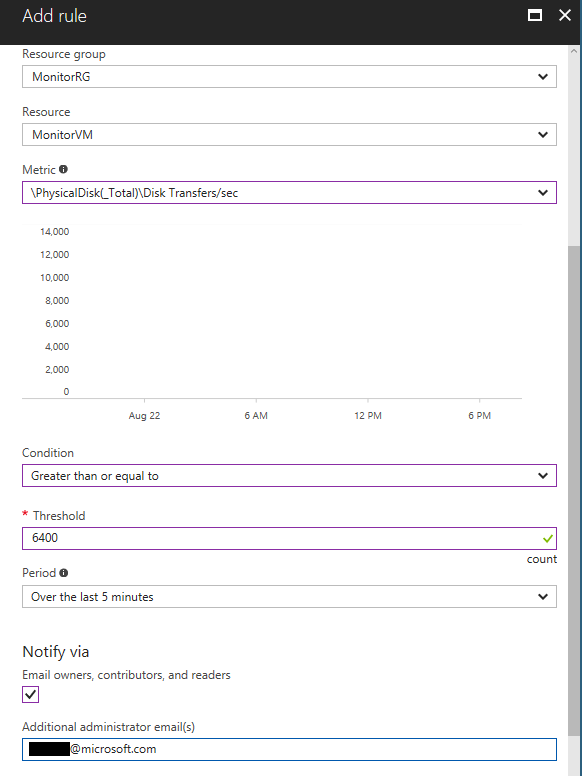
The counter which contains "(_Total)" is used for the rule to monitor the VM limit ( "\PhysicalDisk(_Total)\Disk Transfers/sec"? for IOPS).
How to test the Metrics Alert Rules?
To be able to test the configured rules I have used the benchmark tool diskspd with the following parameters (e.g. for volume F which is the storage space drive for 2x P10 disks):
diskspd.exe -c1024M -d300 -W30 -w100 -t1 -o25 -b8k -r -h -L F:\_diskSpd_test\testfile.dat
Example for workload of storage spaces drive reaching the limits:

As we can see from the screenshot above, the two P10 disks of the storage spaces drive are both at 500 IOPS or above and the volume F: is at 1000 IOPS.
Example for workload of P30 disk and then VM level reaching the limits:
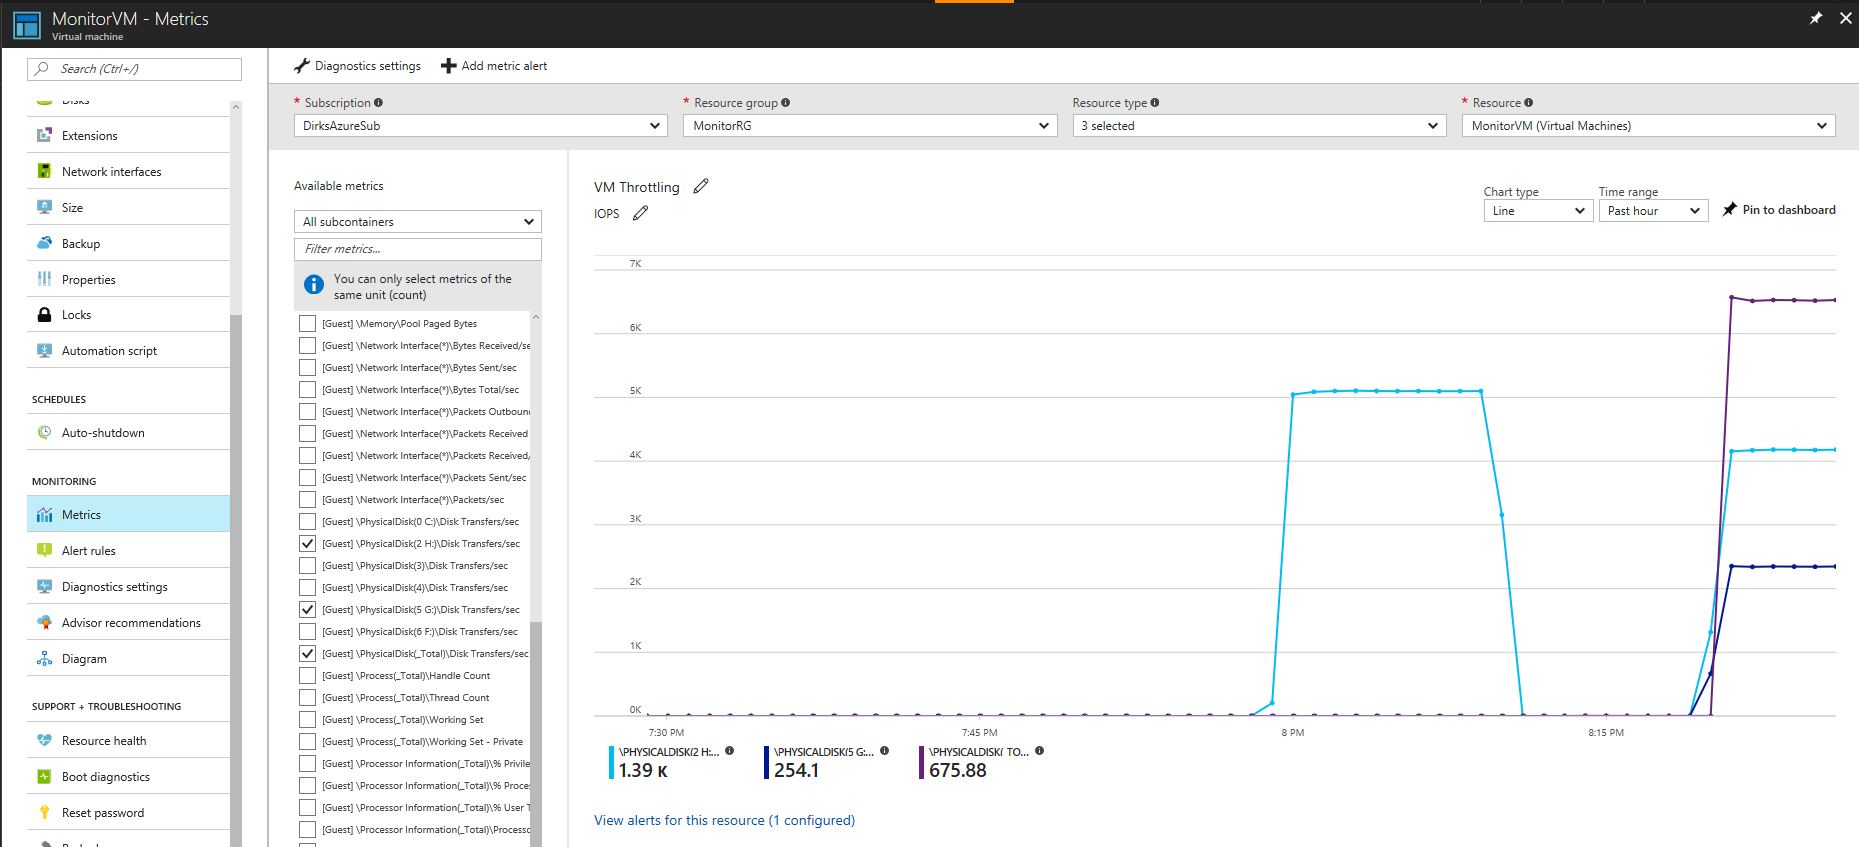
As we can see from the screenshot above, first the limit of 5000 IOPS for the P30 disks was reached and then the limit at VM level was reached as the combined workload of both disks (G: P20 and H: P30) together reached 6400 IOPS. While the theoretical workload of both disks combined is 7300 IOPS = 2300(P20) + 5000(P30), the uncached throughput limit of a VM of size DS2_v2 is 6400 IOPS.
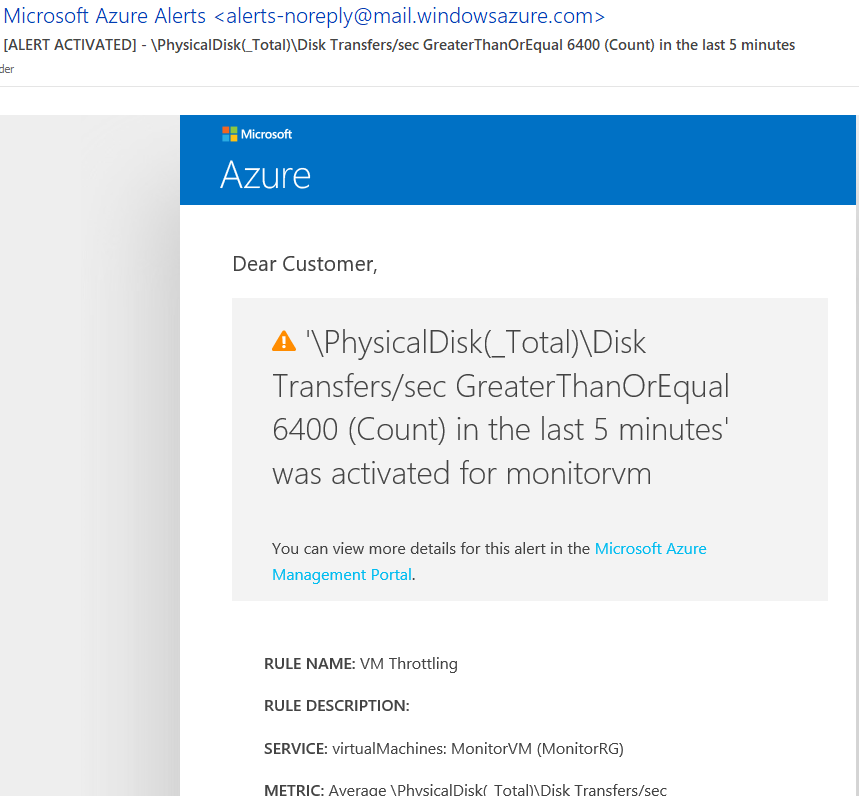
If the workload inside your VM has met the configured criteria of the alert rules defined above, you will be notified by email.
Example notification email for reaching the VM level limit:
Example notification email for workload has decreased below the VM level limit (has been resolved, so workload doesn't meet the defined criteria of the alert rule):

Due to the nature of IO requests it's possible that your workload may not reach the IOPS limit, but the throughput limit has been reached (workload with larger IO size), so you need to configure the monitoring and alert rules for MBps as well:
Throughput/MBps:
"\PhysicalDisk(_Total)\Disk Bytes/sec" (VM Level Throttling - 96 MBps)
"\PhysicalDisk(0 C: )\Disk Bytes/sec" (Disk Level Throttling - OS disk P10 - 100 MBps)
"\PhysicalDisk(2)\Disk Bytes/sec" (Disk Level Throttling - P10 disk - 100 MBps)
"\PhysicalDisk(3)\Disk Bytes/sec" (Disk Level Throttling - P10 disk - 100 MBps)
"\PhysicalDisk(4 G: )\Disk Bytes/sec" (Disk Level Throttling - P20 disk - 150 MBps)
"\PhysicalDisk(5 H: )\Disk Bytes/sec" (Disk Level Throttling - P30 disk - 200 MBps)
"\PhysicalDisk(6 F: )\Disk Bytes/sec" (Disk Level Throttling - Storage Spaces Drive 2x P10 - 200 MBps)
As all limits for throughput at disk level are higher than the possible VM level throughput limitation, we only need to configure the limit at VM level. If the VM level throughput limitation is higher than the limitation at disk level (e.g. by choosing a VM size DS4_v2 - 384 MBps), please configure the monitoring and alerts for each individual disk/volume as well.
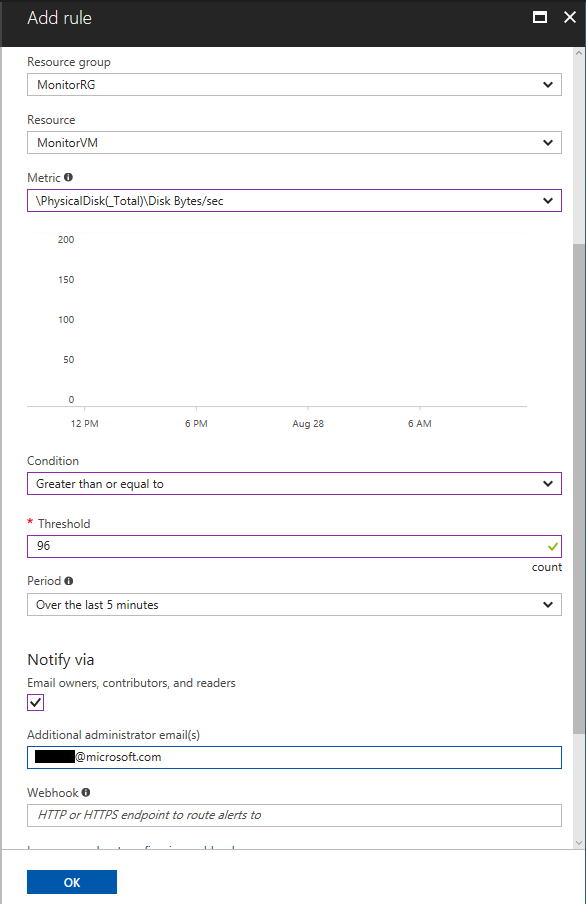
Example for configuration of rule at VM level for MBps:
If your workload has reached the maximum IOPS or MBps at Disk or VM level the values of the following two counters will increase due to throttling (e.g. for the OS disk):
"\PhysicalDisk(0 C: )\Current Disk Queue Length"?
"\PhysicalDisk(0 C: )\Avg. Disk sec/Transfer"?
Where is the metrics data stored?
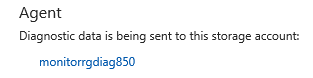
All performance counter metrics will be stored in table named "WADPerformanceCountersTable" within the storage account which was setup from the  of your VM e.g.:
To prevent excessive costs for Monitoring data which is archived in table storage, you should consider doing "data maintenance"? from time to time:
https://gallery.technet.microsoft.com/scriptcenter/How-to-clear-out-bfb2b41d
Conclusions
This article provided end to end guidance to enable Storage Performance monitoring and alerting in order to detect possible Throttling events.
If you don't reach the expected scalability targets at Disk or VM level, but your VM is "behaving slow"?, please use PerfInsights for a first analysis of your disk configuration and to collect more detailed traces or contact Azure support.
Enjoy!
Dirk Schneider - MSFT
Update: Rossano Vitulli has now published a new post to cover a similar monitoring for Linux VMs deployed with Azure Resource Manager.