2 known issues in Windows Azure Diagnostics
As you know, Windows Azure Diagnostics enables you to collect diagnostic data from an application running in Windows Azure. You can use diagnostic data for debugging and troubleshooting, measuring performance, monitoring resource usage, traffic analysis and capacity planning, and auditing. After the diagnostic data is collected it can be transferred to a Windows Azure storage account for persistence. Transfers can either be scheduled or on-demand.
More reference about Windows Azure Diagnostics are here:
Overview: https://msdn.microsoft.com/en-us/library/azure/gg433048.aspx
Practice: https://blogs.msdn.com/b/jianwu/archive/2014/08/15/azure-paas-4.aspx
In this blog, 2 known issues in WAD are summarized with quick workarounds, hopes it will help get better WAD and better cloud service. Special thanks to Peter Thompson reporting this issue and assist us to fix.
Issue 1:
After upgrading Azure SDK to the latest version 2.5, the IIS logs cannot be transferred to Azure Storage account with the following settings in WAD GUI configuration page.
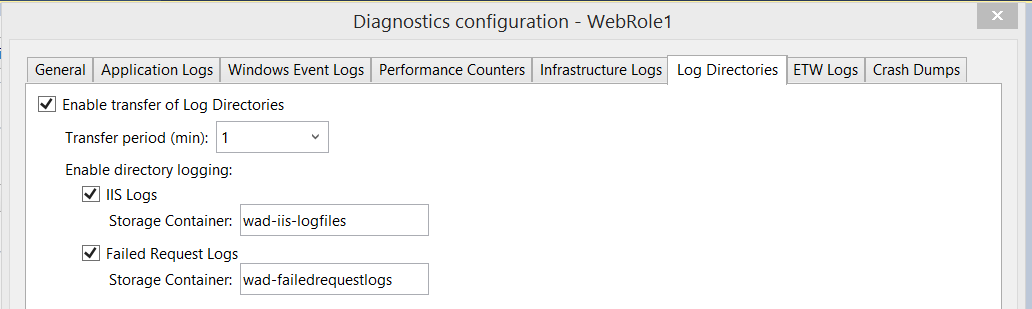
- Cause:
When WAD is generating the WAD configure it gets the IIS log directory from the .NET service manager. It’s very likely that WAD generates its configure just before a new web site is created. In this scenario the configure becomes stale and uses default web site’s log settings. However the default web site’s log settings is not the actual place where the IIS logs will be put.
Defualt web site’s log settings:
<FileWatchItem dontUseNPartitionSpread="true" compressionType="none" eventName="DirectoriesTable" directoryQuotaInMB="6500" lastChangeOffsetInSeconds="300" removeEmptyDirectories="false" container="iiscontainer">
<Directory>"D:\inetpub\logs\LogFiles"</Directory>
</FileWatchItem>
<FileWatchItem dontUseNPartitionSpread="true" compressionType="none" eventName="DirectoriesTable" directoryQuotaInMB="6500" lastChangeOffsetInSeconds="300" removeEmptyDirectories="false" container="failedrequestlogs-container">
<Directory>"D:\inetpub\logs\FailedReqLogFiles"</Directory>
Actual path the web site’s logs are saved (one example:):
C:\Resources\Directory\Test.WebRole1.DiagnosticStore\LogFiles\W3SVC1
- Hotfix:
This issue will be addressed in the next release in SDK3.0 in March or April.
- Workaround:
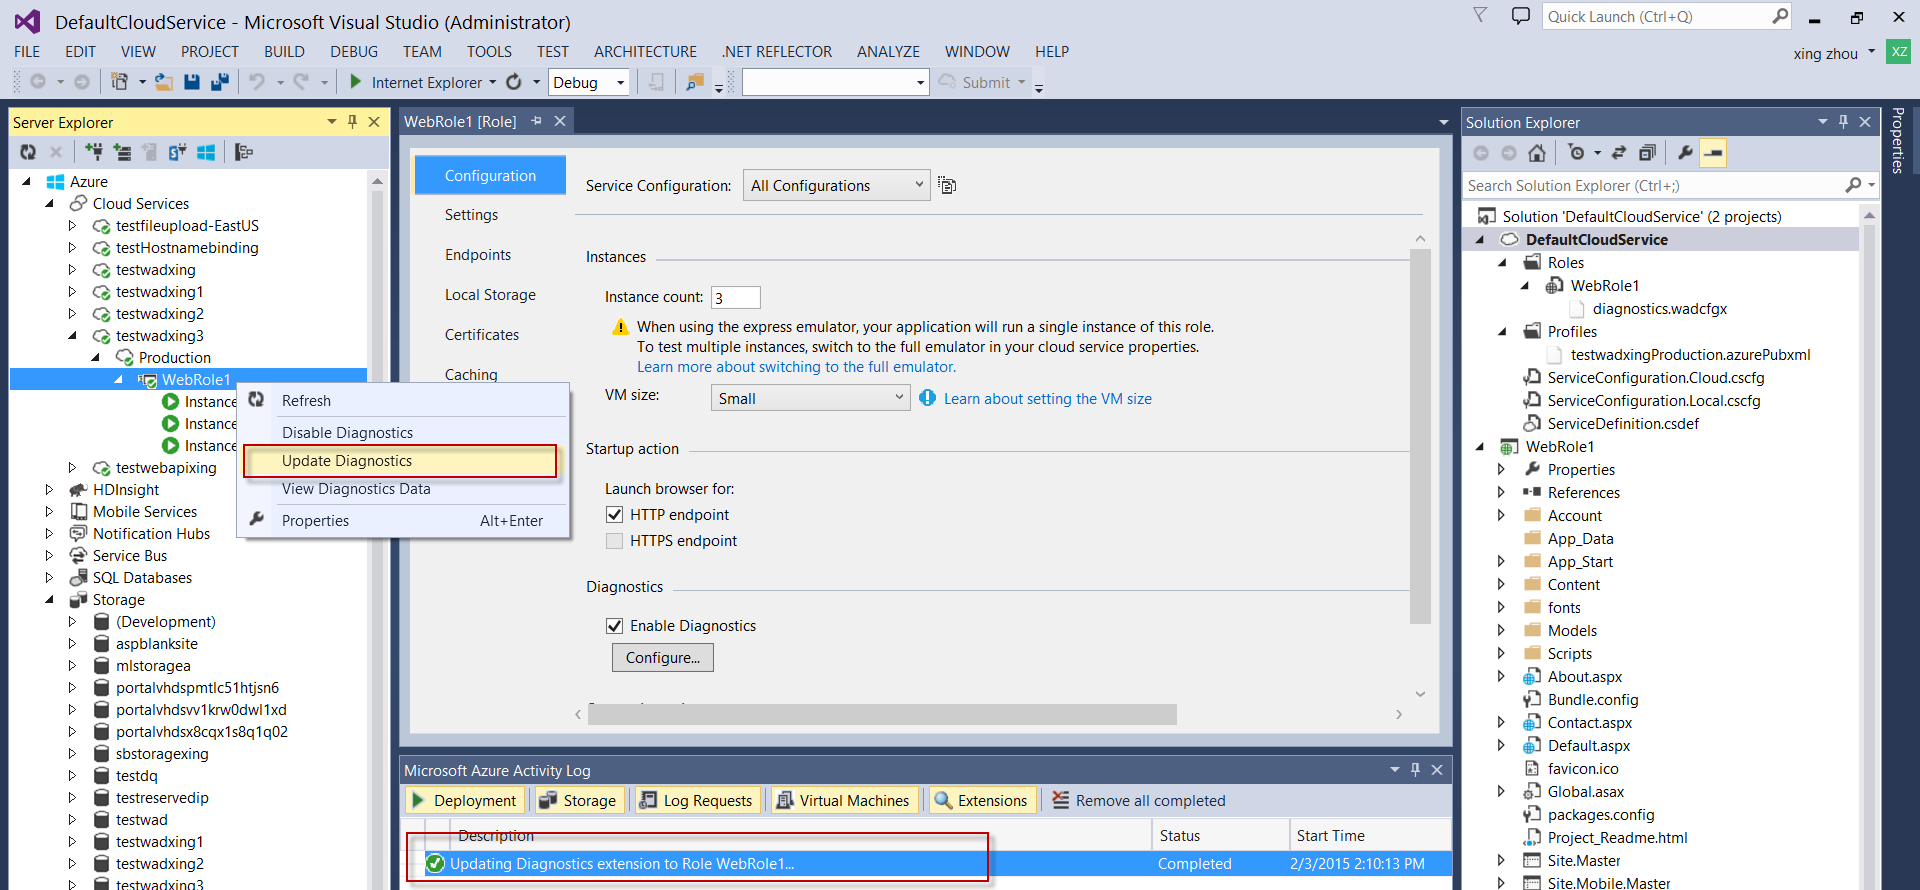
1. Restart WAD agent
All we need to resolve this issue is to restart the WAD agent which will redirect the monitoring folder to the correct one. You can perform either of the following to restart WAD agent.
- · REBOOT the role instances to force the Diagnosticsplugin.exe restarted
- · Send a WAD update via Server Explore in Visual Studio to force WAD agent being restarted
2. Use WAD custom directory logging as a workaround
Azure WAD automatically maps wad-iis-logfiles and wad-failedrequestlogs containers to special folders which exist in web roles. In addition, WAD provides custom directory logging shown as below. Since we are intending to transfer IIS logs to azure storage account, I specify the absolute log path to “\Resources\Directory” where the IIS logs reside. The exact directory path for IIS logs is “C:\Resources\Directory\8723df3598a241688eb39a1cee727639.WebRole1.DiagnosticStore\LogFiles\Web\W3SVC1273337584”, and I take its parent folder for simplicity as I don’t know the deployment ID before the cloud service being deployed.
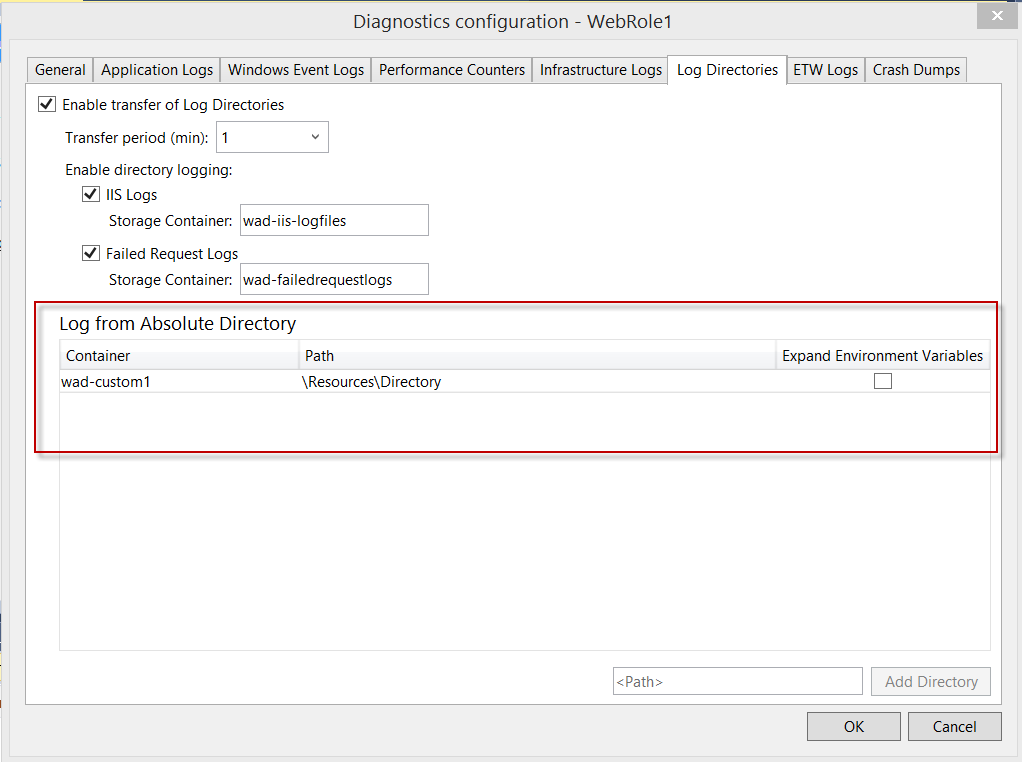
Steps to configure custom logging:
1. Configure via WAD GUI as shown above 2. Add the following lines to .wadcfgx file directly
<Directories scheduledTransferPeriod="PT1M">
<IISLogs containerName="wad-iis-logfiles" />
<FailedRequestLogs containerName="wad-failedrequestlogs" />
<DataSources>
<DirectoryConfiguration containerName="wad-custom1">
<Absolute path="\Resources\Directory" expandEnvironment="false" />
</DirectoryConfiguration>
</DataSources>
</Directories>
Issue 2:
In elder version of Azure SDK like 2.2, newly deployed cloud service worked fine with WAD at beginning, but after some time, customers might observe that certain WAD logs like performance counters and IIS logs were no longer transferred to target storage, though rebooting or reimaging the role instances could resolve problem quickly, sometime later after the rebooting/reimaging, the problem would reoccur again.
- Root cause:
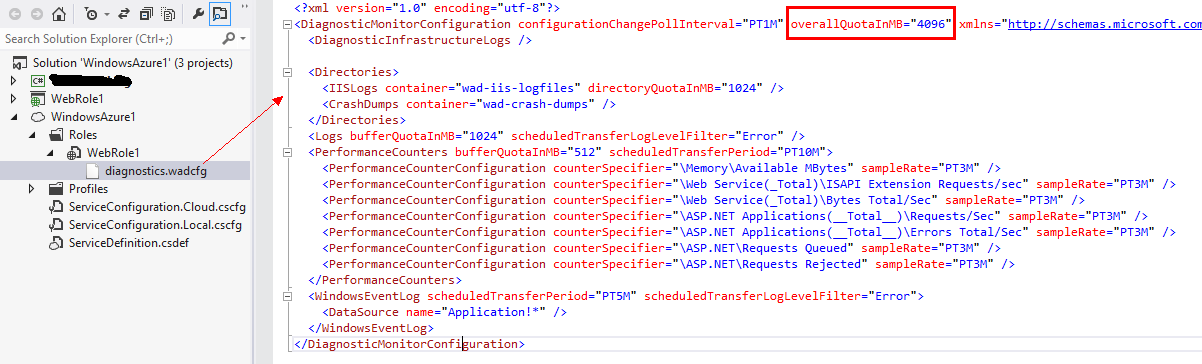
In Azure elder version of SDKs, The total size of all WAD data should be at least 500MB less than the size limit of diagnostics folder C:\Resources\Directory\[deploymentid].[rolename].DiagnosticStore,
By default, the size of the diagnostics folder is 4096MB, the max size of all WAD data can be 4096MB, that means, if in your WAD settings, the sum of *QuotaInMB exceeded 4GB, then there should be less than 500MB between the gap of WAD data and folder size of C:\Resources\Directory\[deploymentid].[rolename].DiagnosticStore, the size gap is used for temporary purpose in WAD, hence if there was no enough space for this temporary use, WAD will stop transferring data to target storage after some time.
- Solution & workaround:
1. Set local resource configuration in servicedefinition.csdef file as below: (this is to set the size limit of C:\Resources\Directory\[deploymentid].[rolename].DiagnosticStore to 6GB)
….
</Imports>
<LocalResources>
<LocalStorage name="DiagnosticStore" sizeInMB="6144" cleanOnRoleRecycle="false"/>
</LocalResources>
</WebRole>
</ServiceDefinition>
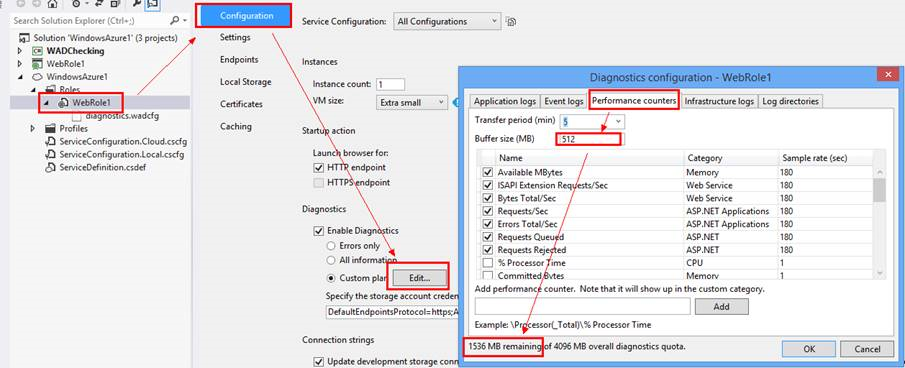
2. Adjust the buffer size for each WAD item to a proper space, like 512MB, and make sure the remaining space is enough for temporary use, like no less than 1 GB. See a sample screenshot:
3. Debug your project first in local emulator, while there is no error, deploy the project to empty staging slot of Azure cloud, and if everything is working fine there, then swap it to production.
Temporary workaround: if you are not able to do the setting changes as above and redeploy right now due to product schedule, you can RDP into the current deployment VMs and then delete the existing log data in “C:\Resources\Directory\[deploymentid].[rolename].DiagnosticStore”, that will make diagnostic work fine for you for some time again. But that is just a temporary workaround like VM reboot/reimage, because if size of new log comes to the limit of those 2 settings, the problem may happen again.