Azure PaaS 快速实践 4 - 诊断和监控云服务(WAD)
前面几节快速实践了Azure PaaS及简单优化,本节将开发一个使用SQL Azure数据库的例子,在其基础上实现云服务的诊断和监控功能。
本节的目标是:快速了解SQL Azure,掌握Azure PaaS服务中的诊断和监控功能(WAD:Windows Azure Diagnostics),学会初步的公有云诊断。
步骤一:创建SQL DataBase
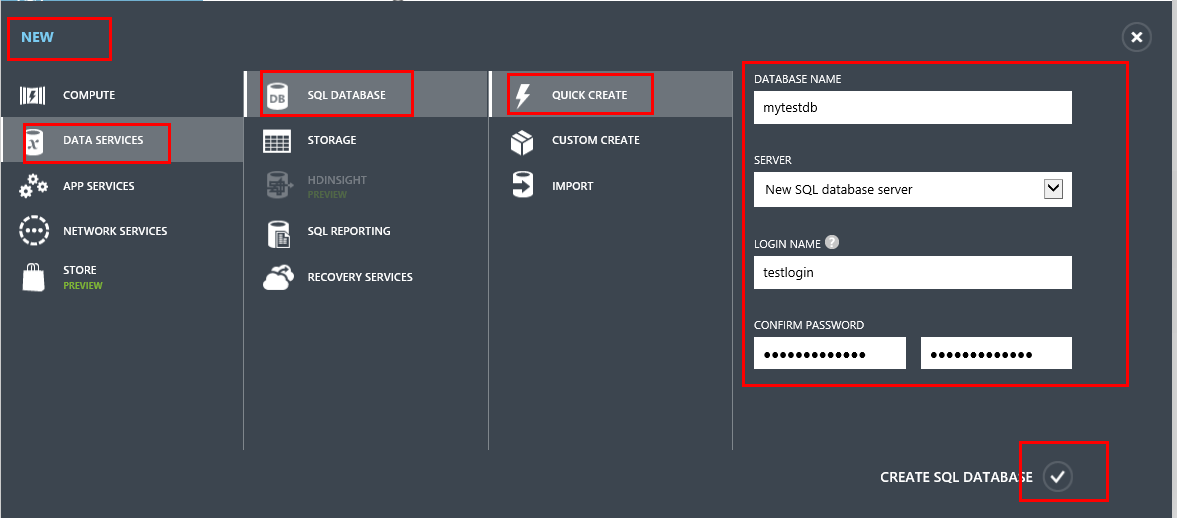
访问Azure管理主页https://manage.windowsazure.com, 登录成功后,选择左下角的New --> DATA SERVICES --> SQL DATABASE --> QUICK CREATE
输入将要创建的数据库名称,如mytestdb
创建一个login用户,用于后面管理SQL数据库,如testlogin,密码:test@123
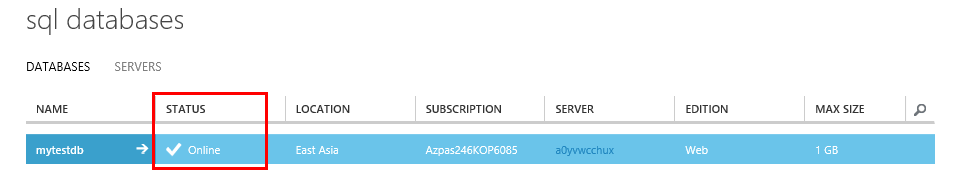
稍等片刻,数据库创建成功,如图:
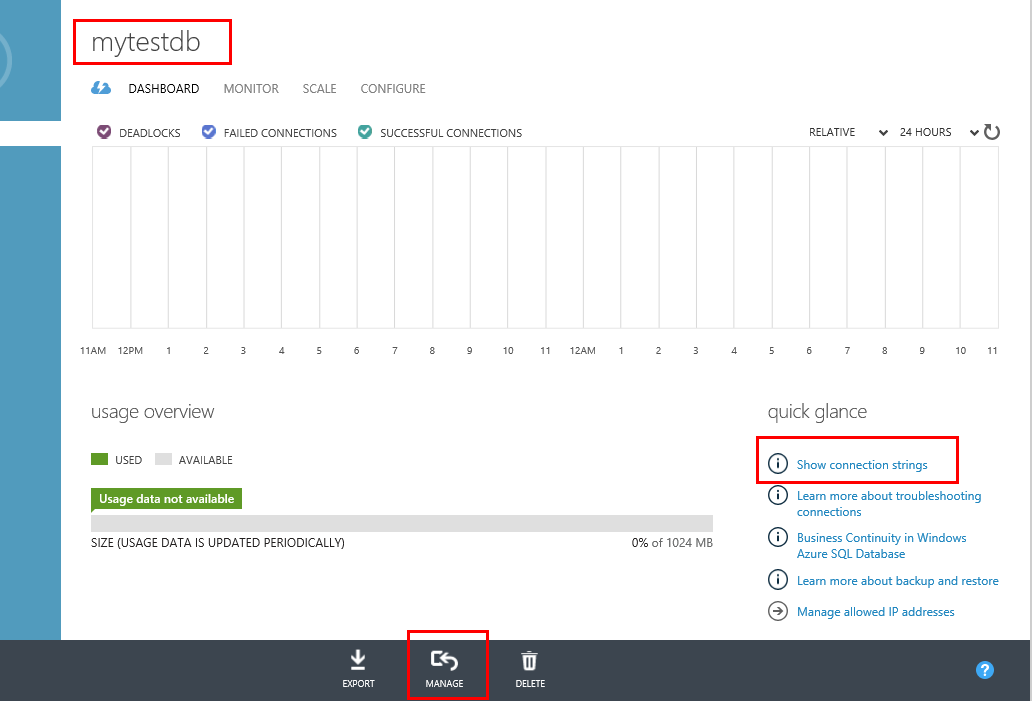
点击上方刚刚创建的SQL DataBase,选择DASHBORAD,点击下方的MANAGE按钮,进入SQL DataBase的管理界面。
注意:此处有一个Show Connection Strings的连接,后面开发过程中会用到其中的ADO.Net连接字符串。
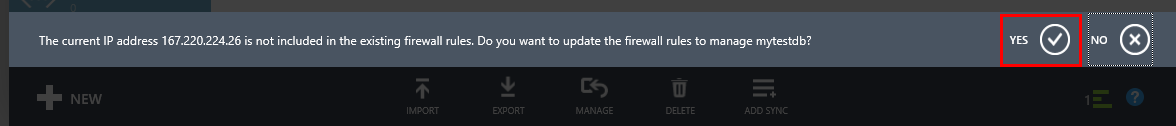
在弹出的提示框中,选择添加当前IP到SQL DataBase的白名单中
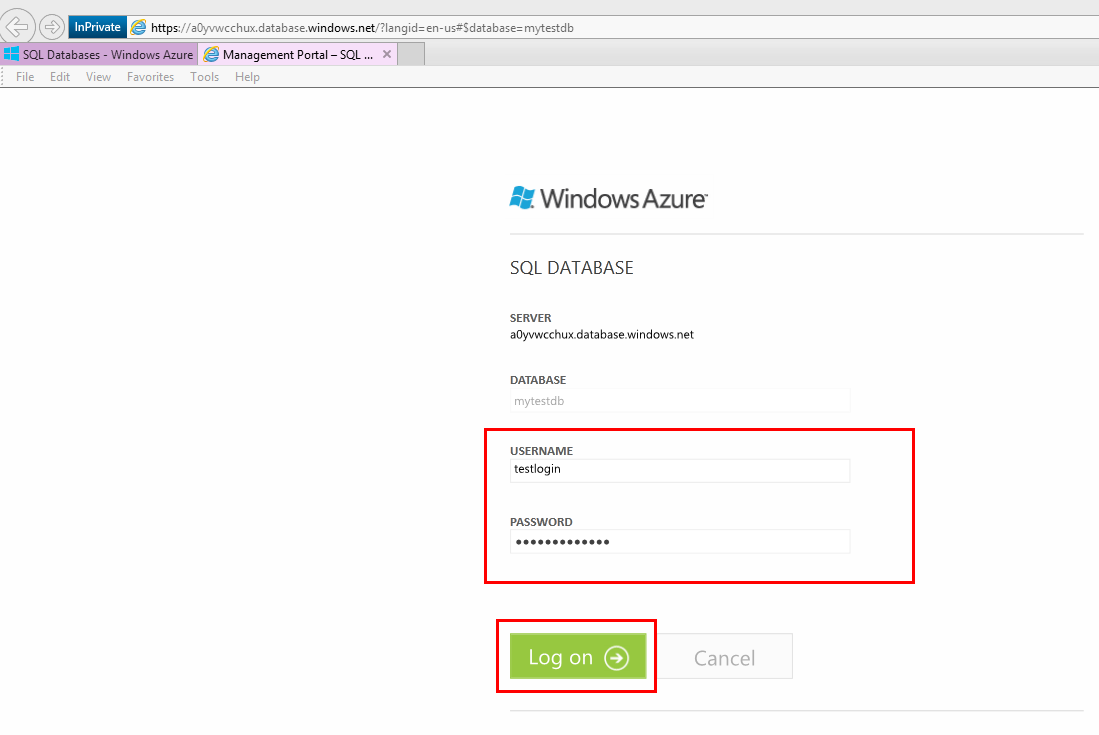
进入到SQL DataBase的登录页面,如图,使用刚刚创建的login帐号进行登录
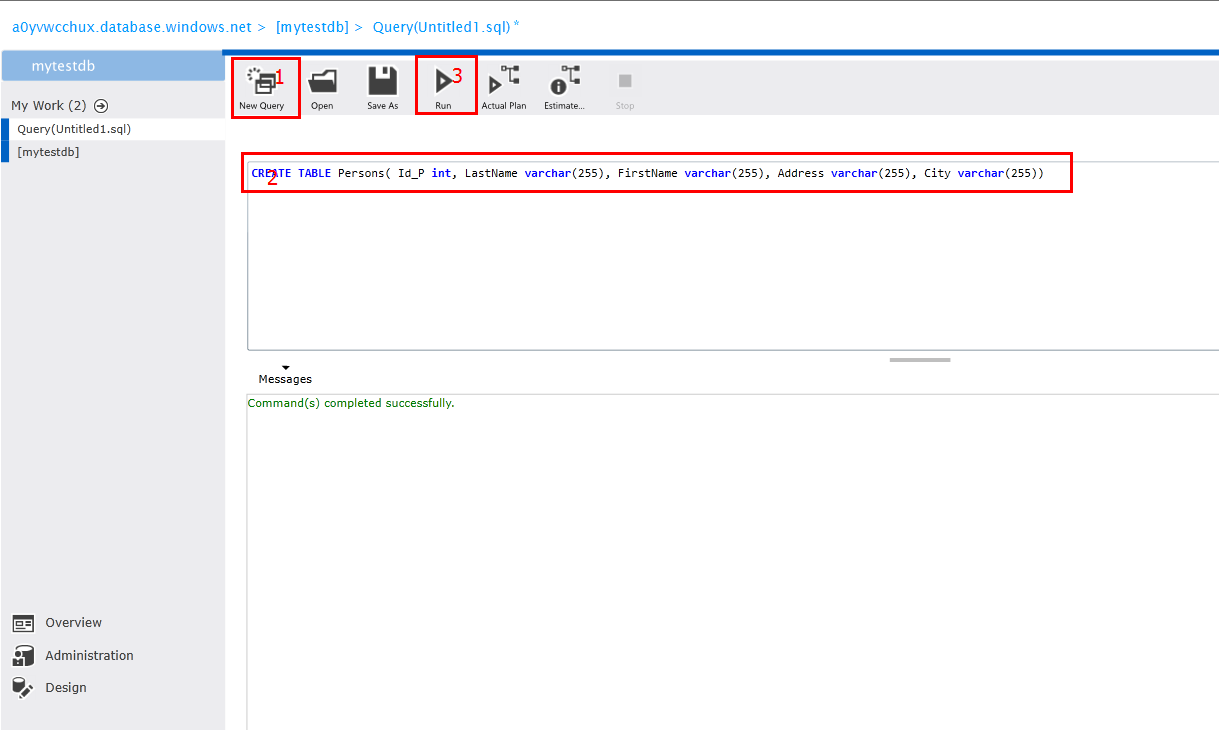
登录成功后,来到SQL DataBase管理界面,点击New Query,输入以下sql预计,点击按钮执行语句。
CREATE TABLE Persons( Id_P int primary key, LastName varchar(255), FirstName varchar(255), Address varchar(255), City varchar(255))
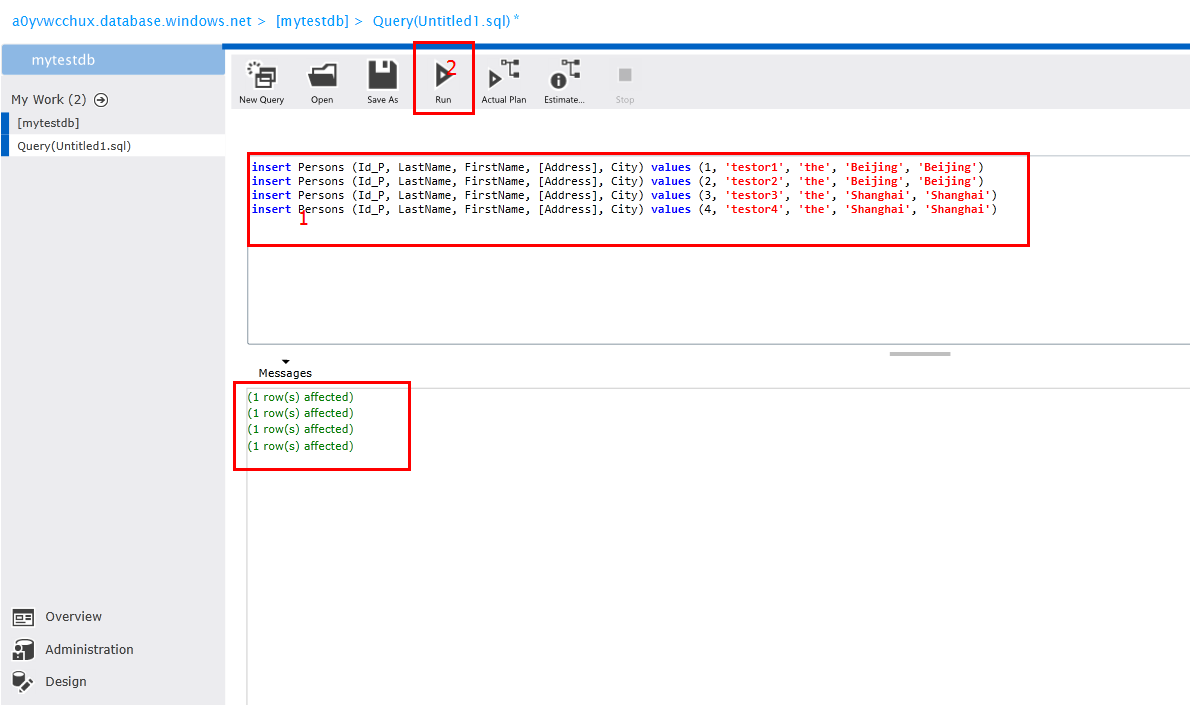
紧接着,执行几条insert语句,写入一些数据到刚刚创建的数据表中。
insert Persons (Id_P, LastName, FirstName, [Address], City) values (1, 'testor1', 'the', 'Beijing', 'Beijing')
insert Persons (Id_P, LastName, FirstName, [Address], City) values (2, 'testor2', 'the', 'Beijing', 'Beijing')
insert Persons (Id_P, LastName, FirstName, [Address], City) values (3, 'testor3', 'the', 'Shanghai', 'Shanghai')
insert Persons (Id_P, LastName, FirstName, [Address], City) values (4, 'testor4', 'the', 'Shanghai', 'Shanghai')
步骤二:创建Azure PaaS项目
以admin的方法打开Visual Studio
选择File --> Close Solution, 然后点击File,选择New,点击Project按钮,新建项目
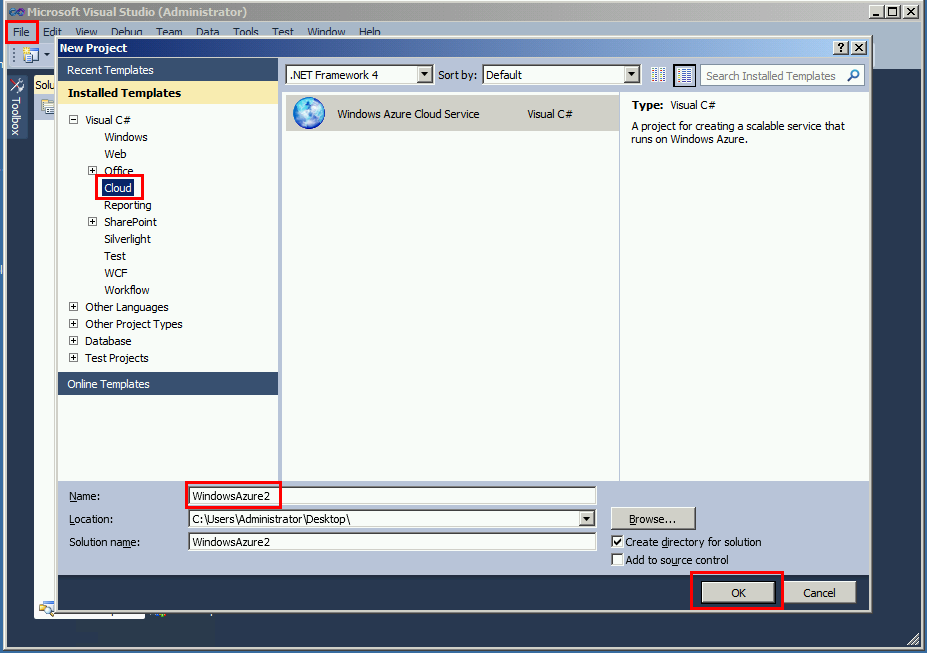
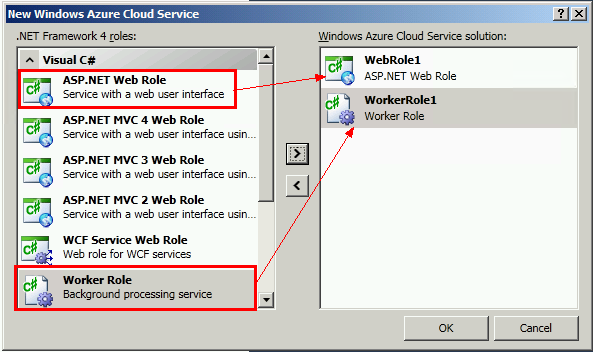
新项目中,如下图添加两个Role,点击OK完成新项目创建。
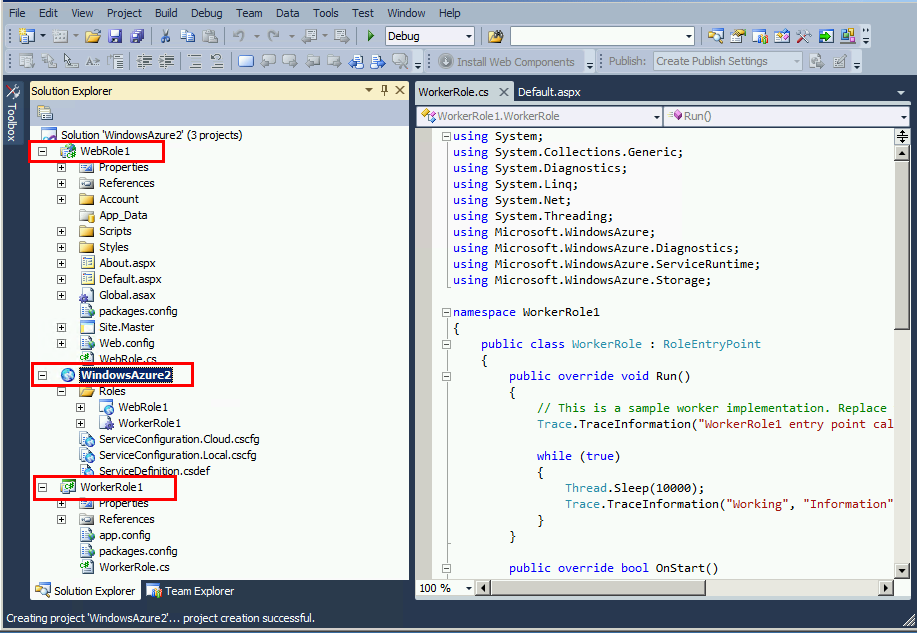
创建完的项目如图:
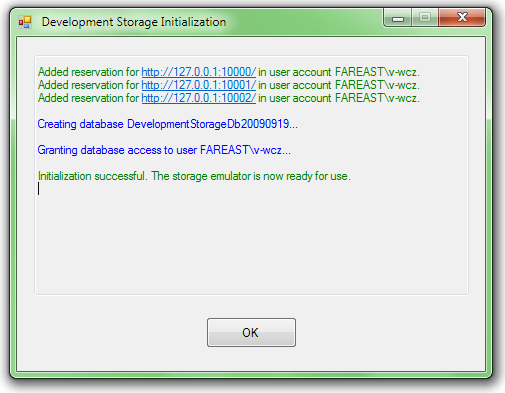
按F5键开始调试程序。如果你是第一次运行Windows Azure项目,你可能会见到Development Storage初始化的窗口,直接点击OK按钮:
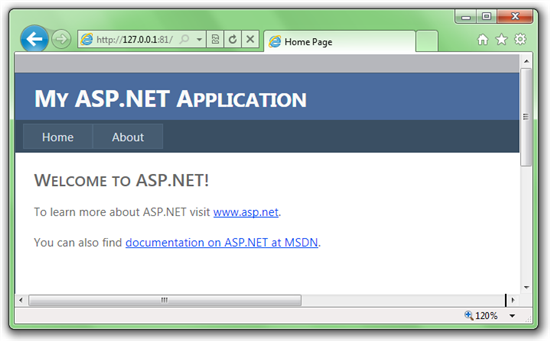
然后会见到下面的页面:
步骤三:配置Web Role中的Windows Azure Diagnostics
本步骤中的设置可以使用Visual Studio中的图形界面配置完成,如本文中的步骤七。但通过本节可以加深了解WAD配置的意义。
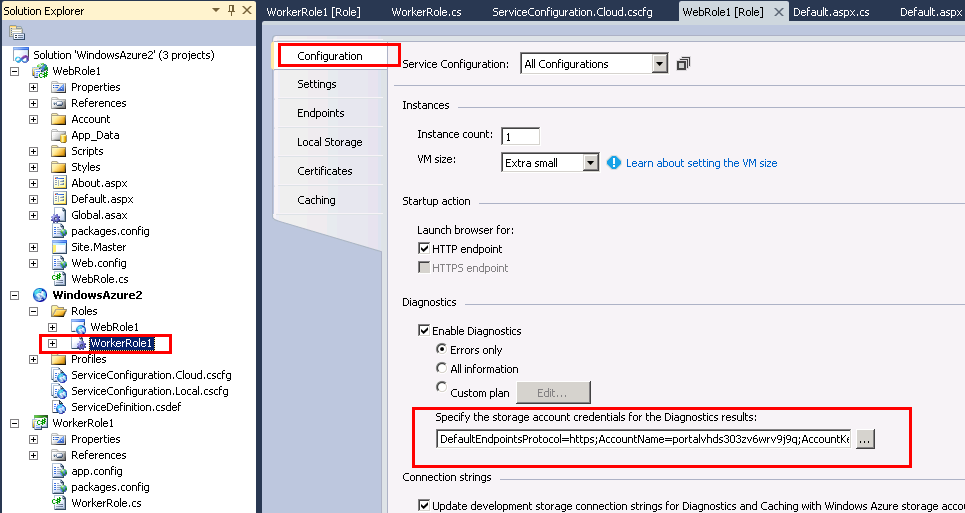
双击Azure项目中的WebRole1,选择配置页Configuration,点击按钮设置使用开发者已有的Windows Azure Storage帐号。
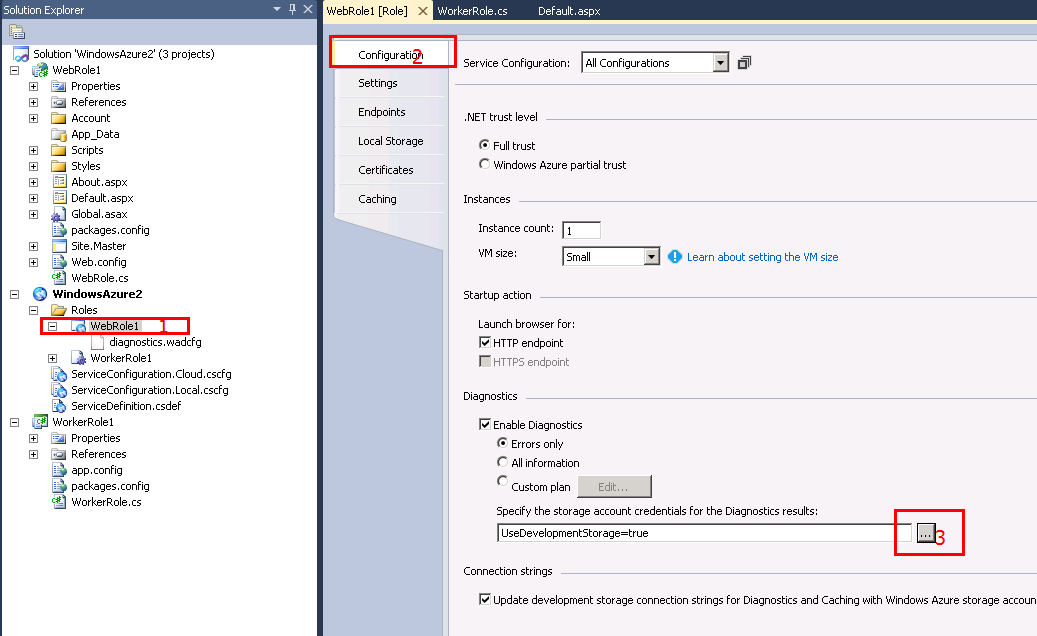
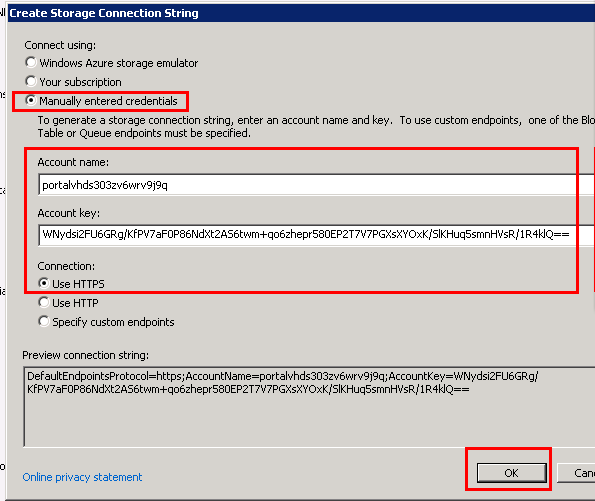
在弹出的WAS设定页面中,选择当前Azure帐号下的Storage帐号,或者手动输入已有的Windows Azure Storage信息
双击WebRole.cs文件,在OnStart函数中,添加以下代码:
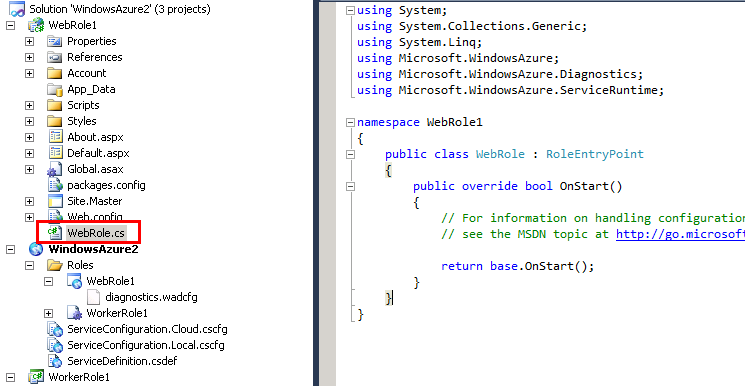
public override bool OnStart()
{
// For information on handling configuration changes
// see the MSDN topic at https://go.microsoft.com/fwlink/?LinkId=166357.
DiagnosticMonitorConfiguration dmConfig = DiagnosticMonitor.GetDefaultInitialConfiguration();
// Set an overall quota of 6GB.
dmConfig.OverallQuotaInMB = 6144;
// Add Azure logs to storage every x minutes.
TimeSpan tsLogXfer = TimeSpan.FromMinutes(2);
// Add System and Application Windows Event Logs to transfer every x minutes.
dmConfig.WindowsEventLog.DataSources.Add("System!*");
dmConfig.WindowsEventLog.DataSources.Add("Application!*");
TimeSpan tsEventLogXfer = TimeSpan.FromMinutes(2);
// Setup sample rate for performance counters.
TimeSpan perfSampleRate = System.TimeSpan.FromSeconds(60);
// Change to Error in production!
dmConfig.WindowsEventLog.ScheduledTransferLogLevelFilter = LogLevel.Verbose;
dmConfig.Logs.ScheduledTransferLogLevelFilter = LogLevel.Verbose;
dmConfig.PerformanceCounters.DataSources.Add(
new PerformanceCounterConfiguration()
{
CounterSpecifier = @"\Processor(_Total)\% Processor Time",
SampleRate = perfSampleRate
});
dmConfig.PerformanceCounters.DataSources.Add(
new PerformanceCounterConfiguration()
{
CounterSpecifier = @"\Memory\Available MBytes",
SampleRate = perfSampleRate
});
dmConfig.PerformanceCounters.DataSources.Add(
new PerformanceCounterConfiguration()
{
CounterSpecifier = @"\Memory\Committed Bytes",
SampleRate = perfSampleRate
});
dmConfig.PerformanceCounters.DataSources.Add(
new PerformanceCounterConfiguration()
{
CounterSpecifier = @"\ASP.NET Apps v2.0.50727(__Total__)\Requests Total",
SampleRate = perfSampleRate
});
dmConfig.PerformanceCounters.DataSources.Add(
new PerformanceCounterConfiguration()
{
CounterSpecifier = @"\ASP.NET Apps v2.0.50727(__Total__)\Requests/Sec",
SampleRate = perfSampleRate
});
dmConfig.PerformanceCounters.DataSources.Add(
new PerformanceCounterConfiguration()
{
CounterSpecifier = @"\ASP.NET v2.0.50727\Requests Queued",
SampleRate = perfSampleRate
});
dmConfig.PerformanceCounters.DataSources.Add(
new PerformanceCounterConfiguration()
{
CounterSpecifier = @"\ASP.NET v2.0.50727\Requests Rejected",
SampleRate = perfSampleRate
});
dmConfig.PerformanceCounters.DataSources.Add(
new PerformanceCounterConfiguration()
{
CounterSpecifier = @"\ASP.NET v2.0.50727\Request Execution Time",
SampleRate = perfSampleRate
});
dmConfig.PerformanceCounters.ScheduledTransferPeriod = tsEventLogXfer;
dmConfig.Logs.ScheduledTransferPeriod = tsLogXfer;
dmConfig.WindowsEventLog.ScheduledTransferPeriod = tsEventLogXfer;
// Start up the diagnostic manager with the given configuration.
try
{
DiagnosticMonitor.Start("Microsoft.WindowsAzure.Plugins.Diagnostics.ConnectionString", dmConfig);
}
catch (Exception exp)
{
// Handle any exceptions
}
return base.OnStart();
}
选择Azure项目中的servicedefinition.csdef文件,在WebRole配置节中添加以下配置:
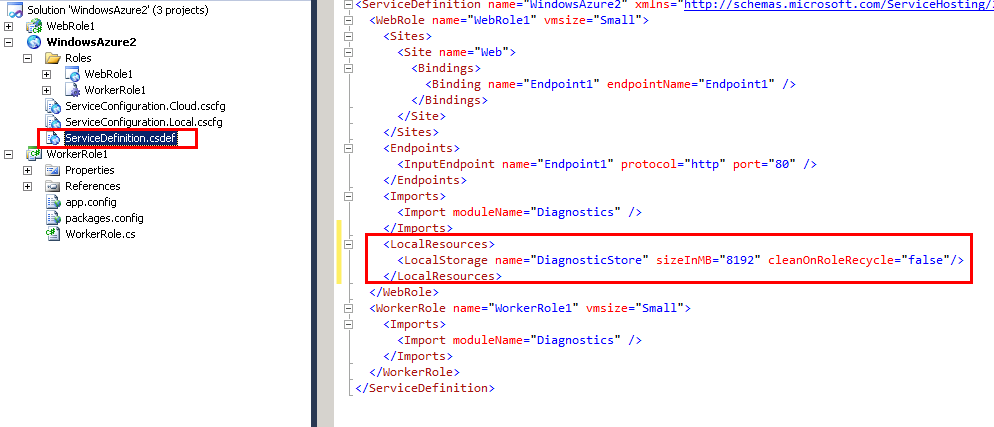
<LocalResources>
<LocalStorage name="DiagnosticStore" sizeInMB="8192" cleanOnRoleRecycle="false" />
</LocalResources>
步骤四:配置Worker Role中的Windows Azure Diagnostics
本步骤中的设置可以使用Visual Studio中的图形界面配置完成,如本文中的步骤七。但通过本节可以加深了解WAD配置的意义。
同步骤三,双击Azure项目中的workerrole1,选择Configuration,指定已有的Windows Azure Storage,供后续worker role存储diagnostics的输出日志。
然后,展开Azure项目中的WorkerRole1,双击文件diagnostics.wadcfg,在文件中贴入以下内容,完成后Ctrl+S保存整个工程。
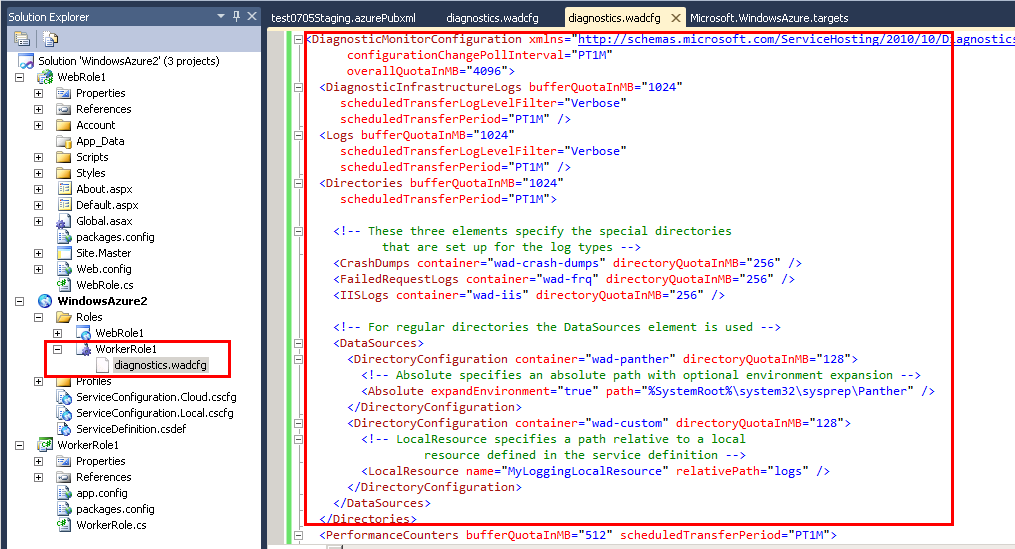
<DiagnosticMonitorConfiguration configurationChangePollInterval="PT1M" overallQuotaInMB="4000" xmlns="https://schemas.microsoft.com/ServiceHosting/2010/10/DiagnosticsConfiguration">
<DiagnosticInfrastructureLogs />
<Logs />
<PerformanceCounters bufferQuotaInMB="512" scheduledTransferPeriod="PT1M">
<PerformanceCounterConfiguration counterSpecifier="\Processor(_Total)\% Processor Time" sampleRate="PT5S" />
<PerformanceCounterConfiguration counterSpecifier="\Memory\Available MBytes" sampleRate="PT1S" />
<PerformanceCounterConfiguration counterSpecifier="\Memory\Committed Bytes" sampleRate="PT1S" />
</PerformanceCounters>
<WindowsEventLog bufferQuotaInMB="512" scheduledTransferPeriod="PT1M" scheduledTransferLogLevelFilter="Verbose">
<DataSource name="System!*" />
</WindowsEventLog>
</DiagnosticMonitorConfiguration>
步骤五:本地开发、调试程序
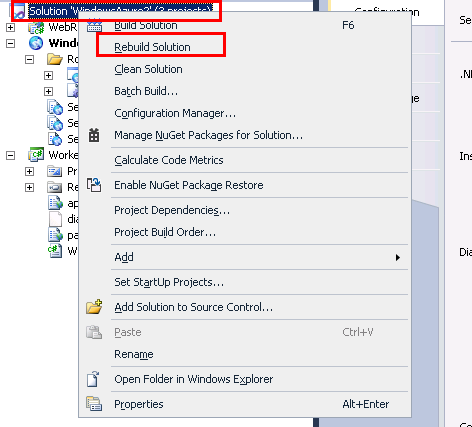
选中解决方案,右键 --> Rebuild Solution, 确认编译正常。
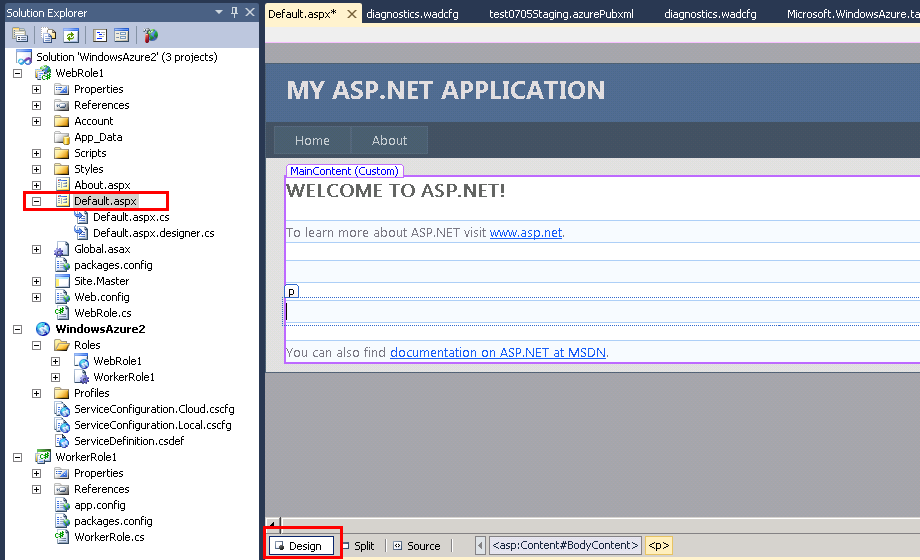
在Visual Studio中的solution explorer中双击web role项目中的Default.aspx,然后选择Design模式,如图
选择Visual Stuio菜单栏中的View --> Toolbox,得到如下视图:
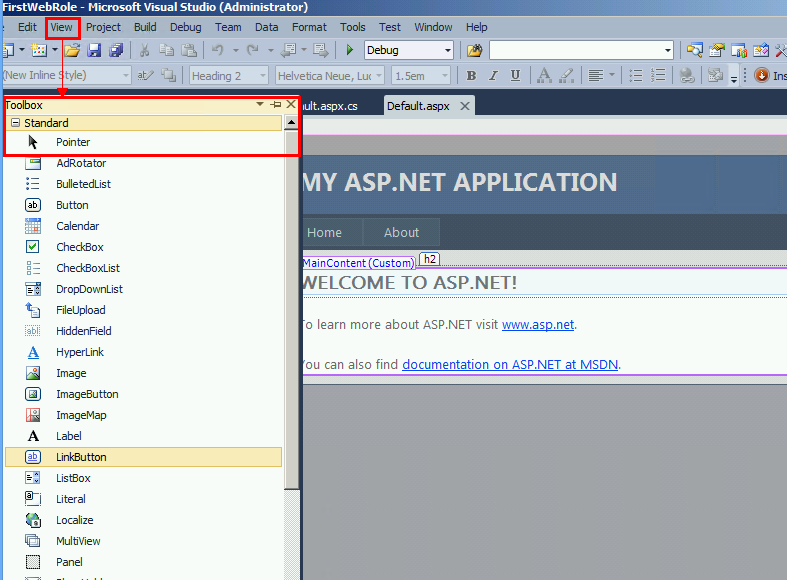
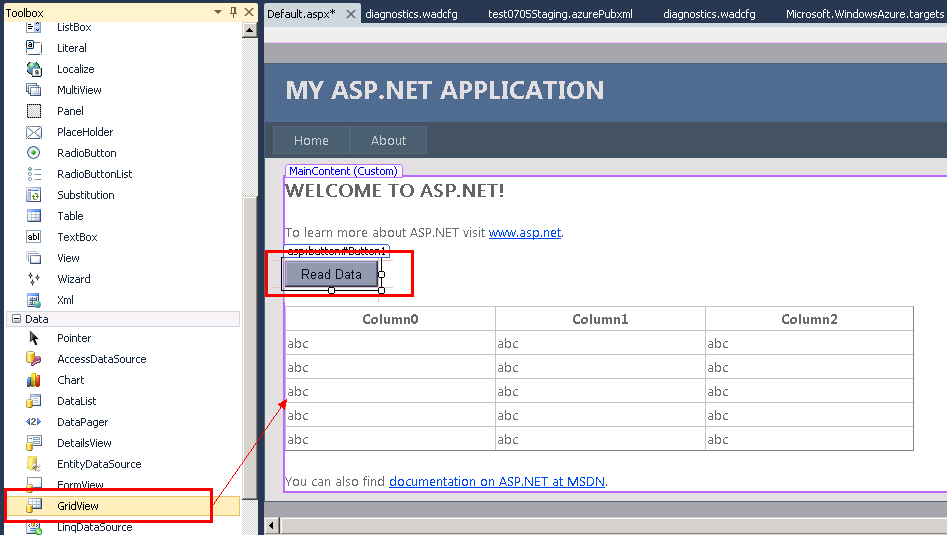
拖拽一个Button按钮和一个GridView到Default.aspx页面中,选择拖进来的Button,可以修改其显示的文字为Read Data
双击添加进来的Button按钮,进入代码页面,加入以下代码,其中连接字符串部分从上述步骤二中可得,注意修改使用之前创建的longin用户名密码。
using System.Data;
using System.Data.SqlClient;
protected void Button1_Click(object sender, EventArgs e)
{
SqlDataReader sqldr = null;
SqlConnection cn = new SqlConnection("Server=tcp:a0yvwcchux.database.windows.net,1433;Database=mytestdb;User ID=testlogin@a0yvwcchux;Password=test@123;Trusted_Connection=False;Encrypt=True;Connection Timeout=30;");
//cn = new SqlConnection("Data Source=o0f1x8t1wt.database.windows.net;database=FizTradeProduction;user=digitalMetals;password=DigitalGold1;Connect Timeout=30;Encrypt=false;");
SqlCommand cmd = new SqlCommand("select * from Persons", cn);
//try to connect and read data
Console.WriteLine("try to connect and read data...");
try
{
cmd.Connection.Open();
}
catch (Exception ex)
{
Console.WriteLine(ex.Message);
Console.Read();
}
Console.WriteLine("connected.");
//Console.Read();
sqldr = cmd.ExecuteReader(CommandBehavior.CloseConnection);
DataTable dt = new DataTable();
dt.Load(sqldr);
cmd.Connection.Close();
this.GridView1.DataSource = dt;
this.GridView1.DataBind();
}
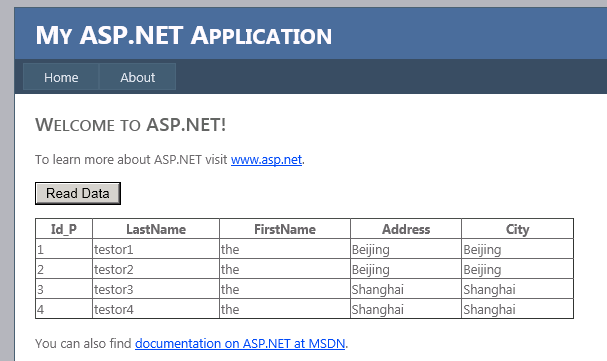
F5启动本地运行模式,得到如下网页,点击Read Data按钮,读取SQL Database内容。
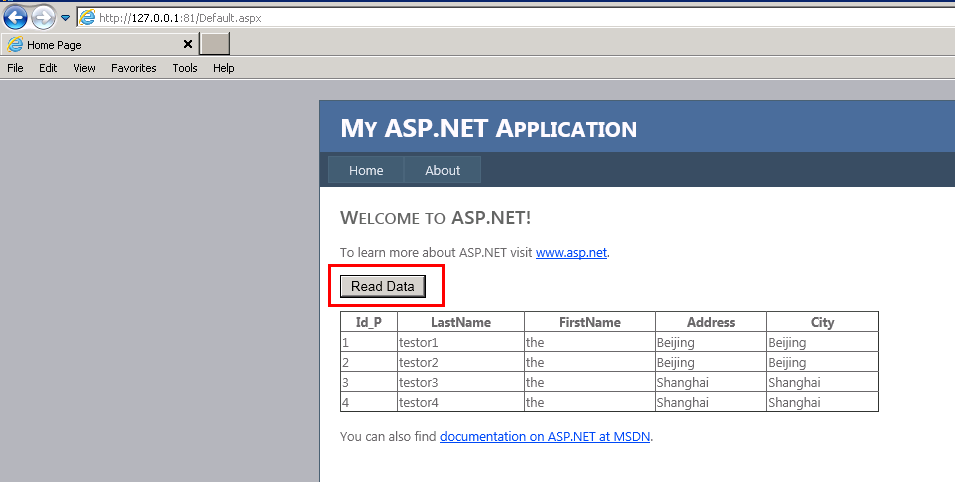
至此,已完成本地开发调试。
步骤六:发布云服务
在Visual Studio中点击上方图标或使用“Shift+F5”快捷键关闭上述正在运行的程序。
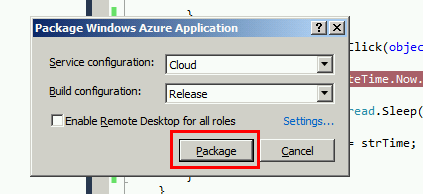
右键选中Azure项目,如WindowsAzure2项目,选择Package
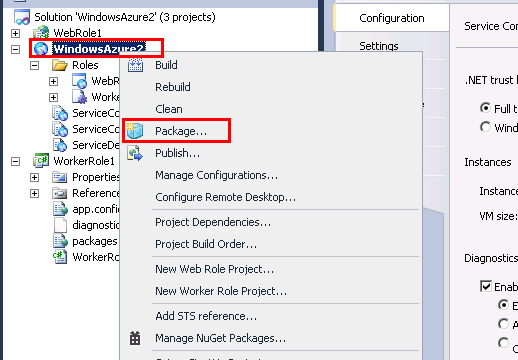
使用默认设置,直接选中Package
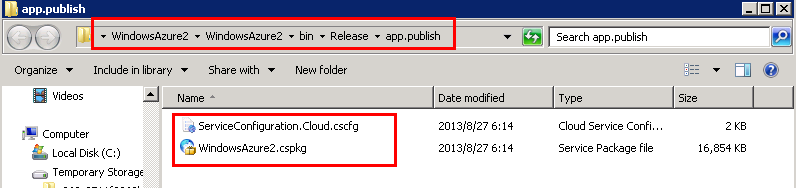
稍等片刻,项目打包(Package)就会完成,即时自动弹出项目发布包所在目录,如图,记录该存储地址。
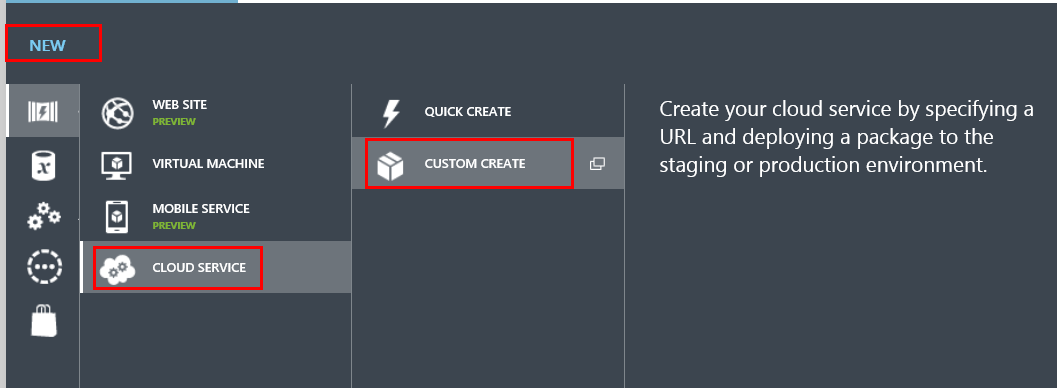
回到Azure管理主页https://manage.windowsazure.com, 登录后,选择New --> Compute -->Cloud Service --> Custom Create
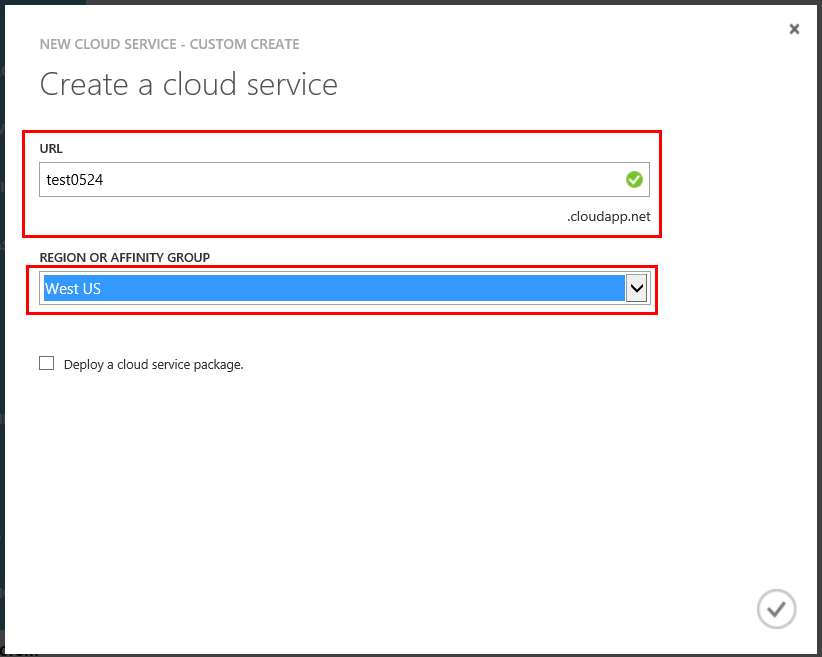
设定你将使用的域名,如test0524,并选定你要使用的数据中心,点击完成。
稍等片刻,云服务空间(托管服务)即创建完成,如图,
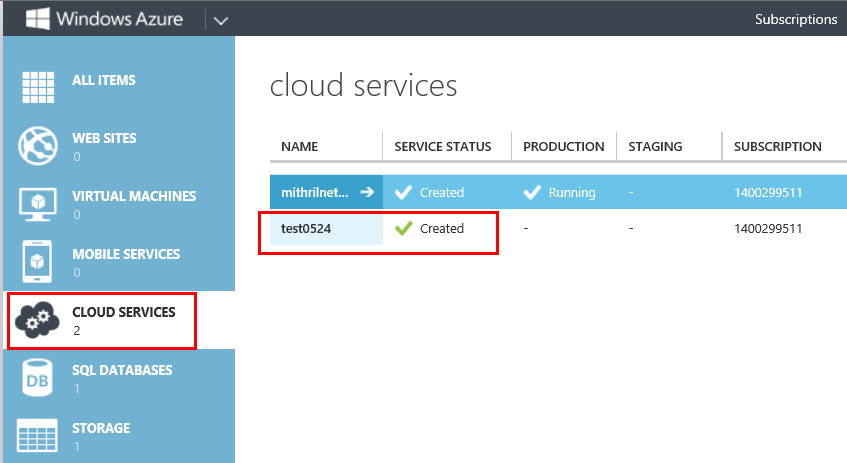
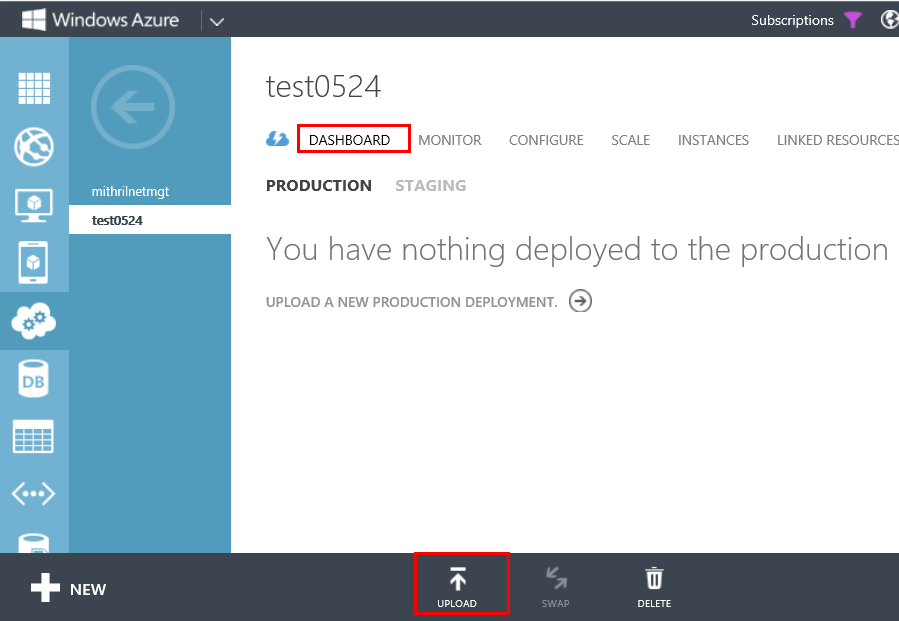
点击test0524托管服务,进入下图,选择Upload
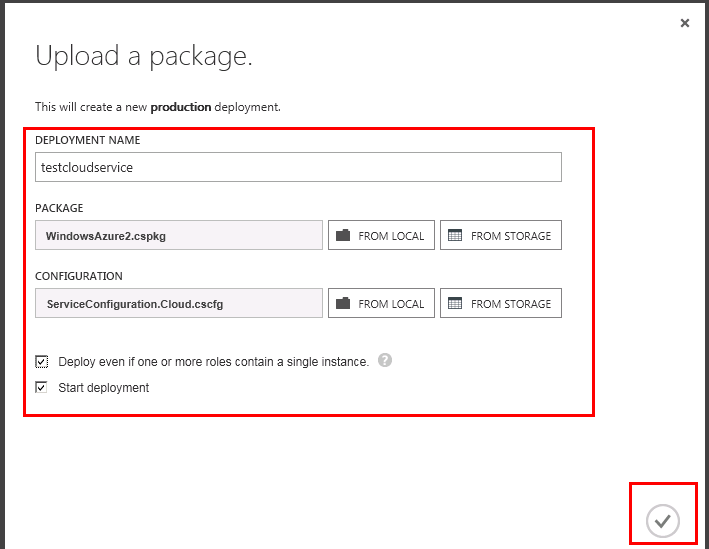
在弹出的Upload页面中,输入这次发布包的名称,选择刚刚创建的云服务发布包文件,选中下面两个勾选项,点击确认完成按钮开始发布。
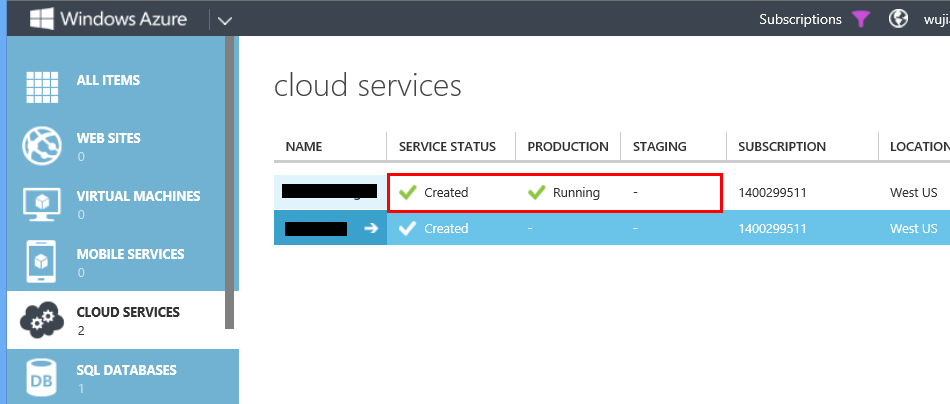
稍等片刻,发布成功后,在管理主页中,你会看到状态栏显示Running
打开IE,输入https://test0524.cloudapp.net, 你将可以访问你发布到internet上的云服务。(此处test0524.cloudapp.net 需要更换成你在步骤五中设定的云服务名称)
步骤七:分析WAD日志
发布成功后,通过××.cloudapp.net访问该云服务。如图
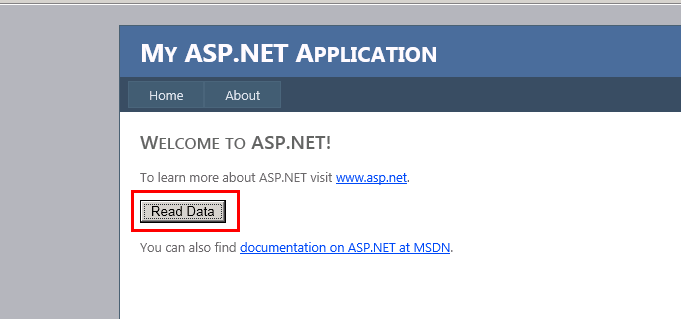
点击Read Data按钮后,得到
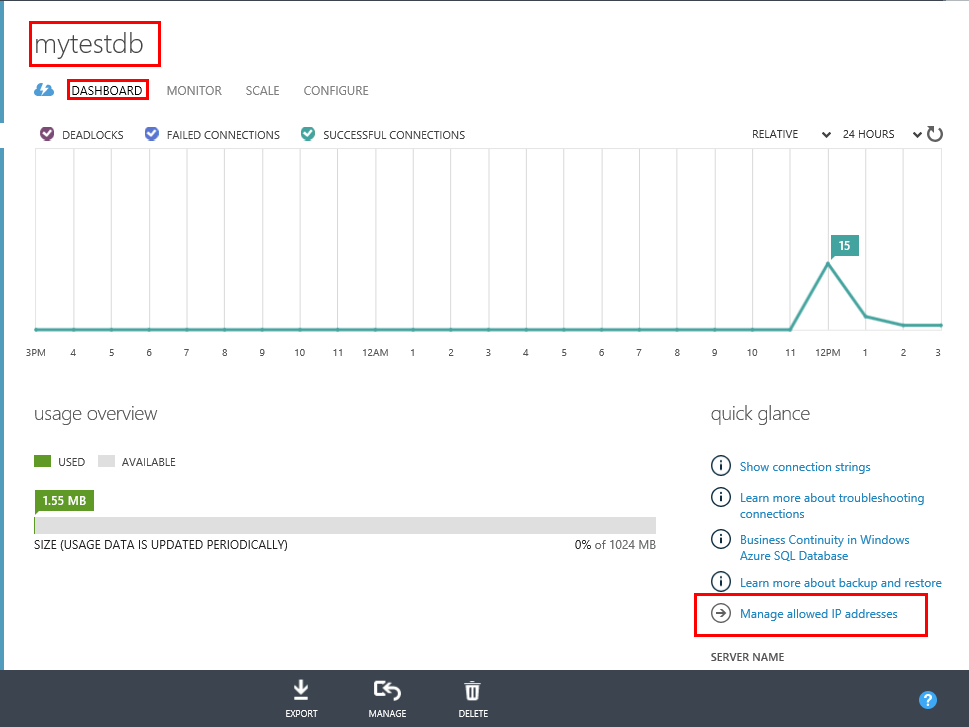
回到Azure Portal上的SQL Database管理页面,选择之前创建的数据库,并选中DASHBOARD页。
点击右侧的Manage Allowed IP addresses链接。
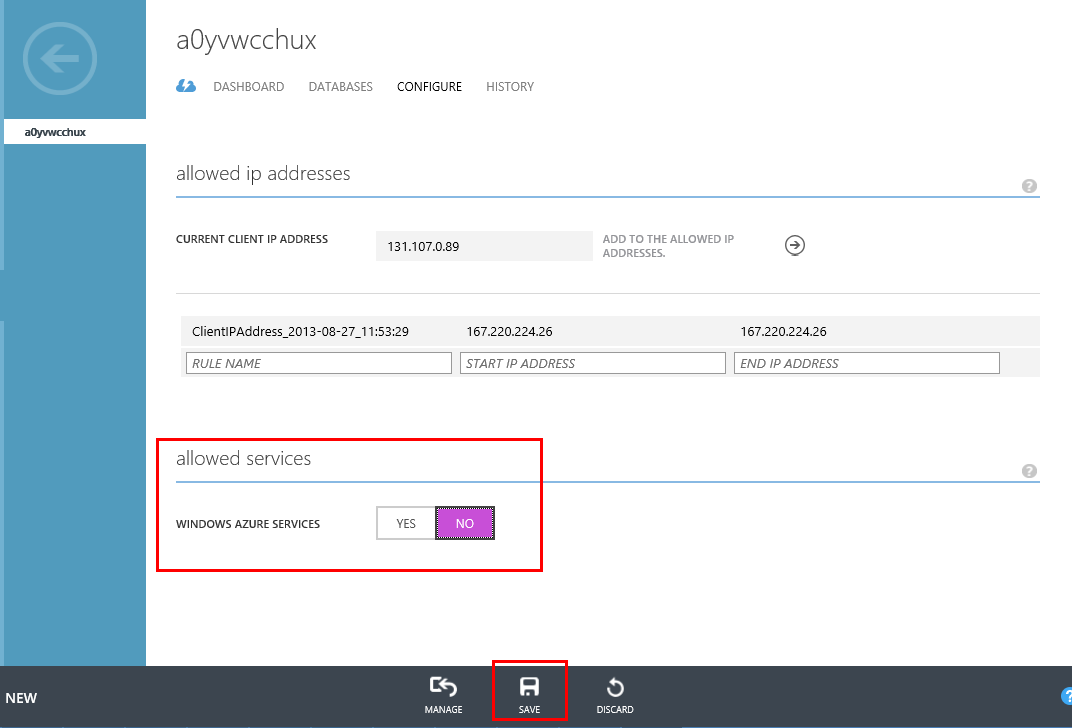
在弹出的页面中,设置Allowed Services为No,并点击SAVE按钮保存。
稍等片刻(约10分钟)后继续访问云服务,并点击Read Data按钮,得到以下页面:
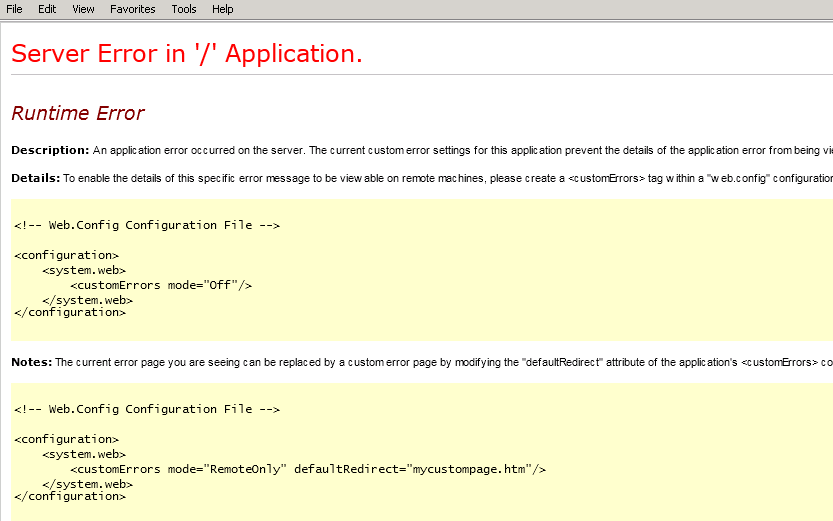
接下来,我们尝试从WAD和远程桌面两方面来寻找问题的原因:
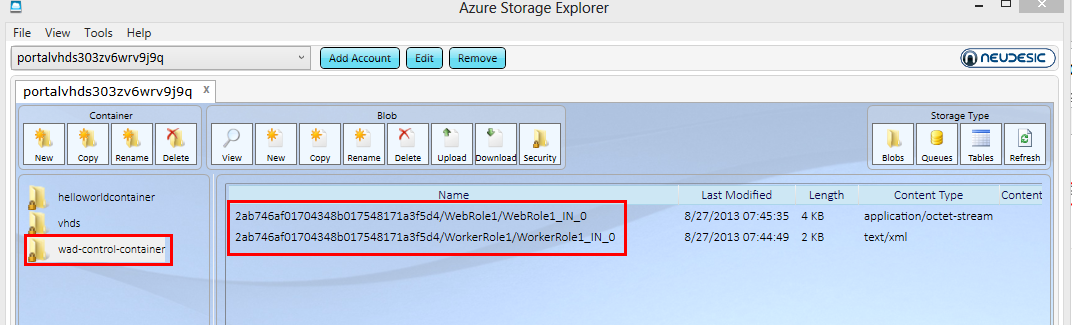
使用Azure Storage Explorer工具,查看Diagnostics绑定的Azure Storage帐号,可以看到,在Container下生成了两个新的文件,该文件即是WAD的原始配置。
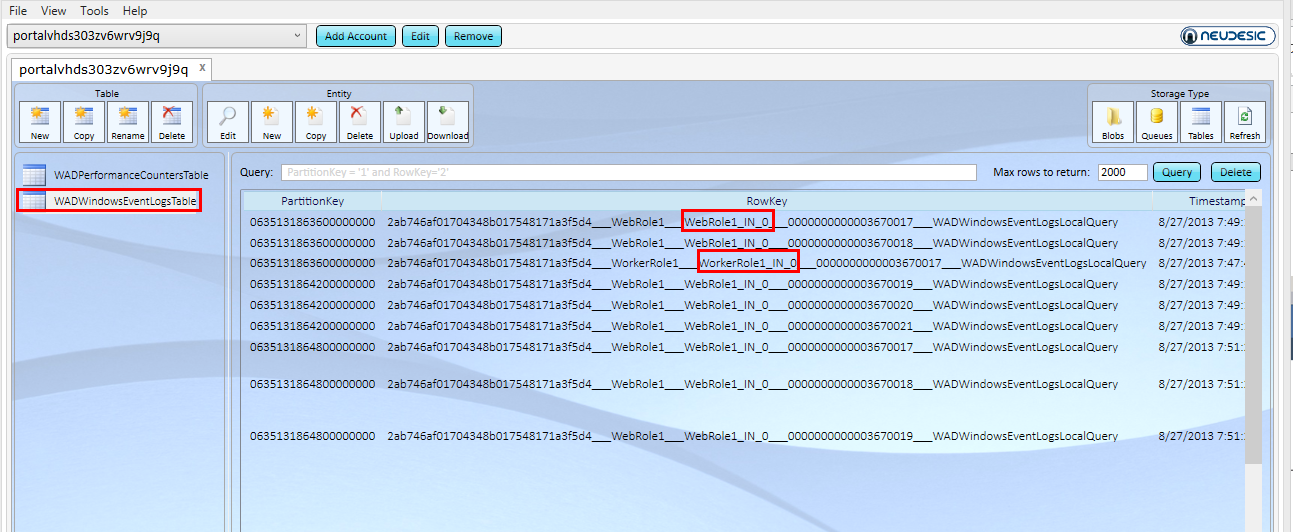
在Table Storage中,可以进一步看到WAD输出的详细日志:
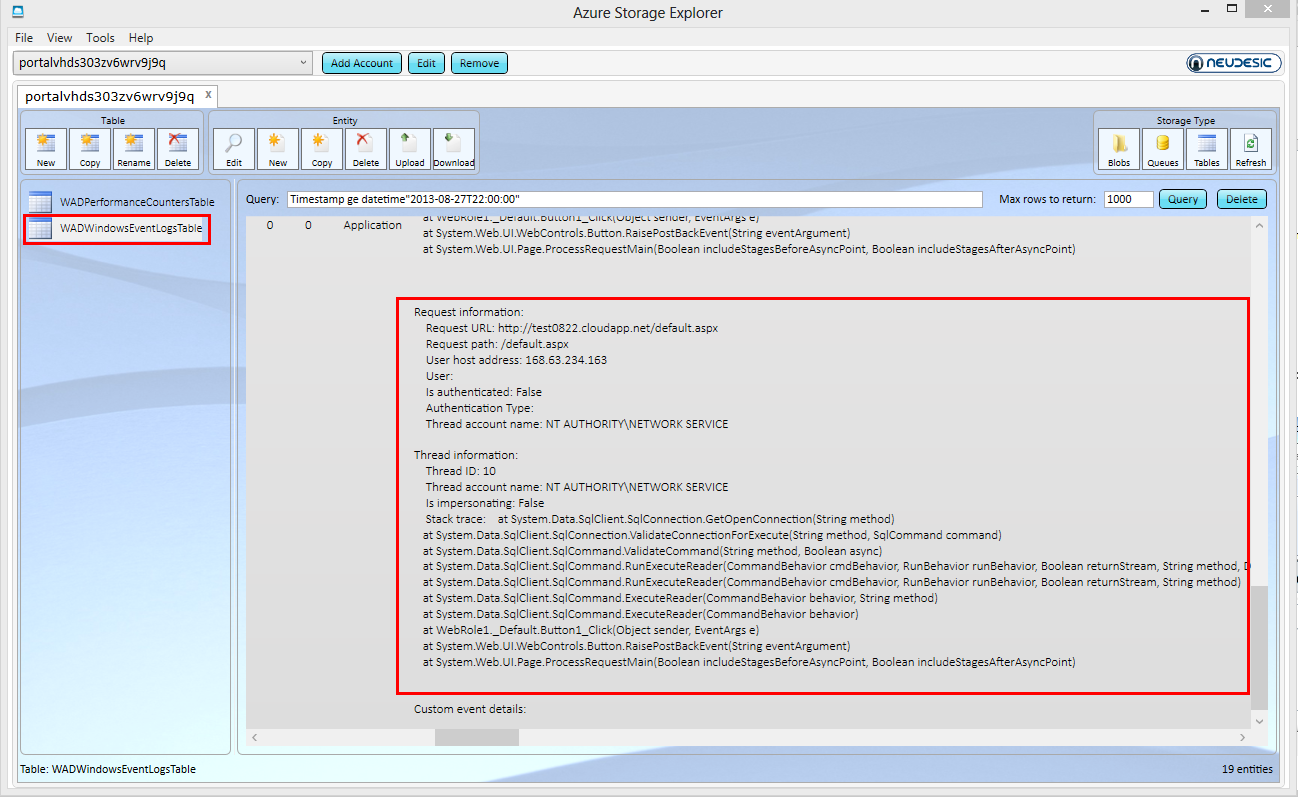
仔细查询Table Storage,可以发现刚才发生的错误日志,其由SQL连接导致。
注意,table storage可以通过query语句查询,如
DeploymentId eq "3d0cfb92e72c461db28747963d807d35" and RoleInstance eq "WebRole_IN_0" and Timestamp ge datetime"2013-05-04T22:00:00"
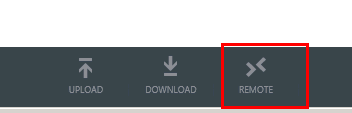
进一步,通过Azure Portal启动该云服务的Remote功能。(Portal --> Cloud Services --> 目标 cloud service --> Configure 页 --> Remote 按钮)
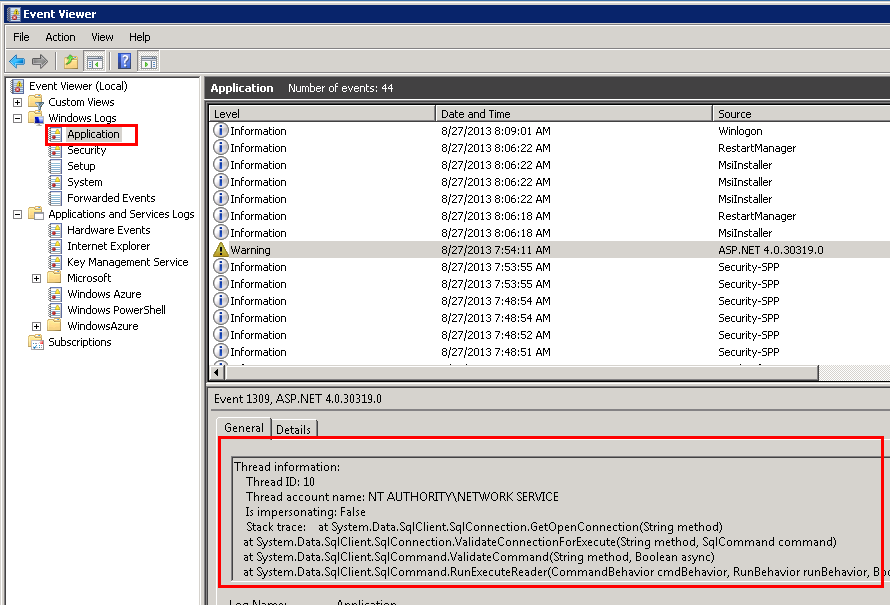
启动后,RDP进入web role对应的虚机,在Start --> All Programs --> Event Viewer –> Windows Logs –> Application中可以得到之前的错误对应的日志。
至此,WAD和REMOTE调试证明了其能够给予开发强大的支持。
同时,在Remote基础上,通过本地调试web,也可以通过IIS重现、debugview、windbg等捕捉到更详细的错误信息。后续实践中会涉及。
步骤七: WAD(Windows Azure Diagnostics)深入应用
Windows Azure Diagnostics功能提供良好的服务跟踪和调试支持,除了上述直接编写代码或者配置文件之外,开发者还可以借助Visual Studio工具进行快速的自定义配置,并且开发者还可以在配置中加入自己指定需要监控的文件夹内容。
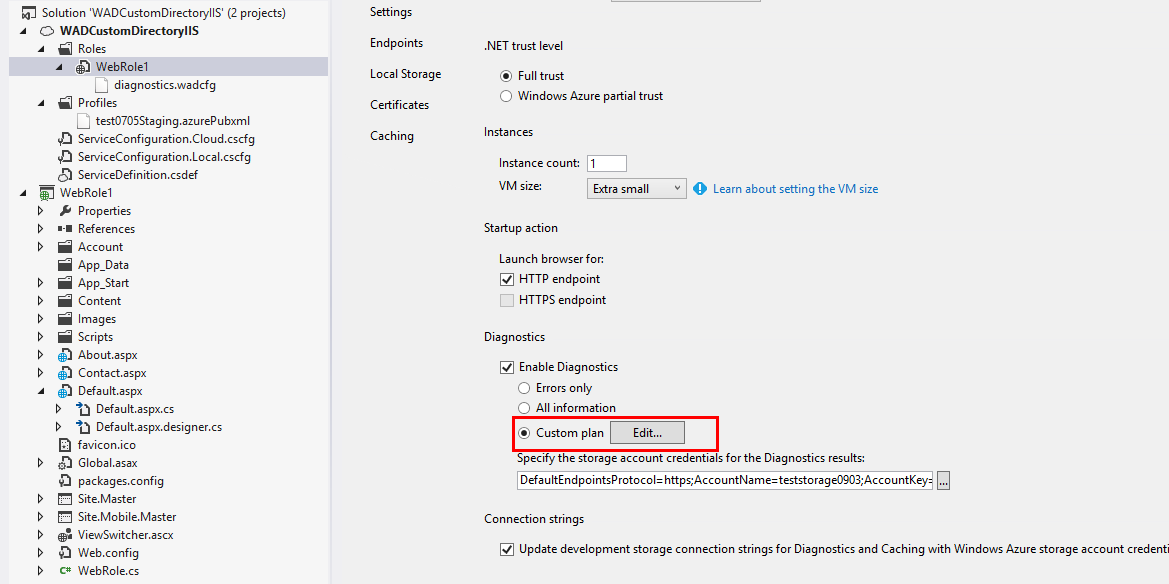
如图所示,配置完WAD使用的Windows Azure存储账号之后,开发者可以在Visual Studio界面上看到“Custom plan”选项,单击旁边的“Edit”按钮即可以通过界面工具设定Windows Azure Diagnostics将要监控的诊断项。
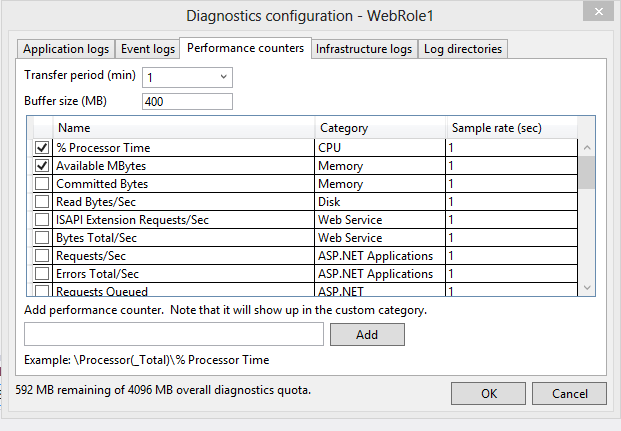
在弹出的编辑界面中,开发者可以选择Windows Azure Diagnostics是否收集各类诊断信息,设定完之后,单击“OK”按钮保存,即可以看到生成的diagnostics.wadcfg文件。此处生成的配置和上一节手动添加diagnostics.wadcfg配置的效果一样(见下图)。
需要指出的是“Log directories”部分,默认该处仅有两项设置,“IIS logs”表示WAD将收集云端虚拟机中的IIS log并按照规定时间转存到WAS Blob存储中;Crash dumps表示WAD将收集云端虚拟机内产生的Dump文件并转存至WAS。
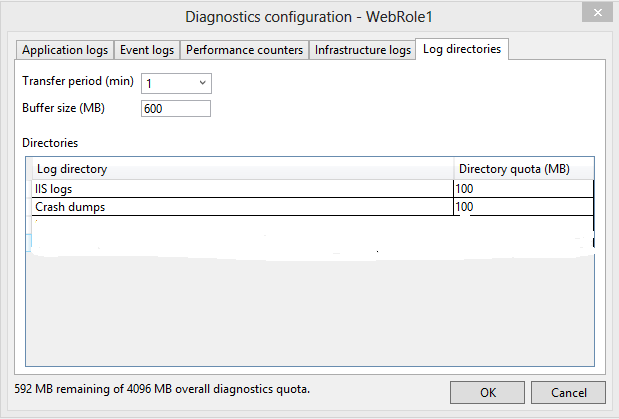
如果开发者的托管服务有自定义的日志输出文件,考虑到托管服务的“无状态”特性,托管服务如果直接将日志写在本地虚拟机中,虽然写入效率比较高,但是不能保证永久性存储。此种场景下,就需要在WAD中定义新的针对目录监控诊断项,自定义文件夹(Log Directory)不可以在上面的界面工具中设定,需要打开生成的diagnostics.wadcfg文件,自行添加。示例如下:
<Directories bufferQuotaInMB="600" scheduledTransferPeriod="PT1M">
<IISLogs container="wad-iis-logfiles" directoryQuotaInMB="100" />
<CrashDumps container="wad-crash-dumps" directoryQuotaInMB="100" />
<DataSources>
<DirectoryConfiguration container="wad-customerlog1" directoryQuotaInMB= "128">
<Absolute path="C:\Logs" expandEnvironment="false" />
</DirectoryConfiguration>
<DirectoryConfiguration container="wad-customlog2" directoryQuotaInMB= "128">
<Absolute path="[MyLocalResource]\logs" expandEnvironment="false" />
</DirectoryConfiguration>
</DataSources>
</Directories>
该处默认选项为IISLogs和CrashDumps,表示WAD将监测IIS输出日志和云端虚拟机托管服务发生异常而产生的Dump文件,并将其转存到WAS指定的容器中。添加的两个诊断项,分别监测绝对目录C:\Logs和托管服务创建的本地存储空间C:\Resources\Directory\ {DeploymentID}. {Rolename}.MyLocalResource\logs,并将这两个目录下的数据转移到WAS存储容器wad-customerlog1(2)中。
若在云端应用程序中通过代码输出临时文件,如下所示,则输出的数据将被WAD转移到指定的WAS存储空间中。
protected void Button1_Click(object sender, EventArgs e)
{
string rootPath = RoleEnvironment.GetLocalResource("MyLocalResource"). RootPath;
//write something into a file located in local storage
System.IO.File.AppendAllText(rootPath + "/logs/test.txt", DateTime.Now. ToString());
TextBox1.Text = "done in " + rootPath + "/logs/test.txt " + DateTime.Now. ToString();
//output some information for the app
System.Diagnostics.Trace.WriteLine(DateTime.Now.ToString() + " : [tracelog] I am clicked");
this.TextBox1.Text = DateTime.Now.ToString() + " : [tracelog] I am clicked";
}
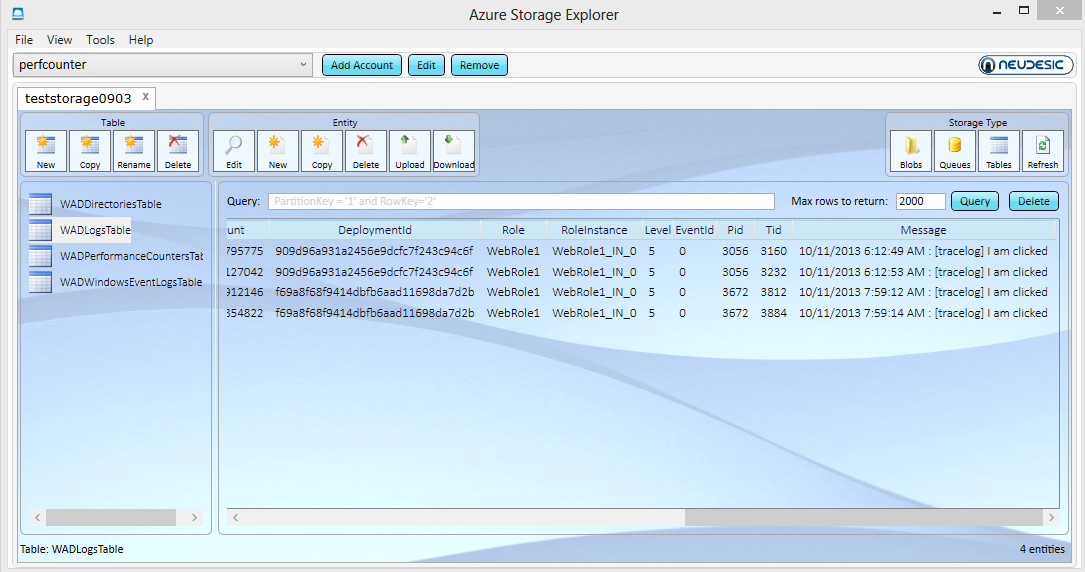
在Table Storage中可以看到应用程序输出的日志,如图所示。
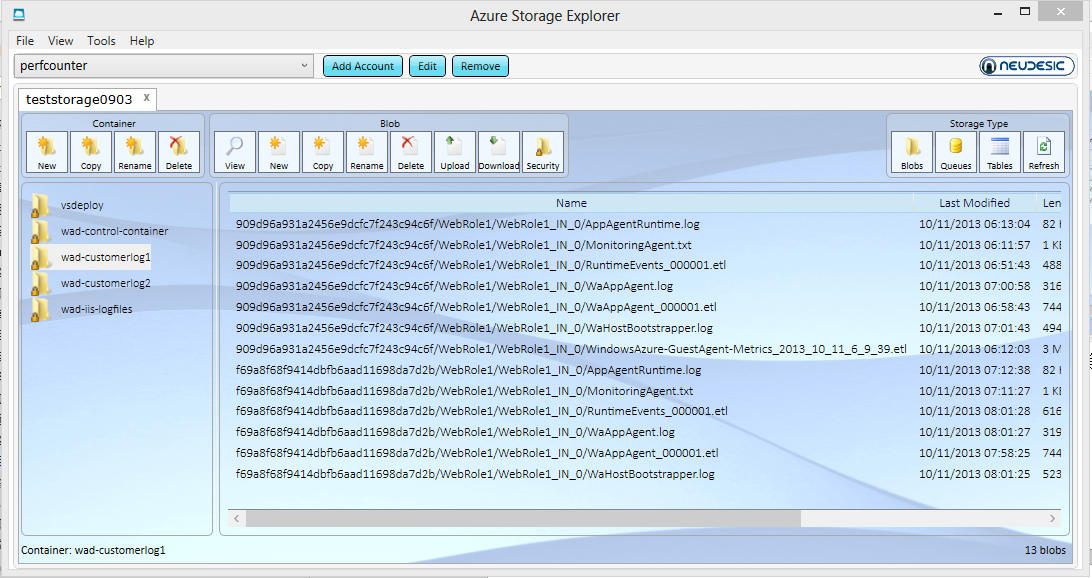
在Blob Storage中可以看到自定义保存的日志文件和IIS日志等内容,如图所示。
因此,通过Visual Studio中界面化的WAD设定以及自定义诊断项配置,开发者在使用Windows Azure Diagnostics时更为快捷和灵活。