Ask Learn
Preview
Ask Learn is an AI assistant that can answer questions, clarify concepts, and define terms using trusted Microsoft documentation.
Please sign in to use Ask Learn.
Sign inThis browser is no longer supported.
Upgrade to Microsoft Edge to take advantage of the latest features, security updates, and technical support.
Note
Access to this page requires authorization. You can try signing in or changing directories.
Access to this page requires authorization. You can try changing directories.
Say for example you are troubleshooting a high CPU or a slow response or a hang issue. For diagnostics collect the following from the server side:
FREB
To configure FREB traces, go to IIS Manager, select your Web Site (hosting your WCF Services). On the right hand pane under Actions there is a Configure section; click Failed Request Tracing…
The trace should be enabled. See screen shot below: 
From the center pane, click at Failed Request Tracing… as shown below: 
Click Add… as shown below and follow the dialog box. 
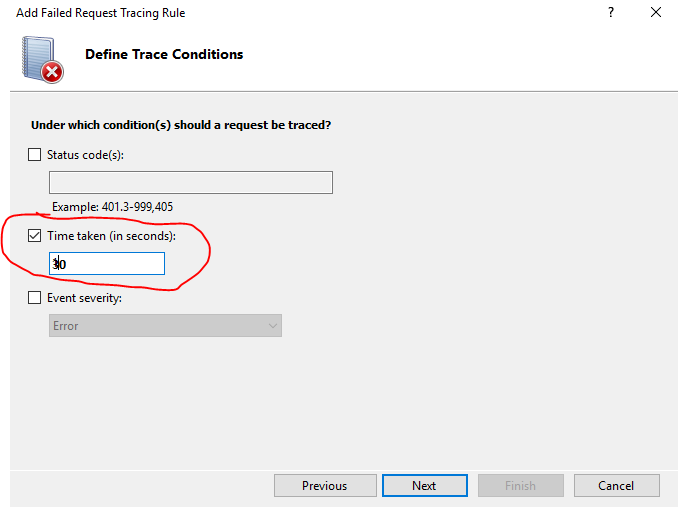
If you want to track by time, set it by checking Time taken and click Next. See screen shot below.
Alternatively (check any one, not both) you can track by Status code(s) , with values 200-999 & click Next to continue. See screen shot below. 
Click at Finish as shown in the dialog below. Please note: IIS reset is not required. 
For PerfView & Debug Diagnostic steps see: https://blogs.msdn.microsoft.com/dsnotes/2016/12/30/capturing-full-user-mode-dumps-perfview-traces-for-troubleshooting-high-cpu-hang-issues/
WCF & System.Net tracing
Here is an example of a web.config file with WCF & System.Net tracing enabled. You need to integrate the sections highlighted in yellow within the correct sections highlighted in cyan.
You can directly use it on your web.config. In initializeData (see below), kindly set the correct path.
 <?xml version="1.0" encoding="UTF-8"?>
<configuration>
 <system.diagnostics>
    <sources>
       <source name="System.Net" switchValue="Verbose">
            <listeners>
                <add name="SystemNetTrace"/>
           </listeners>
       </source>
      <source name="System.ServiceModel" switchValue="Verbose, ActivityTracing" propagateActivity="true">
        <listeners>
          <add name="wcftrace" />
       </listeners>
      </source>
      <source name="System.ServiceModel.MessageLogging" switchValue="Verbose, ActivityTracing">
        <listeners>
          <add name="wcfmessages" />
        </listeners>
      </source>
      <source name="System.Runtime.Serialization" switchValue="Verbose">
        <listeners>
          <add name="wcfmessages" />
        </listeners>
      </source>
   </sources>
   <sharedListeners>
      <add name="SystemNetTrace" type="System.Diagnostics.TextWriterTraceListener" traceOutputOptions="LogicalOperationStack, DateTime, Timestamp, Callstack" initializeData="C:\Traces\System_Net.txt" />
      <add name="wcftrace" type="System.Diagnostics.XmlWriterTraceListener" traceOutputOptions="LogicalOperationStack, DateTime, Timestamp, Callstack" initializeData="C:\Traces\WCFTrace.svclog" />
      <add name="wcfmessages" type="System.Diagnostics.XmlWriterTraceListener" traceOutputOptions="LogicalOperationStack, DateTime, Timestamp, Callstack" initializeData="C:\Traces\WCFMessages.svclog" />
   </sharedListeners>
   <trace autoflush="true" />
  </system.diagnostics>
 </configuration>
If you by any chance is working with Microsoft support, send the following for a review or review it yourself to track the origin of slowness.
Ask Learn is an AI assistant that can answer questions, clarify concepts, and define terms using trusted Microsoft documentation.
Please sign in to use Ask Learn.
Sign in