Capturing Full User Mode Dumps & PerfView traces for troubleshooting high CPU & hang issues.
Please note: below are the steps for capturing traces and not the way to analyze them. It is very essential to capture right traces before analyzing them to find a root case, essentially for high CPU or troubleshooting a process hang.
In general, a dump is a process snapshot of its virtual memory at a single point in time. A one single user mode dump is not the appropriate way to analyze a hang or a high CPU scenario. We need multiple hang dumps captured in the overall time span or vicinity of the hang. Capturing PerfView traces at the time of the hang also makes sense.
DEBUGDIAG for Dump Capture
- Debug Diagnostic tool download link: https://www.microsoft.com/en-us/download/details.aspx?id=49924
- Install the MSI (download 64 bit MSI if your OS is 64 bit else the 32 bit MSI).
- From the desktop click at START menu and search for DebugDiag2 Collection and run it.
- Cancel the “Select Rule Type” dialog.
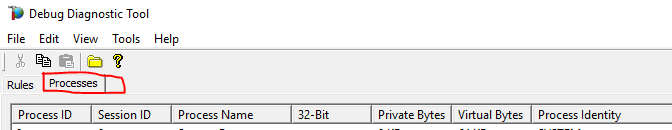
Go to Processes tab as shown in the screen shot below. During the slowness, hang or high CPU, select your process (for a Web application it would be w3wp.exe), right click and click at “Create FullUserdump”. Repeat this at uniform intervals in the entire duration of the hang. For example if the process hangs now, start capturing dumps and capture say for example 5 dumps at 30 seconds or 60 seconds interval. This dump will give a discrete picture of the process virtual memory at 5 different intervals and of course a better picture of the process - what it's threads were doing in the 150 seconds or 300 seconds discrete time frame. Default location of the dumps files: C:\Program Files\DebugDiag\Logs\Misc\
Alternatively, you can also automate the above process by going to the same Processes tab (shown in the screen shot above), right click the process (for which you would like to capture dumps) and select "Create Userdump Series... ". Select/Adjust the options as shown in the screen shot below. It is good to have Full UserDumps. 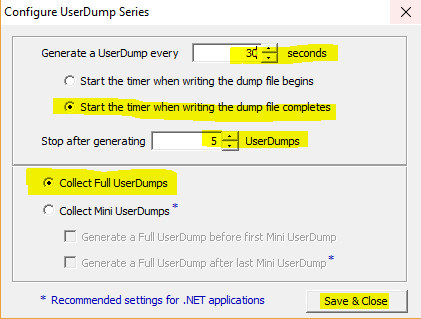
Default location of the dumps files: C:\Program Files\DebugDiag\Logs\Misc\
Post capturing the dumps, ZIP the Misc folder and upload it to the case workspace (if you are using Microsoft support) for sending it to the engineer working with you.
PERFVIEW
PerfView download location: https://github.com/Microsoft/perfview/releases/tag/P2.0.2
Run PerfView.exe, follow the steps below during the high CPU or hang or process slowness:
At the time of the issue (when you see the slowness)
1. Click at Collect Menu and select Collect option
2. CHECK Zip, Merge, thread time check boxes as shown in the screen shot below. 
3. If IIS is involved, expand the Advanced Options tab and select IIS checkbox as show in the screen shot below and click at “Start Collection” button to capture traces. 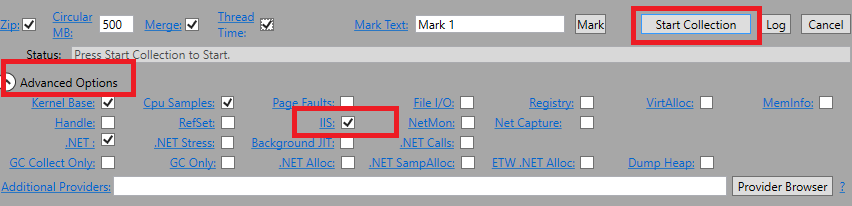
4. To stop collecting the traces (collect traces for few minutes), select “Stop Collection” from the same PerfView dialog and allow (meaning wait) the log capture to Merge (you can see that from the PerfView window status bar, flickering towards the right). Once the merge is complete you would notice files with names ending in *.etl.zip on the same folder from where you ran PerfView. Upload it to the case workspace (if you are using Microsoft support) for sending it to the engineer working with you.