Azure Kubernetes Service (AKS): Deploying Elasticsearch, Logstash and Kibana (ELK) and consume messages from Azure Event Hub
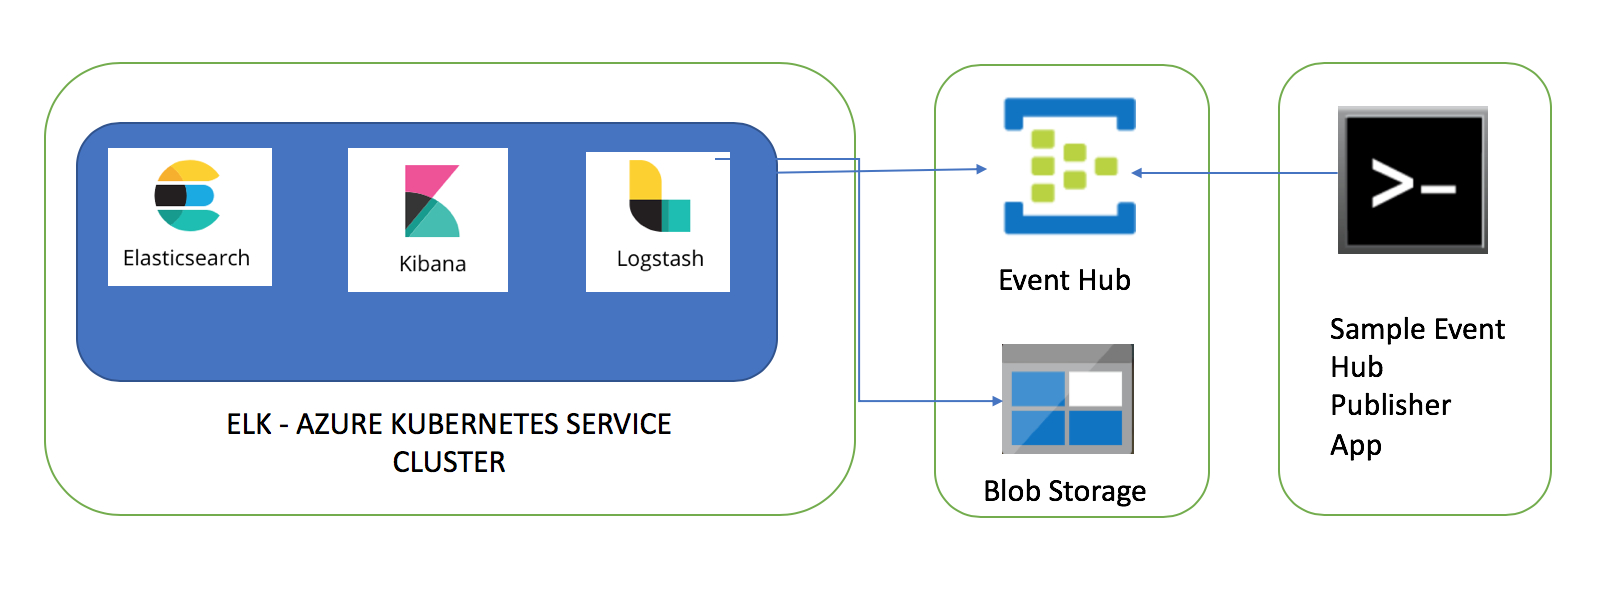
This article is part of the series of blogs on Azure Kubernetes Service (AKS). In this article I am going to share my experience of setting up Elasticsearch, Logstash and Kibana cluster in Azure Kubernetes Service (AKS) and consume messages from Event Hub. After the end of this article, we are going to have fully functional ELK stack with Azure Event Hub integration.
A sample client App (e.g. IOT device) will be publishing messages to Event Hub and these messages will be ingested into Elasticsearch using 'Azure Event Hub' plugin of Logstash. This article needs x-pack features of Elasticsearch thus I will show steps needed to activate trial license.
The second part of this series goes through steps needed to enable Azure AD SAML based single sign on to secure Elasticsearch and Kibana hosted in AKS. The third part of this series goes through steps needed to ingest Azure Redis Cache messages into Elasticsearch using Logstash's Redis plugin.
The dev tools used to develop these components are Visual Studio for Mac/Visual Studio 2017, AKS Dashboard as well as kubectl commands are used to create/manager Kubernetes resources in AKS.
Azure Kubernetes Service (AKS) Cluster
In case you don’t have AKS cluster up and running, please go through this article to Create AKS Cluster. Once AKS cluster is up and running, you can go through the rest of the article. The code snippets in this article are mostly yaml snippets and are included for reference only as formatting may get distorted thus please refer to GitHub repository for formatted resources.
Event Hub
Event hub messages will be ingested into Elasticsearch using Logstash pipeline, thus first resource I am going to create is Event Hub. Please follow steps listed in this article to create an Event Hub. The main pointers are
- Event Hub name I have selected for this sample solution is 'logstash'. If you select a different name, update event hub name in the source code.
- Keep a note of Event Hub connection string as this needs to be updated in Logstash pipeline and Event Hub messages publisher client.
- Source code uses '$Default' Resource_Group. Update this value if you create a Resource_Group
Azure Blob Storage
The next resource which you will need to create is Azure Blob Storage. Please follow steps listed in this article to create a storage account. Once storage account is created, create Blob Service-> Blobs. The main pointers are
- Blob container name I have specified in source code is 'logstash'. If you select a different name, update storage container name in the source code.
- Keep a note of Storage connection string as this needs to be updated in Logstash pipeline.
Client App to send messages to Event Hub
AzureEventHubSample project is client app to send messages to Event hub. You will need to update connectionString variable with Event Hub connection string and name of the hub. You can download the source code of this publisher client from Github.
Deploy Elasticsearch to Azure Kubernetes Service
Elasticsearch is a near real time search platform. The steps needed to deploy Elasticsearch to AKS cluster are listed below
Create a Persistent Volume
Persistent volume claim is needed to store Elasticsearch data. The yaml snippet to create a 5 GB storage is displayed below. The StatefulSet resource is going to mount files to this storage claim. You can read more about Persistent Volumes. apiVersion: v1kind: PersistentVolumeClaimmetadata: name: sample-elasticsearch-data-claimspec: accessModes: - ReadWriteOnce resources: requests: storage: 5Gi
Create a Kubernetes ConfigMap
ConfigMaps allow you to decouple configuration aspects from image and a few pointers about the yaml snippet displayed below are
- elasticsearch.yml and role_mapping.yml files will be mounted from ConfigMap
- xpack-security is enabled
- Update
max_local_storage_nodesbased on number of Pods - role_mapping.yml is intentionally left blank as it will be discussed in detail in next blogs of this series
apiVersion: v1kind: ConfigMapmetadata: name: sample-elasticsearch-configmap namespace: defaultdata: elasticsearch.yml: | cluster.name: "sample-elasticsearch-cluster" network.host: 0.0.0.0 discovery.zen.minimum_master_nodes: 1 #Update max_local_storage_nodes value based on number of nodes node.max_local_storage_nodes: 1 xpack.security.enabled: true xpack.monitoring.collection.enabled: true role_mapping.yml: |
You can read more about ConfigMap.
Create a Kubernetes Service
The next step is to create a Kubernetes Service for Elasticsearch. As you can see in yaml snippet below, port 9200/9300 is defined and type is ClusterIP i.e. this service doesn't has external endpoints. Kubernetes will use to selector 'service: sample-elasticsearch' to map to the deployment as you are going to see next. You can read more about Services. apiVersion: v1 kind: Service metadata: name: sample-elasticsearch labels: service: sample-elasticsearchspec: type: ClusterIP selector: service: sample-elasticsearch ports: - name: http port: 9200 targetPort: 9200 protocol: TCP - name: transport port: 9300 targetPort: 9300 protocol: TCP
Create a Kubernetes StatefulSet
Kubernetes StatefulSet is the workload API used to manage stateful applications. You can read more about StatefulSets. The yaml snippet to create a StatefulSet is displayed below and a few pointers are
service: sample-elasticsearchmatches to the selector defined in the service.- I have specified
replicas: 1which means that only one instance of Pod will be created by Kubernetes. You can update this value as needed, however you will need to update ConfigMap value.max_local_storage_nodes: 1too. - The docker image being used to create this resource is
image:docker.elastic.co/elasticsearch/elasticsearch:6.4.1. - By default, Elasticsearch runs inside the container as user elasticsearch using uid:gid 1000:1000. If you are bind-mounting a local directory or file, ensure it is readable by this user, while the data and log dirs additionally require write access. This is the reason I have used environment variable
- name: "TAKE_FILE_OWNERSHIP" value: “1”. The alternate option is to grant write access by adding an initcontainer step e.g.command: - sh - -c - chown -R 1000:1000 /usr/share/elasticsearch/data. You can read more at Elasticsearch Docker. - mmap count has been increased
vm.max_map_count=262144by adding an initcontainer step. You can read more about Elasticsearch virtual memory. - ConfigMap defined in previous step is used to mount elasticsearch.yml and role_mapping.yml files i.e.
configMap: name: sample-elasticsearch-configmap. - Lastly, persistent volume claim created above is used for storage i.e.
persistentVolumeClaim: claimName:sample-elasticsearch-data-claim. - Assign CPU resource as needed by updating section
resources:limits:. You can read more about Assign CPU Resources to Containers and Pods
apiVersion: apps/v1kind: StatefulSetmetadata: name: sample-elasticsearch labels: service: sample-elasticsearchspec: serviceName: sample-elasticsearch # Number of PODS replicas: 1 selector: matchLabels: service: sample-elasticsearch template: metadata: labels: service: sample-elasticsearch spec: terminationGracePeriodSeconds: 15 initContainers: # https://www.elastic.co/guide/en/elasticsearch/reference/current/vm-max-map-count.html - name: increase-the-vm-max-map-count image: busybox command: - sysctl - -w - vm.max_map_count=262144 securityContext: privileged: true containers: - name: sample-elasticsearch image: docker.elastic.co/elasticsearch/elasticsearch:6.4.1 resources: limits: cpu: 2000m memory: 2Gi requests: cpu: 100m memory: 1Gi ports: - containerPort: 9200 name: http - containerPort: 9300 name: tcp env: - name: cluster.name value: "sample-elasticsearch-cluster" - name: "xpack.security.enabled" value: "true" - name: "TAKE_FILE_OWNERSHIP" value: “1” volumeMounts: - name: sample-elasticsearch-data-claim mountPath: /usr/share/elasticsearch/data - name: sample-elasticsearch-configmap mountPath: /usr/share/elasticsearch/config/elasticsearch.yml subPath: elasticsearch.yml - name: sample-elasticsearch-configmap mountPath: /usr/share/elasticsearch/config/role_mapping.yml subPath: role_mapping.yml volumes: - name: sample-elasticsearch-data-claim persistentVolumeClaim: claimName: sample-elasticsearch-data-claim - name: sample-elasticsearch-configmap configMap: name: sample-elasticsearch-configmap
By default Elasticsearch will be deployed with basic license. After Elasticsearch is deployed, the next step is to activate trail license of Elasticsearch to use x-pack features of Elasticsearch.
Enable Trial Version of Elasticsearch
The steps needed to activate trail license are
- Run command
kubectl port-forward sample-elasticsearch-0 9200:9200and now you can access Elasticsearch endpoint at https://localhost:9200. POSThttps://localhost:9200/_xpack/license/start_trial?acknowledge=truerequest from any rest client. This is going to activate the trial license.
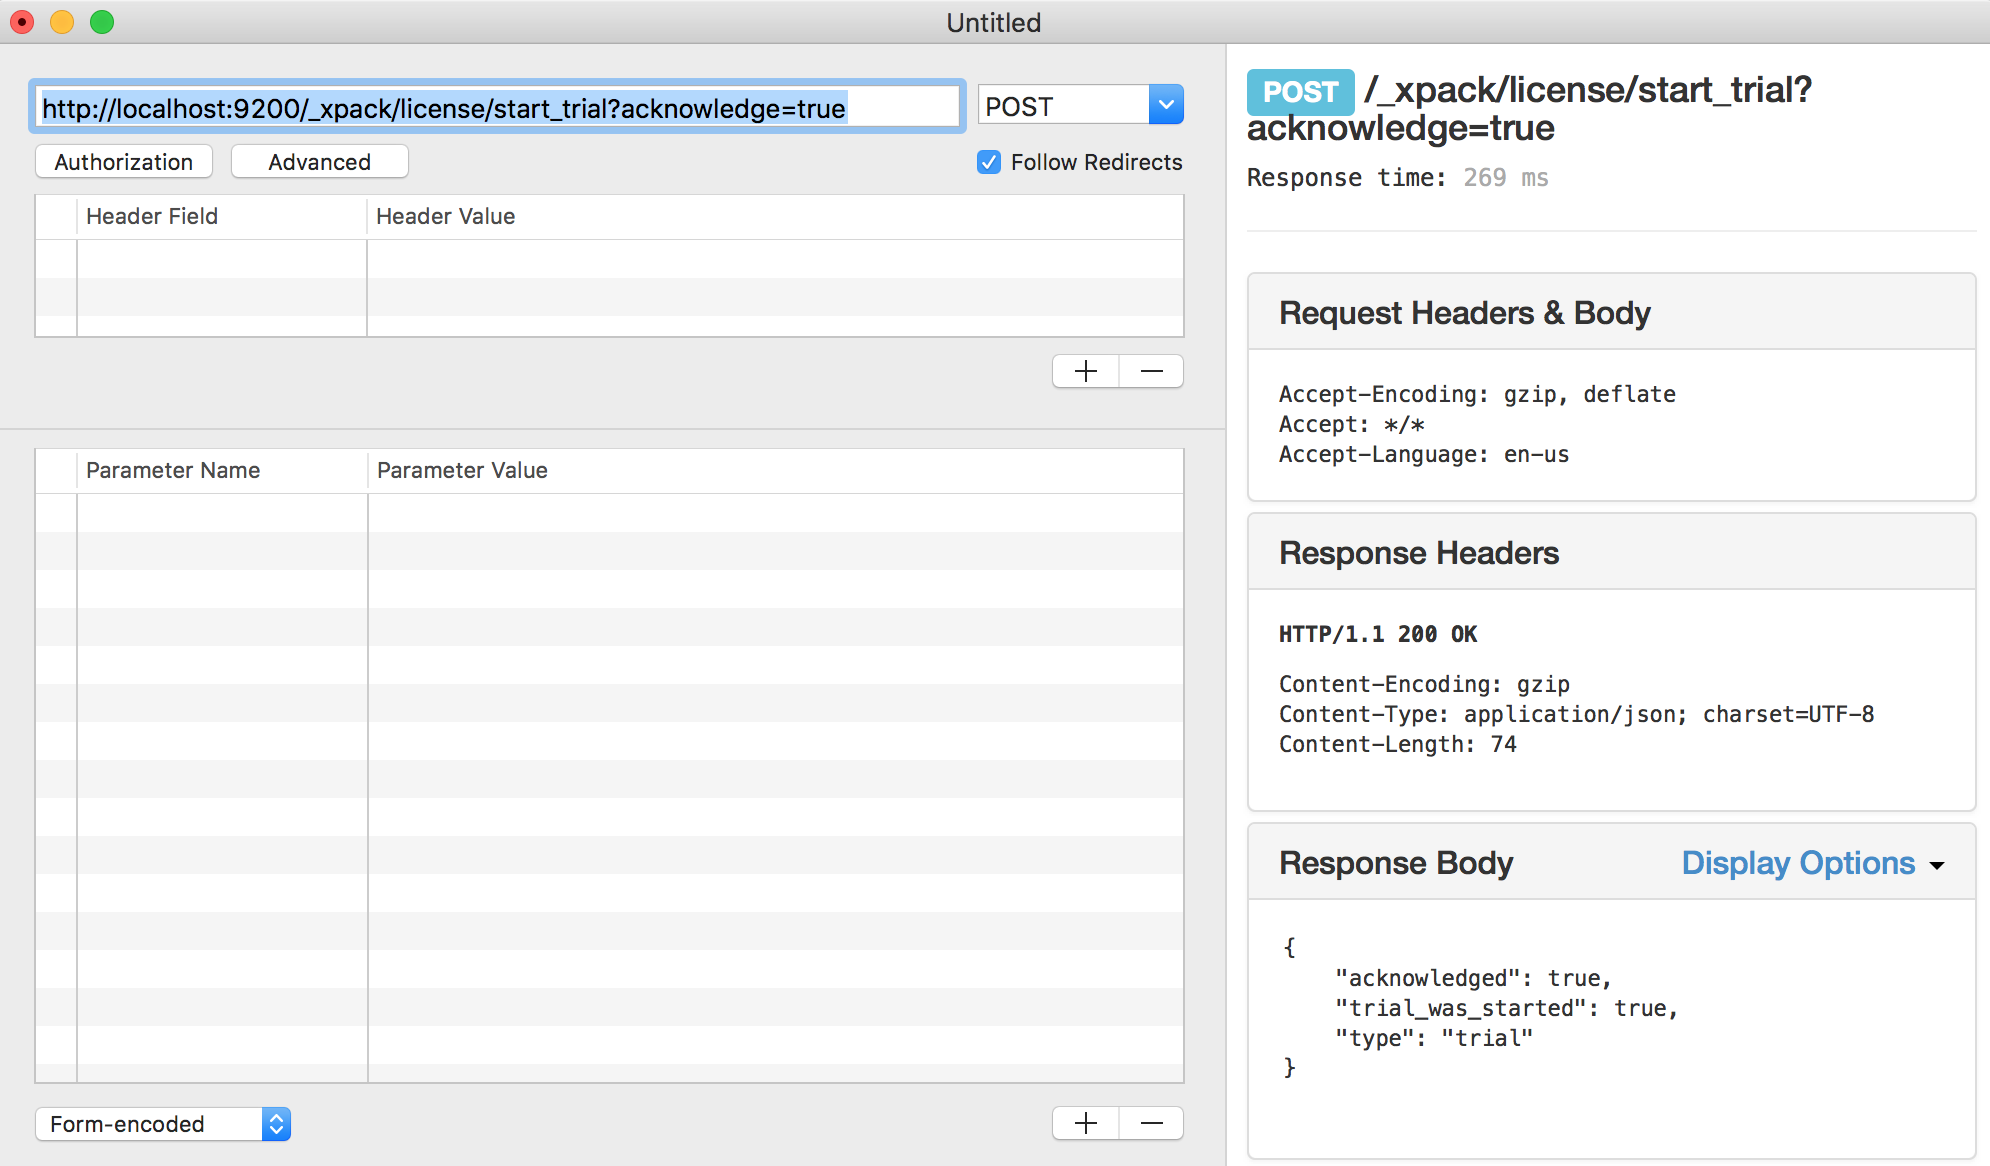
- You can verify if trail version is activated by GET
https://localhost:9200/_xpack/licenserequest from any rest client. - Once trial license is activated you can close the terminal as port forwarding isn't needed anymore.
Setup Password for buit-in user accounts of Elasticsearch
x-pack security feature of Elasticsearch is used to secure access thus we now need to setup passwords for built-in user accounts and the steps are
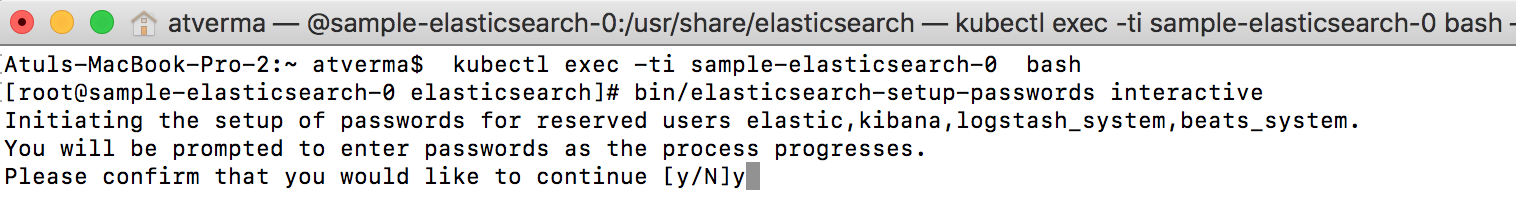
- Connect to Elasticsearch POD by running command
kubectl exec -ti sample-elasticsearch-0 bash - Run command
bin/elasticsearch-setup-passwords interactiveto setup built-in user passwords interactively. For this sample I have specified same password i.e. Password1$ for all accounts thus you will need to change password you specified in a few places in source code.
Deploy Kibana to Azure Kubernetes Service
Kibana lets you visualize your Elasticsearch data and navigate the Elastic Stack. The steps needed to deploy Kibana to AKS are listed below
Create a Kubernetes ConfigMap
The yaml snippet to create this resource is displayed below and a few pointers are
kibana.ymlfile will be mounted from ConfigMap- Kibana points to Elasticsearch based on
elasticsearch.url: https://sample-elasticsearch:9200 - Update
elasticsearch.password: Password1$based on your specified password for kibana (built-in) user
apiVersion: v1kind: ConfigMapmetadata: name: sample-kibana-configmap namespace: defaultdata: kibana.yml: | server.name: sample-kibana server.host: "0" elasticsearch.url: https://sample-elasticsearch:9200 xpack.monitoring.ui.container.elasticsearch.enabled: true elasticsearch.username: kibana elasticsearch.password: Password1$
Create a Kubernetes Service
The next step is to create a Kubernetes Service for Kibana. As you can see in yaml snippet below, port 80 is defined and type is LoadBalancer i.e. this service has external endpoints. Kubernetes will use to selector 'component: sample-kibana' to map to the deployment as you are going to see next. The creation of this service is going to take a while and once done you can get the external endpoint of this service either by opening AKS Dashboard or running Kubectl command kubectl describe services sample-kibana.
apiVersion: v1kind: Servicemetadata: name: sample-kibana labels: component: sample-kibanaspec: type: LoadBalancer selector: component: sample-kibana ports: - name: http port: 80 targetPort: http
Create a Kubernetes Deployment
The next step is to create a Kubernetes Deployment for Kibana. The yaml snippet is displayed below and a few pointers are
- The docker image being used to create this resource is
image: docker.elastic.co/kibana/kibana:6.4.1 - You can change the number of pods by updating
replicas: 1 - Label
component: sample-kibanahas to match the selector defined in the service - ConfigMap defined in previous step is used to mount kibana.yml file i.e.
configMap: name: sample-kibana-configmap
apiVersion: apps/v1beta1kind: Deploymentmetadata: name: sample-kibana labels: component: sample-kibanaspec: replicas: 1 selector: matchLabels: component: sample-kibana template: metadata: labels: component: sample-kibana spec: containers: - name: sample-kibana image: docker.elastic.co/kibana/kibana:6.4.1 resources: limits: cpu: 1000m requests: cpu: 100m ports: - containerPort: 5601 name: http volumeMounts: - name: sample-kibana-configmap mountPath: /usr/share/kibana/config/kibana.yml subPath: kibana.yml resources: {} terminationMessagePath: "/dev/termination-log" terminationMessagePolicy: File imagePullPolicy: Always securityContext: privileged: false volumes: - name: sample-kibana-configmap configMap: name: sample-kibana-configmap restartPolicy: Always terminationGracePeriodSeconds: 5 dnsPolicy: ClusterFirst securityContext: {} schedulerName: default-scheduler
Open the external endpoint of Kibana service once deployment is completed. Since x-pack security is enabled, Kibana will prompt for credentials.
Deploy Logstash to Azure Kubernetes Service
Logstash is data processing pipeline that ingests data from a multitude of sources simultaneously, transforms it, and then sends it to Elasticsearch. Logstash will use Azure Event Hub plugin to ingest data into Elasticsearch. The steps needed to deploy Logstash to AKS are listed below
Create a Kubernetes ConfigMap
The yaml snippet to create ConfigMap is displayed below and a few pointers are
logstash.ymlfile will be mounted from ConfigMappipelines.ymlfile will be mounted from ConfigMap. Multiple pipelines can be defined in this file e.g. you can see that AzureEventHubs pipeline is defined.azureeventhub.cfgfile will be mounted from ConfigMap. The Logstash event processing pipeline has three stages: inputs → filters → outputs. This file defines the logstash pipeline for Azure Event Hub.- Update
{AZURE_EVENT_HUB_CONNECTION_STRING}and {STORAGE_ACCOUNT_CONNECTION_STRING}values based on your Event Hub and Storage Account values. - Update
EntityPathin case your event hub is named differently then logstash. - Update
storage_containerin case your storage container is named differently than logstash. - Update
consumer_groupin case your consumer group is different than $Default. Specifying $Default isn't an ideal option. - Index name is defined as
index => "azureeventhub-%{+YYYY.MM.dd}
- Update
logstash.conffile will be mounted from ConfigMap- Elasticsearch URL is defined in
xpack.monitoring.elasticsearch.url: https://sample-elasticsearch:9200 - Update
xpack.monitoring.elasticsearch.password: Password1$based on your specified password for logstash_system (built-in) user. - Elasticsearch endpoint is defined in
hosts => [ "sample-elasticsearch:9200" ] - Update
password => "Password1$"to the specified password of your elastic (built-in) user
apiVersion: v1kind: ConfigMapmetadata: name: sample-logstash-configmap namespace: defaultdata: logstash.yml: | xpack.monitoring.elasticsearch.url: https://sample-elasticsearch:9200 dead_letter_queue.enable: true xpack.monitoring.enabled: true xpack.monitoring.elasticsearch.username: logstash_system xpack.monitoring.elasticsearch.password: Password1$ pipelines.yml: | - pipeline.id: azureeventhubs path.config: "/usr/share/logstash/azureeventhubs.cfg" azureeventhubs.cfg: | input { azure_event_hubs { event_hub_connections => ["{AZURE_EVENT_HUB_CONNECTION_STRING};EntityPath=logstash"] threads => 2 decorate_events => true consumer_group => "$Default" storage_connection => "{STORAGE_ACCOUNT_CONNECTION_STRING}" storage_container => "logstash" } } filter { } output { elasticsearch { hosts => [ "sample-elasticsearch:9200" ] user => "elastic" password => "Password1$" index => "azureeventhub-%{+YYYY.MM.dd}" } } logstash.conf: |
Create a Kubernetes Service
The next step is to create a Kubernetes Service for Logstash. As you can see in yaml snippet below, port 80 is defined and type is ClusterIP i.e. this service has no external endpoints. Kubernetes will use to selector 'component: sample-logstash' to map to the deployment as you are going to see next.
apiVersion: v1kind: Servicemetadata: name: sample-logstash labels: component: sample-logstashspec: type: ClusterIP selector: component: sample-logstash ports: - name: http port: 80 targetPort: http
Create a Kubernetes Deployment
The next step is to create a Kubernetes Deployment for Logstash. The yaml snippet is displayed below and a few pointers are
- The docker image being used to create this resource is
docker.elastic.co/logstash/logstash:6.4.1 - You can change the number of pods by updating
replicas: 1 - Label
component: sample-logstashhas to match the selector defined in the service - ConfigMap defined in previous step is used to mount logstash.yml, logstash.conf, pipelines.yml and azureeventhubs.cfg files i.e.
configMap: name: sample-logstash-configmap
apiVersion: apps/v1beta1kind: Deploymentmetadata: name: sample-logstash labels: component: sample-logstashspec: replicas: 1 selector: matchLabels: component: sample-logstash template: metadata: labels: component: sample-logstash spec: containers: - name: sample-logstash image: docker.elastic.co/logstash/logstash:6.4.1 volumeMounts: - name: sample-logstash-configmap mountPath: /usr/share/logstash/config/logstash.yml subPath: logstash.yml - name: sample-logstash-configmap mountPath: /usr/share/logstash/pipeline/logstash.conf subPath: logstash.conf - name: sample-logstash-configmap mountPath: /usr/share/logstash/azureeventhubs.cfg subPath: azureeventhubs.cfg - name: sample-logstash-configmap mountPath: /usr/share/logstash/config/pipelines.yml subPath: pipelines.yml resources: limits: cpu: 1000m requests: cpu: 100m ports: - containerPort: 5601 name: http volumes: - name: sample-logstash-configmap configMap: name: sample-logstash-configmap
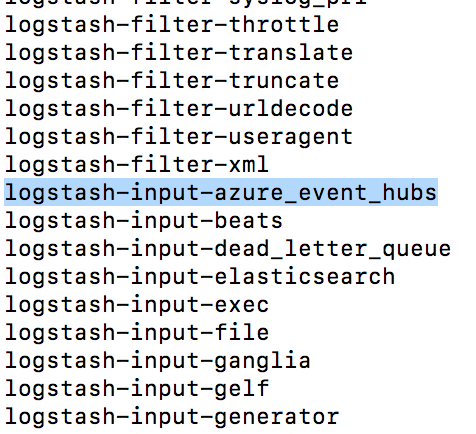
As mentioned earlier, Logstash will use azure_event_hubs plugin to ingest data into Elasticsearch. You can get installed plugins list by following steps listed below
- Run command
kubectl exec -ti {Logstash_Pod_Name} bashto connect to Logstash POD. - Run command
bin/logstash-plugin listto see installed plugins
Demo
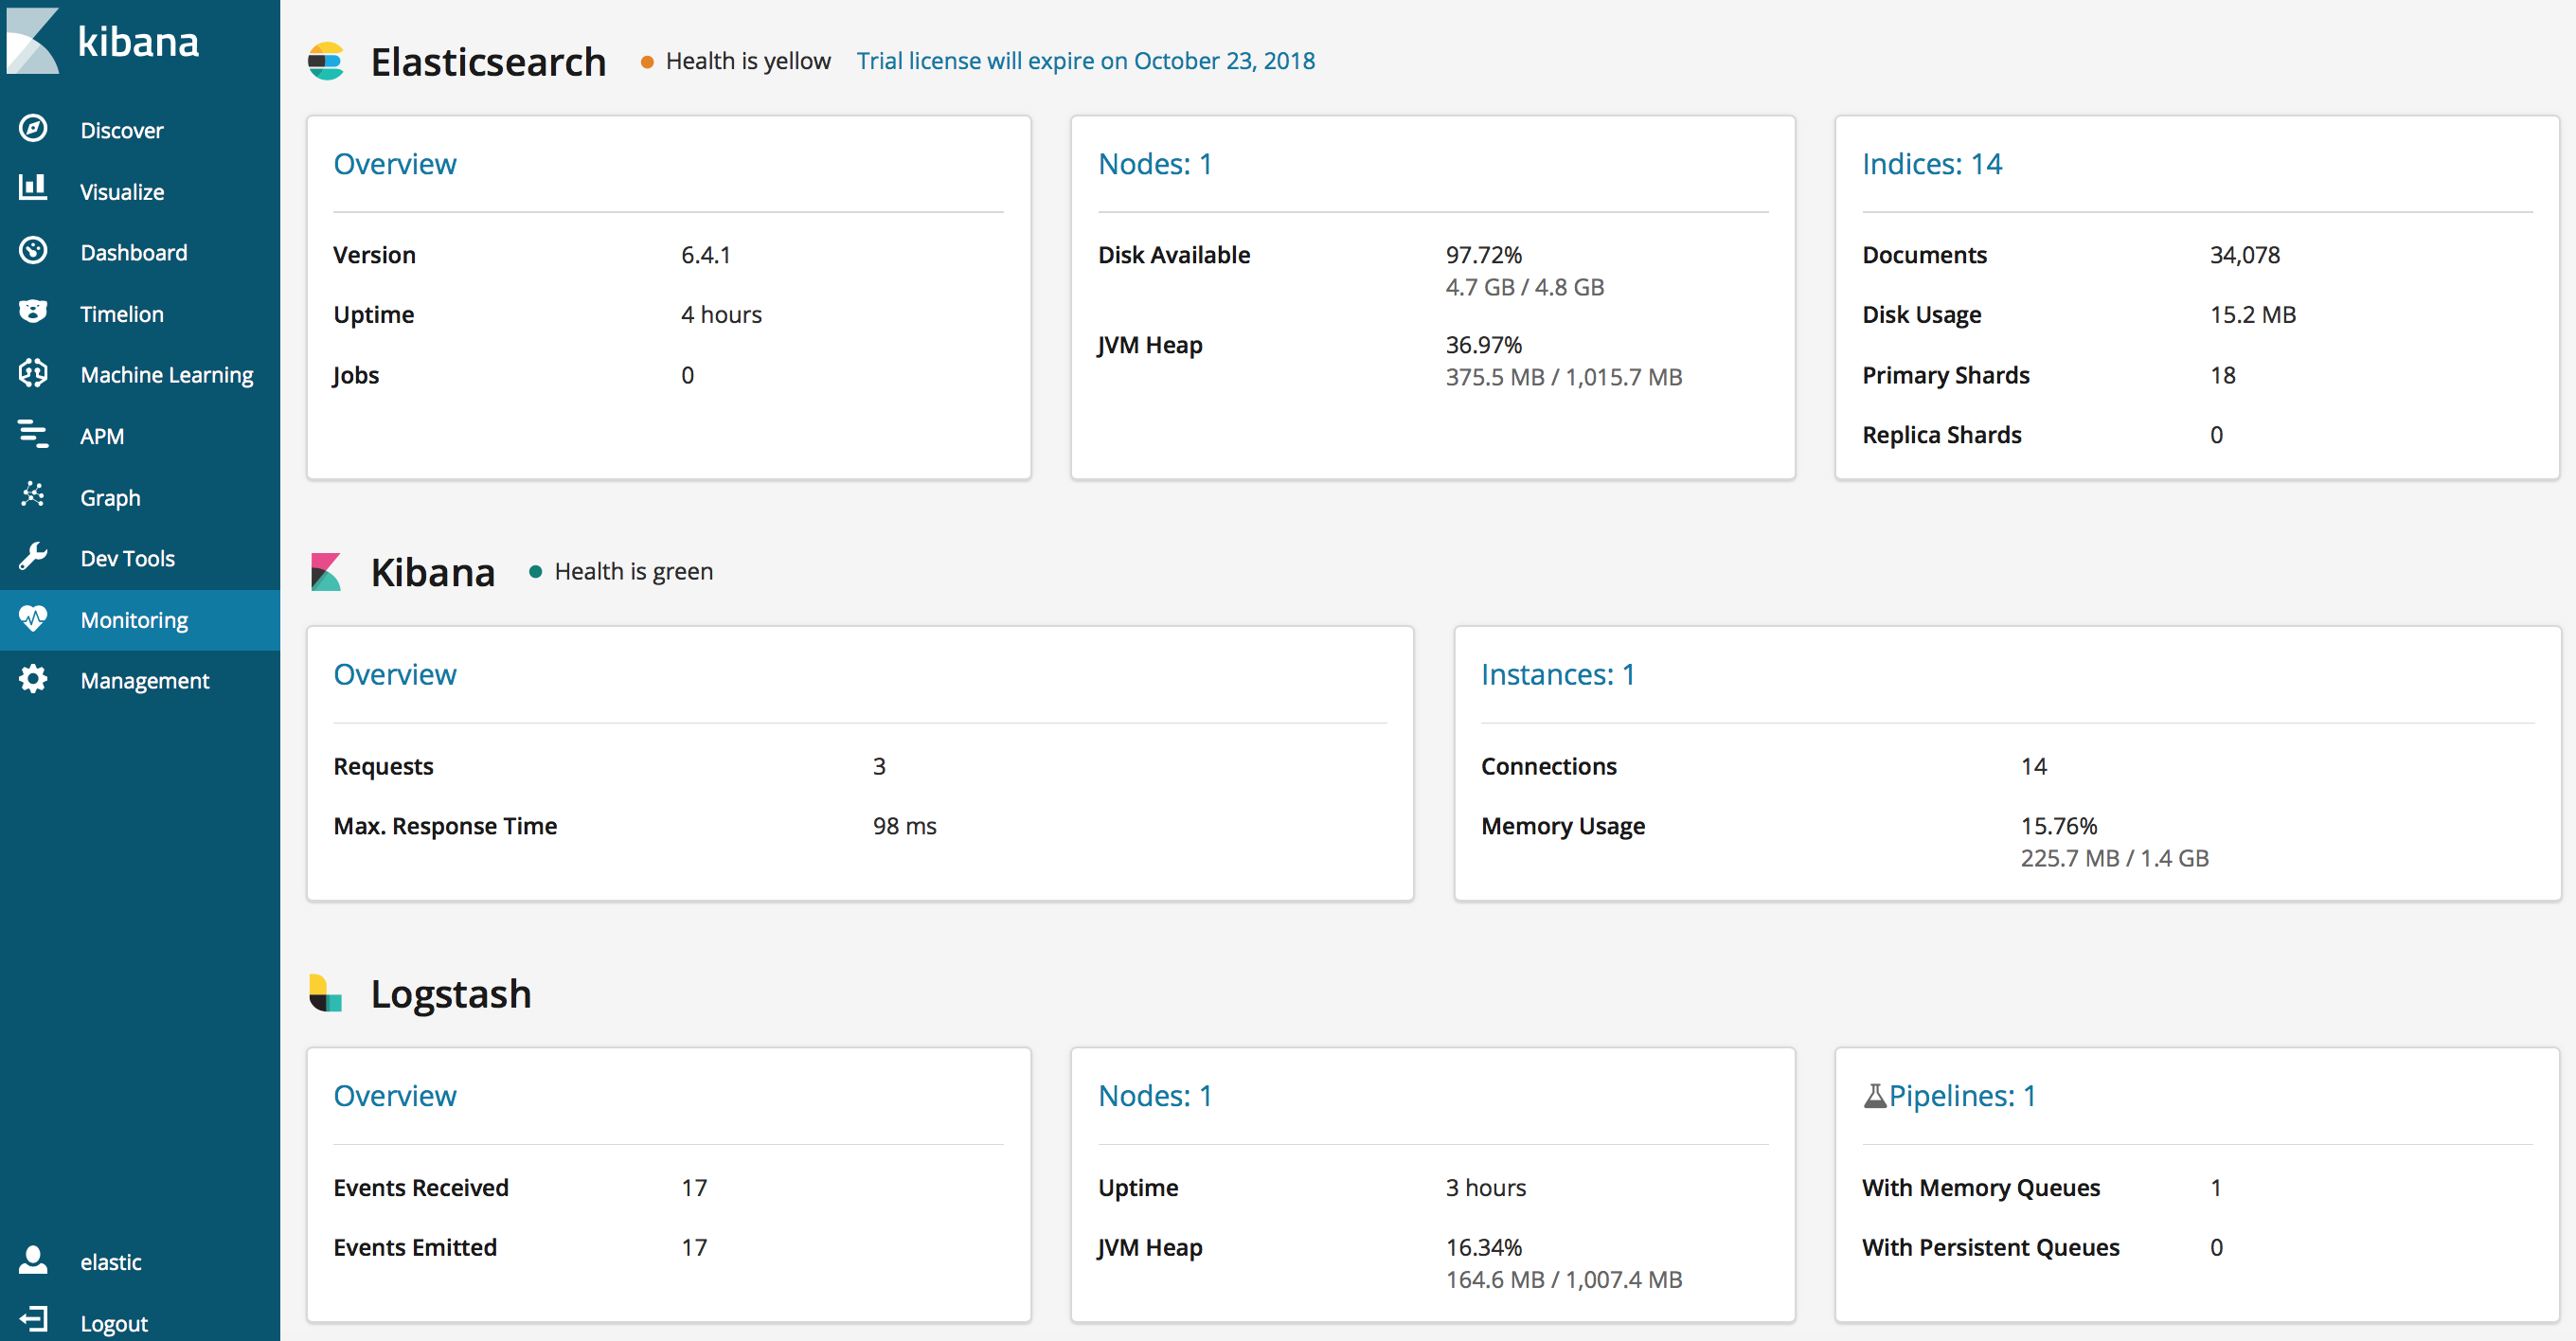
After all resources are deployed to AKS, run client app to send messages to Event hub. Open Kibana and you will see ELK stack statistics in Monitoring section. The number of messages sent by client App to Event hub will be displayed in Logstash's Events received and events emitted statistics.
The Discover tab of Kibana will display events ingested into Elasticsearch once you create index filters e.g. I have selected index filter as 'azureeventhub*' and you can see that this index naming convention was defined in azureeventshub.cfg pipelineindex => "azureeventhub-%{+YYYY.MM.dd}.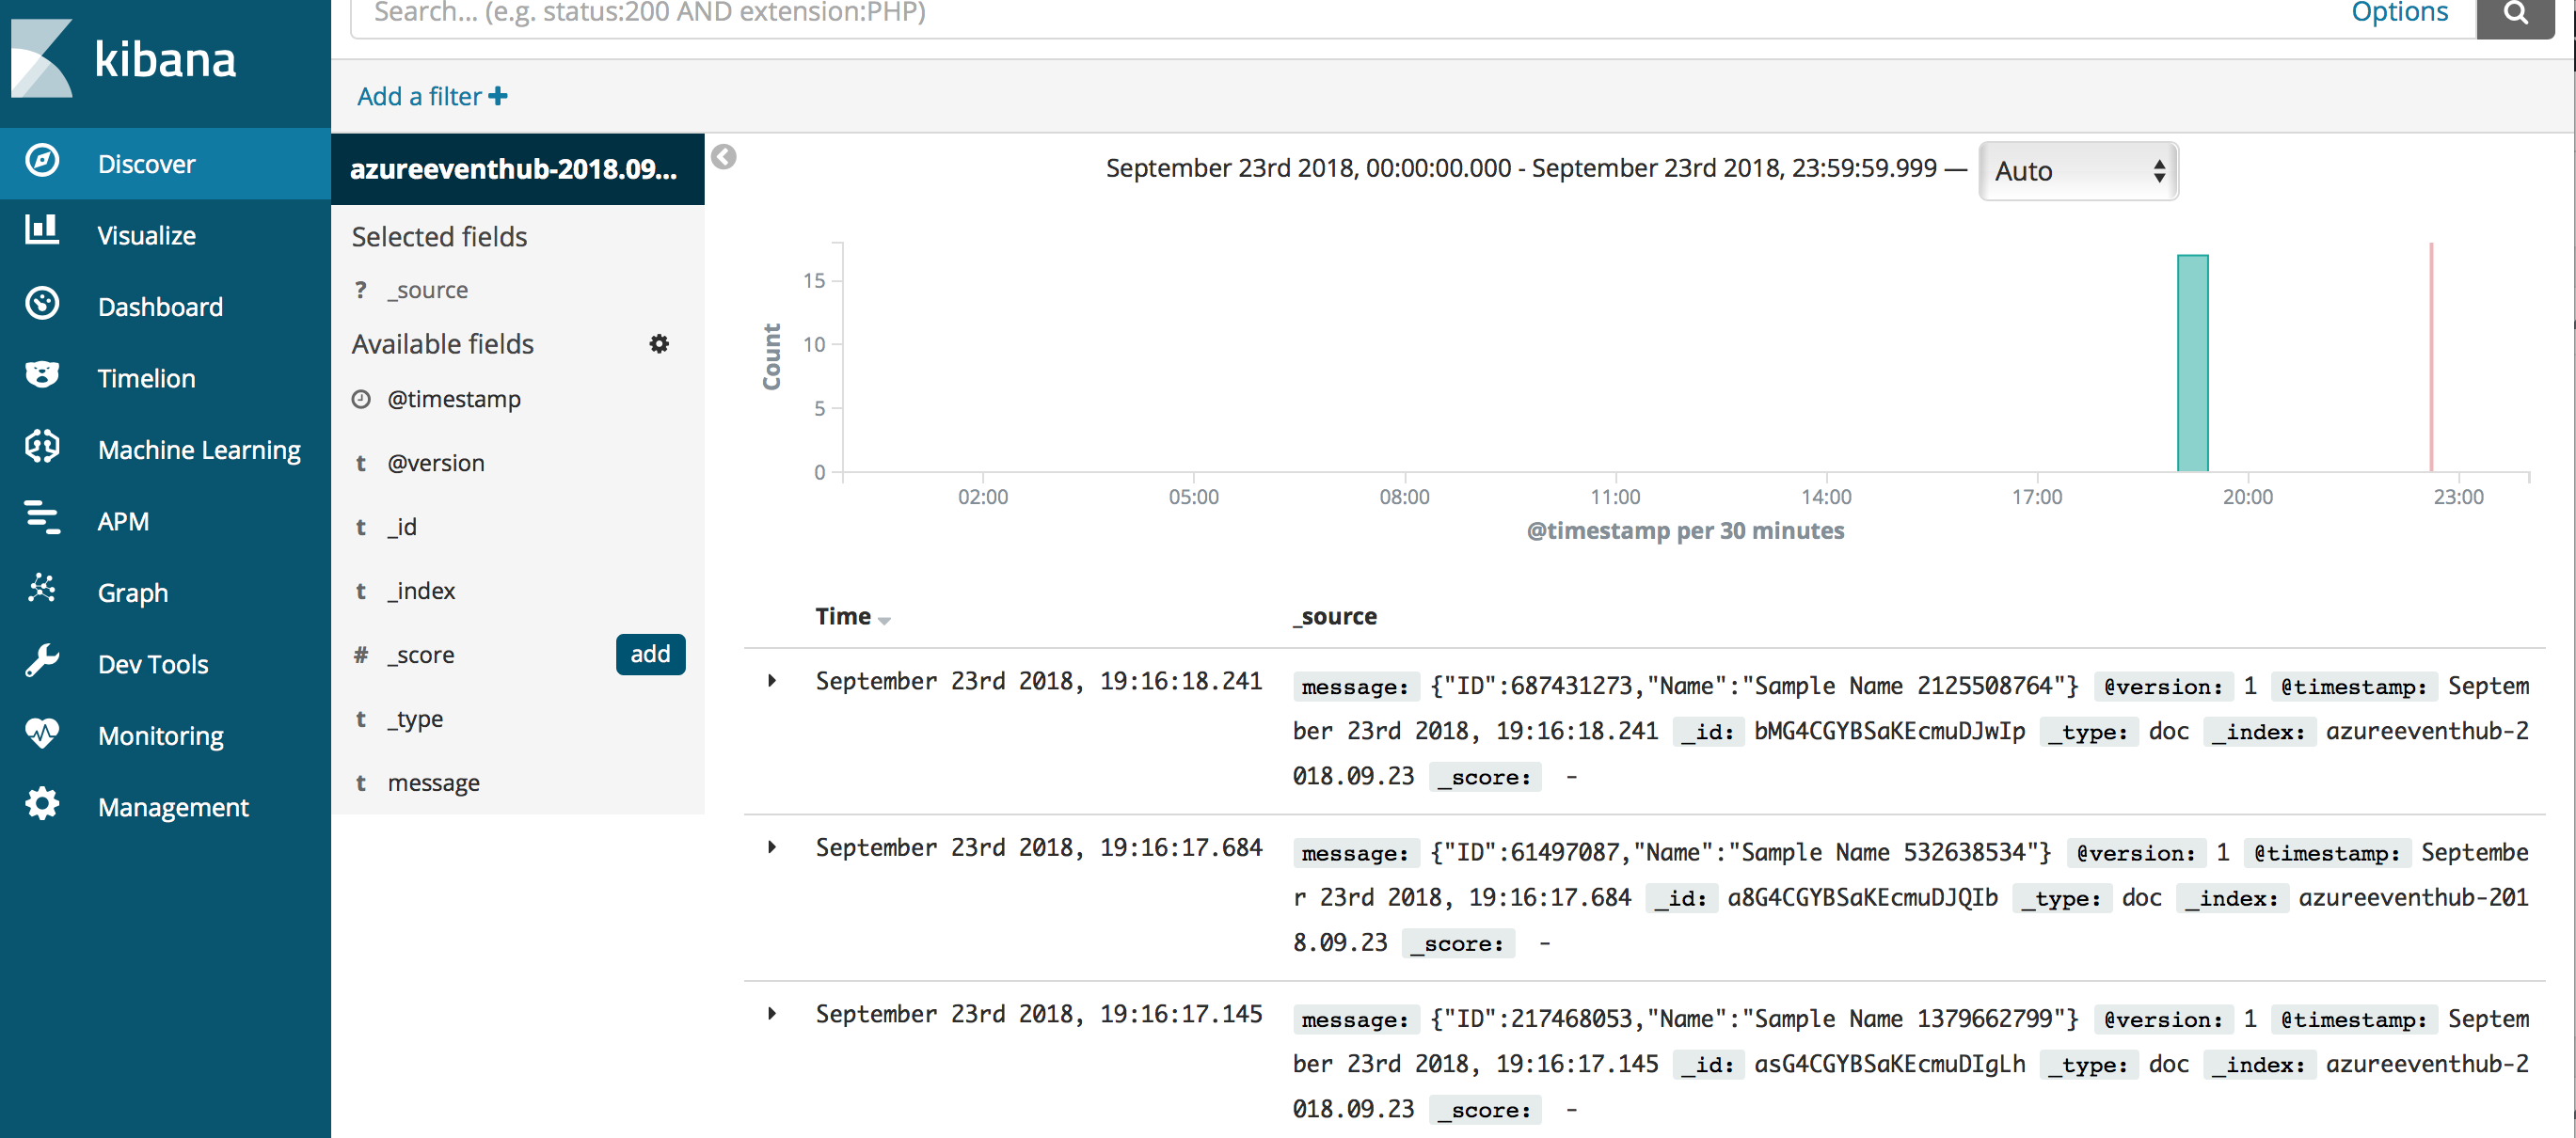
You can download source code for this article from GitHub repository
The second part of this series is Azure Kubernetes Service (AKS): Azure AD SAML based Single Sign on to secure Elasticsearch and Kibana and securing communications in ELK