Understanding IntelliTrace Part III: IntelliTrace Events
This is a multi-part series, you can find the other parts here:
Understanding IntelliTrace Part I: What the @#$% is IntelliTrace?
Understanding IntelliTrace Part II: Where Do I Use IntelliTrace?
Understanding IntelliTrace Part III: IntelliTrace Events
Understanding IntelliTrace Part IV: IntelliTrace Calls
The “How”
Okay campers we have covered the “what” and “where” so the remaining posts will deal with the “how” of IntelliTrace. There are some fundamental pieces to the technology that we will look at and then explore specific scenarios for utilization. So let’s get started!
What Can I Debug With IntelliTrace?
The first thing you will need to know is the exact types of applications you can use with IntelliTrace. Here is information straight from the documentation (https://msdn.microsoft.com/en-us/library/dd264915(v=vs.110).aspx#IntelliTraceSupport):
Supported |
|
Limited support |
|
Not supported |
|
NOTE: If you want to debug a process that is already running, you can’t use IntelliTrace. You must start IntelliTrace when the process starts. We will look at why this is the case down the road.
Turning IntelliTrace On (or Off)
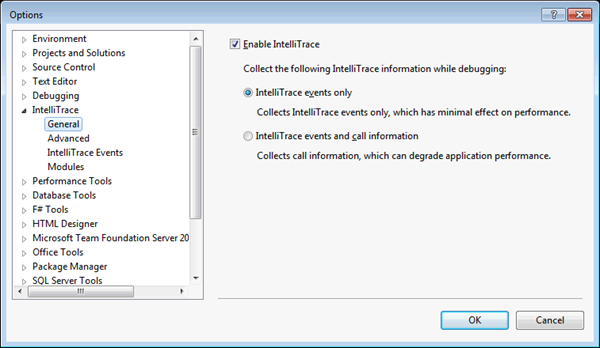
The first thing you have to know is how to turn IntelliTrace on. If you are using Visual Studio 2012 then this feature is already turned on but if you are using Visual Studio 2010 then you will need to turn it on. Either way it’s always a good idea to make sure it is turned on, just in case. Go to Tools | Options | IntelliTrace | General and select Enable IntelliTrace:
Notice you have two choices when you turn it on. For now we will go with the default, IntelliTrace Events Only. In the next post we will explore call information.
IntelliTrace Events
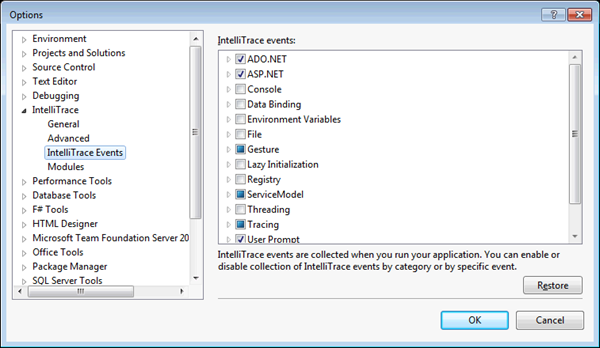
So what are these events that we have? Well, in a general sense, they are low-impact, high-value inflection points in the codebase that we use to quickly pinpoint issues. IntelliTrace comes with several pre-defined events and you can even add custom events. For now we will explore the pre-defined events. You can see the current list of events we supply by going to Tools | Options | IntelliTrace | IntelliTrace Events:
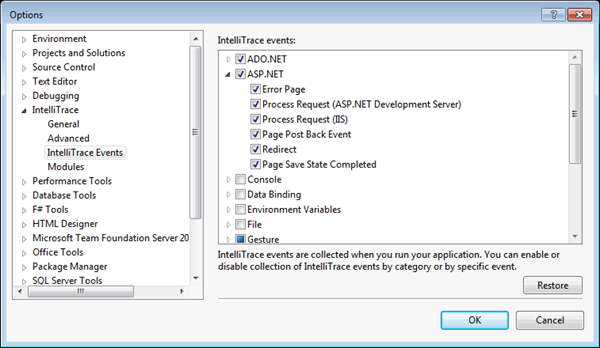
Notice there are sets of broad categories. Expand the ASP.NET node and notice we can further drill down into the details if we only want to capture certain events. Take some time now to look over the categories and events in each category:
Filtering Events
You can decide which events you want to capture from this dialog however there are two schools of thought on how to use this area:
Filter Now
One school of thought suggests you use this dialog to pre-filter out events you think you don’t need. The upside to this is improved performance when using IntelliTrace since a lot of information doesn’t have to be gathered. The downside is you could miss something that didn’t show up because you filtered it out. This theory is supported by the IntelliTrace team (run by my friend Larry Guger) and is the main reason this dialog exists in the first place.
Filter Later
The other school of thought says you should collect everything you can now and filter out information later. The upside is you can look at all the data and catch more issues. The downside is you take a larger performance hit when using IntelliTrace. This is the theory I adhere to along with my friend and BBQ buddy John Robbins.
Choosing Your Filter Strategy
Neither of the theories are “right” they are just personal choices we have made. If you find the performance hit is too much for you then go with pre-filtering to get a perf bump. Otherwise, I strongly suggest you try the “filter later” approach at least until you get a sense of what should be filtered out.
Using IntelliTrace
Now that we have covered the basics let’s actually use IntelliTrace! All the demos I’m doing are based on Brain Keller’s Visual Studio 2012 Virtual Machine and you should absolutely use this VM if you can to practice your skills. Also, grab my IntelliTrace Everywhere Deep Dive material while you are at it to do these examples on your own. The great thing about using a virtual machine is the ability to rollback to a prior snapshot so you can always go back to a “clean” environment if you need to.
Make sure you have IntelliTrace Events Only turned on and, for this demo, all pre-defined events are being collected as well:
I’m using the Tailspin Toys codebase for these examples but you can substitute it with any MVC example web app. The scenario we are going to troubleshoot is a classic 404 error. In Visual Studio 2012, build and run the Tailspin Toys example:
(NOTE: You will notice a performance hit when loading for the first time. I will explain why this happens later.)
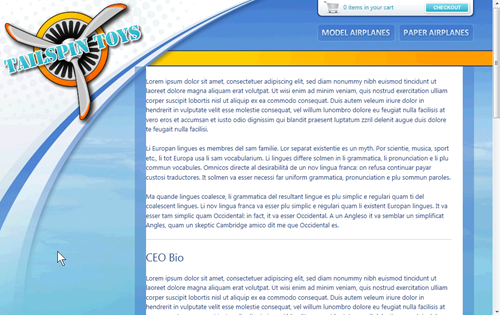
Select the About Us link in the lower left-hand corner and notice we get a (somewhat handled) 404 error:
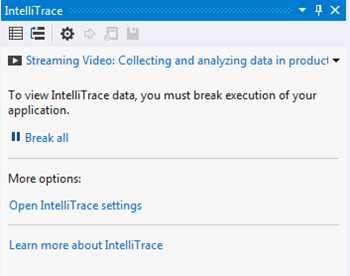
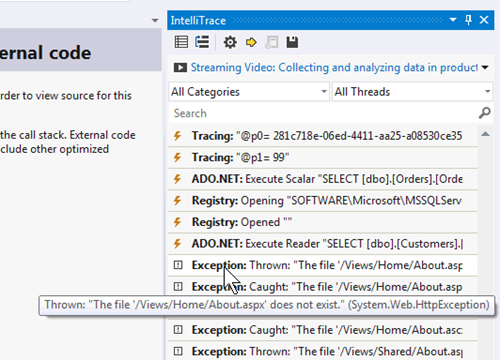
We realize we have a problem. Switch over to Visual Studio and notice the IntelliTrace window (Debug | Windows | IntelliTrace Events):
Select Break All to start a debugging session and give us our historical data in the IntelliTrace Events window:
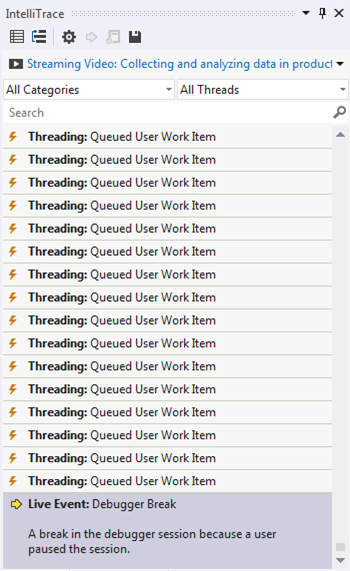
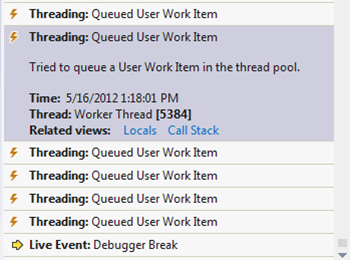
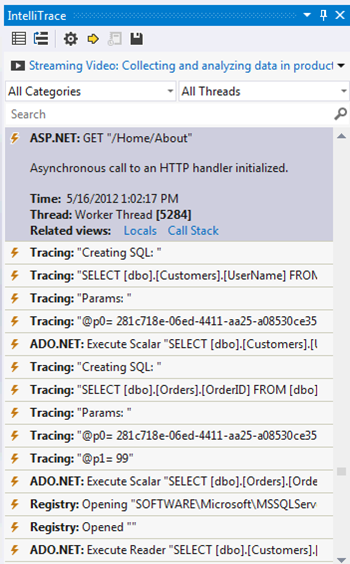
What are we looking at here? The first thing you need to realize is that you are looking at the history of events up until we entered the debugger. The most recent activity is at the bottom and, scrolling up, we see things that occurred further in the past. Notice that we are currently in live debugging mode and can do all the normal activities we would engage in as if there were no IntelliTrace. If another item further back in the list is selected we can see some historical information:
(NOTE: If you don’t have Update 1 installed for Visual Studio then you will not see the time stamp but otherwise everything else should look the same.)
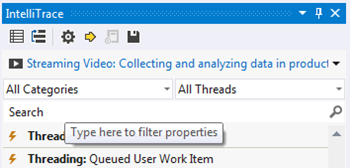
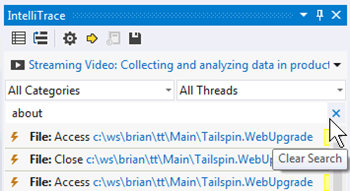
One of the keys to success with using IntelliTrace is knowing how to leverage what I call “anchor points”. That’s not an official name but it’s the best descriptor, I believe, for the concept. Recall we had a problem with the About page. It seems natural to look for any entries that reference this page. Notice we have a search area for this tool window:
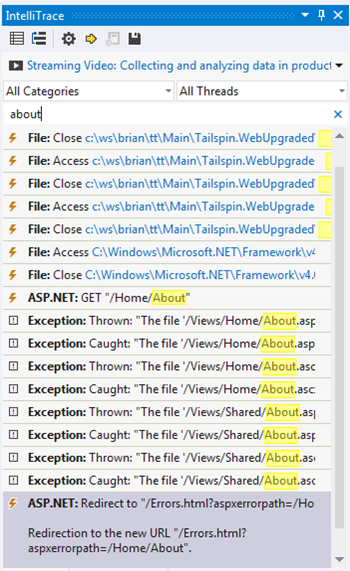
Look for any entries that contain the word “about” in them:
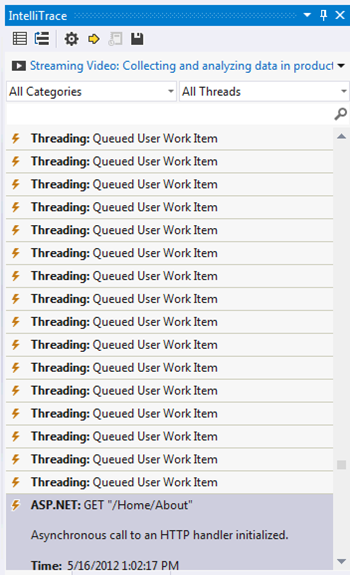
There are a lot of entries but clearly our problem started sometime after the GET request for the about page. Select this item in the list to create our anchor point:
Now we can clear the search:
Now we have an unfiltered history with our anchor point:
We can safely assume that anything interesting to us will happen after the GET request so we scroll down to see things that happened AFTER that specific point in time:
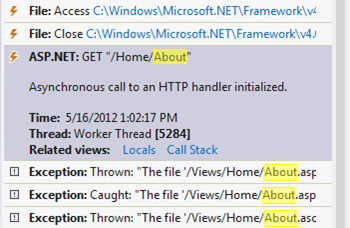
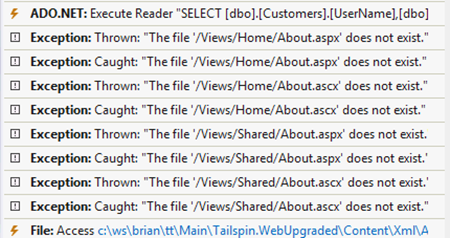
The first exceptions we come across appear to be what we are looking for at first glance:
Take a closer look. There is a series of these errors and the paths change from /Views/Home to /Views/Shared and different extensions are tried (.aspx and .ascx):
These are your first examples of “noise” in the results. The errors are typical ones you see in MVC applications and are related to routing. In any given type of application you are working with you will encounter some type of noise in the result sets. Be aware of them and, over time, you will learn the specific types of noise for your situation.
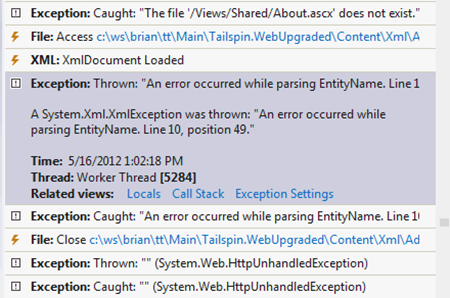
As we continue to examine the timeline we see our next exception occurs after we tried to load an XML document:
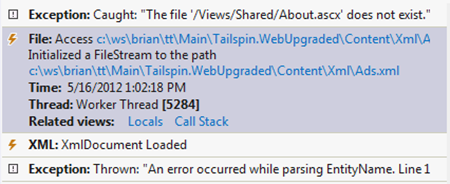
As you can see in this case the error is pretty specific. It gives us the line and position of where it thinks the error to be. If we look at the File Access event there is a link to the offending XML file:
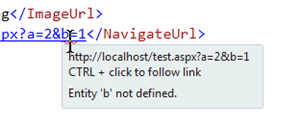
Clicking the link opens the file and if we go to the line and position specified we can clearly see the error:
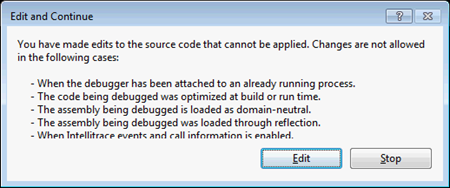
When we go to edit the file this dialog is what we are presented with:
Click the Edit button and we can fix the problem:
Restart the debugging session and you should find the problem is fixed:
How Does IntelliTrace work?
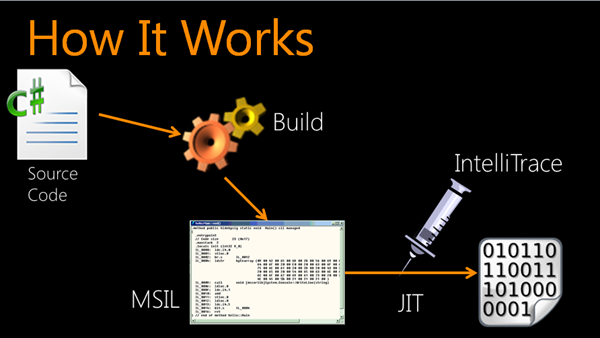
Here is a slide I created when explaining how IntelliTrace works:
Let’s walk through what’s happening. When you build your source the result, of course, is an assembly with Microsoft Intermediate Language (MSIL) code in it. At the time the assembly is used (“run”) the MSIL code is Just in Time (JIT) compiled into machine language. IntelliTrace injects code (using the CLR Profiler) when the assembly is JIT compiled so the information required can be gathered. The more information you need the more IntelliTrace code that has to be injected which is why you always take an up-front performance hit when using it but the application becomes more responsive after the assembly is loaded. This is also the reason why IntelliTrace needs to catch the application as it is loading.
Review
I always hate the end of these things because I always feel like I haven’t said enough. The good news is there will be many more posts to clarify and enhance your IntelliTrace education. In this post the goal was to teach you about IntelliTrace events and do an introduction to troubleshooting with the feature. Resolving issues with the historical information will reduce resolution time. Be aware that there is always noise in every IntelliTrace capture and you will learn to identify those patterns in your codebase. Resolving issues with events is the first part of the IntelliTrace education. In the next post we will explore how to work with calls.
