Understanding IntelliTrace Part I: What the @#$% is IntelliTrace?
This series is based on my IntelliTrace Workshop materials found here: https://sdrv.ms/UPUEE3
This is a multi-part series, you can find the other parts here:
Understanding IntelliTrace Part I: What the @#$% is IntelliTrace?
Understanding IntelliTrace Part II: Where Do I Use IntelliTrace?
Understanding IntelliTrace Part III: IntelliTrace Events
Understanding IntelliTrace Part IV: IntelliTrace Calls
Over the next few posts I’m going to explain IntelliTrace in consumable chunks so folks can get a handle on it. Even though we introduced it in Visual Studio 2010, it’s still one of the more misunderstood features we have in the IDE. Together we will navigate through the what, where, and how of IntelliTrace to, hopefully, come out ready to engage in debugging bliss. :)
The “What”
Before you can use IntelliTrace you have to understand what it is. There are several good explanations people use to describe how this works. I think the best way to do this is to compare it with live debugging by using an analogy.
NOTE: IntelliTrace can be used for debugging .NET 2.0 - .NET 4.5 assemblies however, you need .NET 3.5 to run IntelliTrace itself so, at a minimum, you need .NET 3.5 and the Framework version you want to debug.
Live Debugging
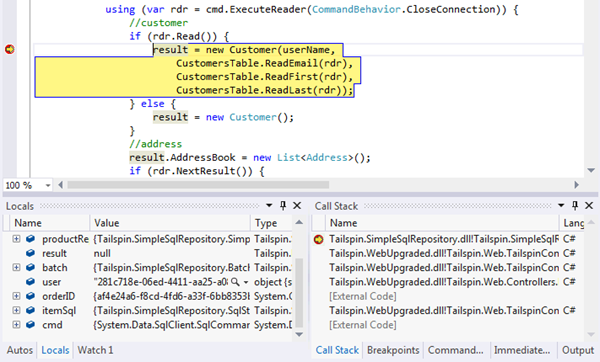
Imagine live debugging as being like directing a cast of people on stage. You can bring different people to the front, you can make them move around, change their look if you want, and so forth. Essentially, you have complete control over what is seen at any point in time BUT you can’t rewind to look at what has happened in the past and you can’t fast-forward. All you can basically do is focus on what is happening right now.
Similarly, you can break execution, step through your code,and even dynamically change variable values for variables in scope. There is a LOT of control but you can’t go back once you have passed a line of code unless you restart the entire debugging session. Therefore, live debugging is very much point-in-time oriented.
IntelliTrace Debugging
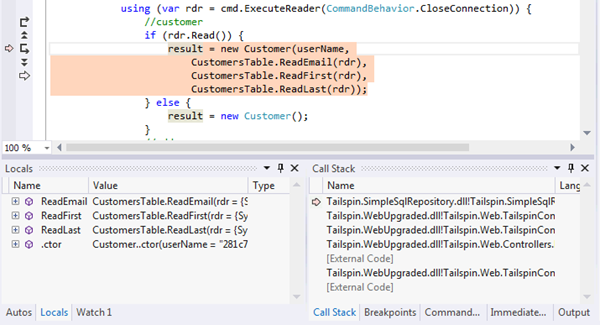
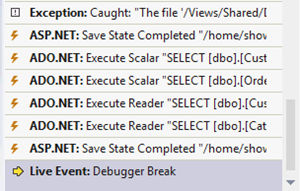
Unlike live debugging, IntelliTrace debugging is like watching a video of the stage play. You can fast-forward past the boring parts and rewind if you missed something. The one thing you can’t do is change what is happening since it has already happened in the past. You give up controlling the actors in favor of controlling the timeline. In fact, IntelliTrace was originally called “Historical Debugging” when we introduced it.
Live vs. IntelliTrace Debugging
I like the title of this section because most people who don’t know about IntelliTrace assume that it replaces live debugging. Let me be perfectly clear: IntelliTrace DOES NOT replace live debugging. Not today, not tomorrow, not ever. In fact, the two were meant to work together. You can see this when you are using IntelliTrace as it always gives you the option to go back to live debugging whenever you want:
It’s common to be in the middle of a live debugging session, then need to use IntelliTrace to see something that happened in the past, and then switch back to live debugging to pick up where you left off.
Finally
Okay so I “might” have mislead you into thinking that you would come away from this article completely understanding IntelliTrace but it was all part of my evil plan. You can’t really understand the feature until you use it and that is exactly what we will do in this series. We are going to build up scenarios and and hopefully have you come away with much deeper appreciation of this technology.


