Visual Studio 2012 Update 1: Understanding Code Map
With the addition of Visual Studio Update 1 we introduced a cool new feature called Code Map. You can use Code Map to visualize relationships in code. In this article we will explore this new feature and show you how to use it.
Requirements
Before we get started you need to be aware of the requirements for Code Map. Below are the requirements to leverage this feature:
Visual Studio 2012.1 and one of these editions:
Visual Studio 2012 Ultimate to create code maps from the code editor or from Solution Explorer.
 Note: Before you share maps with others who use Premium or Professional, make sure that all the items on the map are visible, such as hidden items, expanded groups, and cross-group links.
Visual Studio 2012 Premium or Visual Studio 2012 Professional to open code maps, make limited edits, and navigate code.
A solution with Visual C# .NET or Visual Basic .NET code
With that said, I often see many larger organizations who usually have a few extra Ultimate licenses so you might ask around at your company to see if there are any available licenses if you need the higher level version.
What are Code Maps?
We will get to examples of maps in a minute but I wanted to help clarify their origin. Code Maps are a more user-friendly approach to something we have had in Ultimate for a while known as Dependency Graphs. With this new feature we make creating and manipulating visualizations easier. I bring this up because you may want to explore creating Dependency Graphs to learn more about how to work with these visualizations. You can find out more here:
https://msdn.microsoft.com/en-us/library/dd409453.aspx
Creating Code Maps
The need for maps will usually manifest itself when you are writing or debugging code and need to understand code relationships. Let’s take, for example, TailSpin Toys from the Brian Keller Virtual machine found at:
Let’s say I happen to be looking at the AddItem method and want to get a handle on what is calling this method. I can right-click the method and choose Show on Code Map (note the shortcut key as well):
NOTE: I’m showing this path for demo purposes. As you get more advanced you may want to choose an option from the Show Related Items on Code Map menu:
Once you choose to show an item on the map, Visual Studio will build the solution and index it to generate the initial map image:
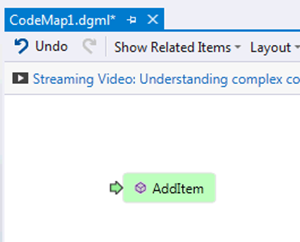
The first image may not look like much:
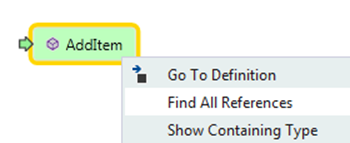
I want to see anything that calls this method. I can go to Show Related Items on the toolbar or simply right-click the AddItem node and choose Find All References:
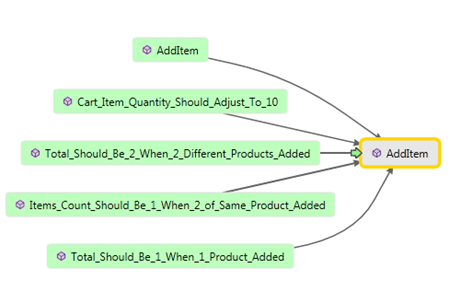
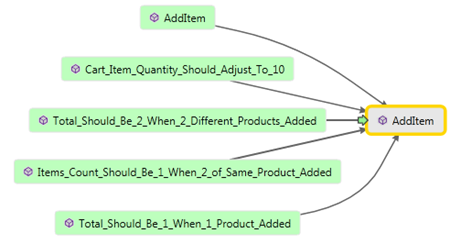
Now we have a map! We can visualize our method and calls to it:
I’m not a fan of the default orientation (Top to Bottom) in this case so go to the toolbar and select the Left to Right Layout:
Which will give a little better perspective on what is happening:
If you need to fit the diagram to your viewing area you can use the Zoom To Fit button on the Code Map Toolbar:
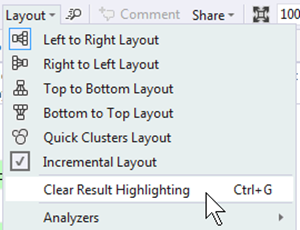
NOTE: Whenever you add nodes the most recently added ones will be in green. If this annoys you, you can clear the green color by going to to Layout on the Code Map Toolbar and selecting Clear Result Highlighting or by pressing CTRL + G:
You can see the legend by going to the Code Map Toolbar:
You can hover your mouse over any node to get more detail and/or you can double-click any node to see the code associated with it:
Note the green arrow beside the node you are currently viewing. This is just like the map in the mall that says, “You are here.” It is meant to clearly show where in the codebase you are examining. The arrow only shows up on nodes when the editor cursor is in the code underlying them:
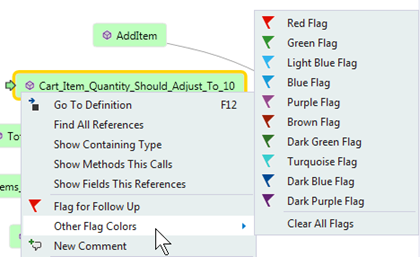
You can also flag nodes using a variety of colors to indicate some type of action needs to be taken:
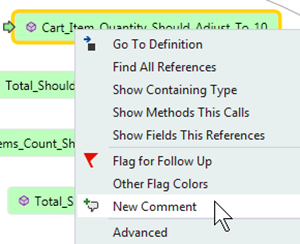
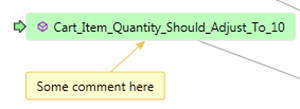
If you need to have more detail, you can add comments to any node by right-clicking the node and selecting New Comment:
Sharing Code Maps
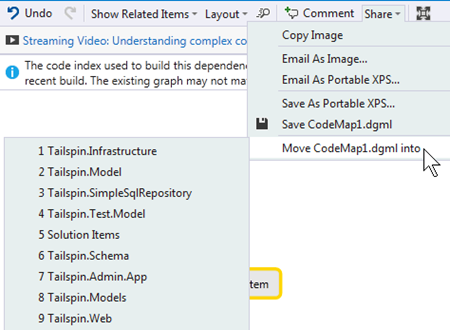
At some point you will want to share the Code Map with others. If you want the diagram to travel with source control you can move the diagram to an existing project by going to Share on the Code Map Toolbar and moving the map file to an existing project:
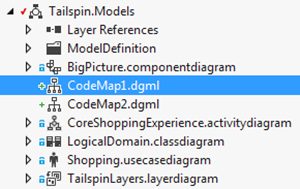
You will see it show up in your project after you move it:
Attaching the diagram to your source code is the optimal option but you can also choose one of the other methods from the Share button on the toolbar as well to share with others.
Finally
As you can see there is quite a bit to using Code Map and it is a great way to get a handle on complex code bases. I hope you like this feature as much as I do.
