The Immediate Window: Running WinDbg and SOS (Son of Strike) Commands
Keyboard: CTRL + ALT + I
Menu: Debug -> Windows -> Immediate
Command: Debug.Immediate
Versions: 2008,2010
Published: 9/30/2010
Code: vstipTool0097
Make sure to check out the Windows Phone Developer Portal!
I could take a long time to teach you about WinDbg and SOS (Son of Strike) so I will avoid that here. I want to give you a quick view into how SOS works in the Immediate Window. If you want to get hardcore with debugging then the absolute best places to learn are these two blogs:
John Robbins over at Wintellect: https://www.wintellect.com/CS/blogs/jrobbins/default.aspx
Tess Ferrandez an ASP.NET Escalation Engineer at Microsoft: https://blogs.msdn.com/b/tess/
Loading SOS In The Immediate Window
With that said, let's take a look at what it takes to get SOS going in the Immediate Window. As we go along I will also show you the most common messages you will encounter when trying to set this up. First, open the Immediate Window (CTRL + ALT + I) and put in ".load sos" then press ENTER.
x86
You will most likely get this message:
"SOS not available while Managed only debugging. To load SOS, enable unmanaged debugging in your project properties."
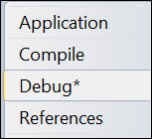
The fix is, obviously, to go to your project properties (the Debug tab):
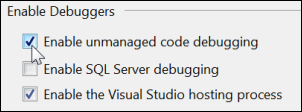
and enable unmanaged debugging:
Now go back to the Immediate Window and type ".load sos" again. It may take a few seconds but eventually you will see this message (your version will be different based on the CLR being used):
x64
If you get this message:
"Error during command: extension C:\Windows\Microsoft.NET\Framework64\v4.0.30319\sos.dll could not load (error 193)"
Then that means you are attempting to debug an x64 (64 bit) application. There is no support for interop (managed / unmanaged) debugging on x64 currently in Visual Studio. You can fix this by going to the project properties (Compile tab) and clicking on the "Advanced Compile Options" button:
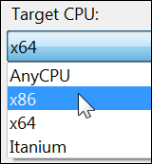
Then change the "Target CPU" to x86:
Using SOS
Threads and Symbols
You can now get all kinds of great information. Type "!threads" to see threading info:
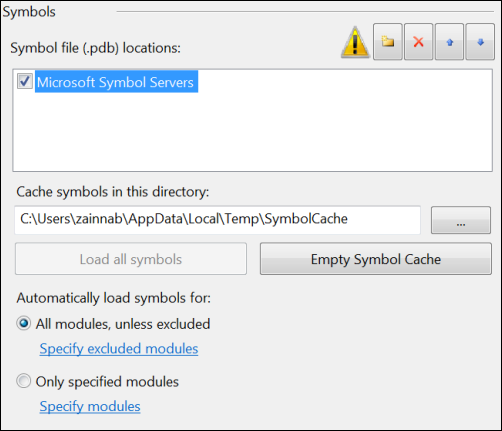
Do you see the error that says "PDB symbol for clr.dll not loaded"? This is a common error that is trying to tell you that you need to get symbols (https://en.wikipedia.org/wiki/Debug_symbol). The easiest way to do this is to go to Tools -> Options -> Debugging -> Symbols and check the "Microsoft Symbol Servers" box in the symbol file locations area:
Dump the Managed Heap
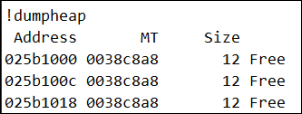
You can dump the managed heap by typing "!dumpheap". Just watch out as this is pretty verbose output by default:
Current Thread Call Stack
If you want to display the call stack for the current thread you can use "!clrstack". Here is a sample of the output:
These are just a few of the commands you can use. You can get as deep or as shallow into this as you want but the moral of this story is you can run WinDbg and SOS commands from the Immediate Window. Very cool stuff!
