Setting a Tracepoint in the Call Stack Window
Command: EditorContextMenus.CodeWindow.Breakpoint.InsertTracepoint
Versions: 2008,2010
Published: 2/6/2010
Code: vstipDebug0009
In a previous tip I showed you a classic technique of setting a Breakpoint in the Call Stack Window. The only problem with that is Breakpoints tend to be somewhat intrusive if all you want is information. So I thought it would be fun to show how to set a Tracepoint:
1. First set a Breakpoint deep in series of calls to get a nice call stack
NOTE: if you don't have that handy just make a bunch of methods called One, Two, Three, etc.. and have them call each other like I have in these examples.
2. Run your code and let it stop at the Breakpoint.
3. Bring up your Call Stack Window (CTRL + ALT + C or Debug -> Windows -> Call Stack)
4. Right-click on some place in the stack you would like to set a Tracepoint and go to Breakpoint -> Insert Tracepoint.
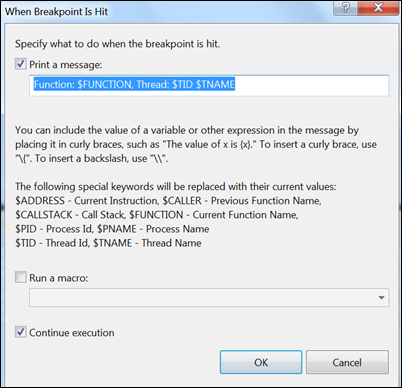
5. You get the Tracepoint dialog box:
6. You definitely want to get up to speed on the details of Tracepoints if you aren't familiar with them but for now just click OK.
7. Now we get our Tracepoint (note the diamond glyph):

8. Press F5 to continue the program and let the call stack unwind.
9. Now bring up your Output window (Debug -> Windows -> Output) and notice the trace buried in there:
And there you go. Tracepoints in your call stack. Good times :)


