Ask Learn
Preview
Ask Learn is an AI assistant that can answer questions, clarify concepts, and define terms using trusted Microsoft documentation.
Please sign in to use Ask Learn.
Sign inThis browser is no longer supported.
Upgrade to Microsoft Edge to take advantage of the latest features, security updates, and technical support.
Note
Access to this page requires authorization. You can try signing in or changing directories.
Access to this page requires authorization. You can try changing directories.
The WPF and Silverlight platforms use late bound data binding resolution for bindings in XAML files. This feature allows a DataContext to be set at run-time and the objects within that DataContext to resolve their property bindings then. This late binding enables cool features like DataTemplates, composable applications and run-time loading of loose XAML.
A side effect of late bound binding resolution that can cause developers some minor frustration is that their controls do not display the expected data at run-time.
This article will explain troubleshooting techniques that can help you locate and correct the problem.
Data binding is fundamental to WPF and Silverlight. You will struggle with your application designs, coding and troubleshooting until you understand data binding in these platforms.
The best data binding resource available is the MSDN Data Binding Overview topic. If you have not read or don't fully understand the material in this topic, please take the required amount of time to learn this material.
Visual Studio 2010 has great tooling to wire up data bindings and checked them at design-time. Please read this article: How to Enable Using the Binding Builder in WPF and Silverlight Applications.
Visual Studio 2010 has excellent design-time sample data support. If you use design-time sample data, you'll immediately see controls that don't have expected data values at design-time.
For a detailed examination of sample data in the WPF and Silverlight Designer for Visual Studio 2010, please read this article: Sample Data in the WPF and Silverlight Designer.
This tip is along the lines of, "if the TV won't turn on, check that it's plugged in."
This is important for many reasons, but one is easily overlooked; if a DataContext is null, the Debug Output Window will not display any error messages in Silverlight or in WPF.
In WPF you can use the below PresentationTraceSources on a binding and set the TraceLevel to High to view errors related to a null DataContext.
If you have the DataContext set, any data bindings within that DataContext that can't be resolved will be listed in the Debug Output Window at run-time.
Sample One
System.Windows.Data Error: 40 : BindingExpression path error: 'FirstName' property not found on 'object' ''Object' (HashCode=62178992)'. BindingExpression:Path=FirstName; DataItem='Object' (HashCode=62178992); target element is 'TextBox' (Name=''); target property is 'Text' (type 'String')
Sample Two
System.Windows.Data Error: 40 : BindingExpression path error: 'FirstName' property not found on 'object' ''Customer' (HashCode=13640894)'. BindingExpression:Path=FirstName; DataItem='Customer' (HashCode=13640894); target element is 'TextBox' (Name=''); target property is 'Tag' (type 'Object')
While the above messages look verbose and complex, you can glean several interesting points of information that will help you correct this data binding:
Important |
Data binding property path names are Case Sensitive. |
Important |
The default value of the WPF Trace Settings, Data Binding is "Error." It is recommended that you change this setting to "Warning." Please read this short blog post for more information. This is required if you use the attached property PresentationTraceSources.TraceLevel. If the value is set to "Error" you won't see any of the PresentationTraceSources.TraceLevel warning messages. |
To change the WPF Trace Settings, Data Binding value to "Warning," navigate to Tools, Options, Debugging, Output Window, WPF Trace Settings, Data Binding and set the value to Warning as I've done in the below image.

Note |
This setting affects all bindings in WPF the application. For a more targeting approach, see the PresentationTraceSources.TraceLevel section below. |
Important |
If this setting is set to, "Off" you will not see any WPF Data Binding Errors in the Debug Output Window. |
Introduced to WPF in .NET 3.5 SP1, the PresentationTraceSources.TraceLevel attached property allows developers to dial up the amount of information outputted in the Debugger Output Window for a binding.
The below XAML snippet shows how to apply the PresentationTraceSources.TraceLevel attached property to a binding.
 <Window
    xmlns:diag="clr-namespace:System.Diagnostics;assembly=WindowsBase"
    xmlns:local="clr-namespace:DebugDataBindings"
    x:Class="DebugDataBindings.MainWindow"
    xmlns="https://schemas.microsoft.com/winfx/2006/xaml/presentation"
    xmlns:x="https://schemas.microsoft.com/winfx/2006/xaml"
    Title="MainWindow" Height="350" Width="525">
    <Grid x:Name="layoutRoot">
        <Grid.Resources>
            <local:DebugConverter x:Key="debugConverter" />
        </Grid.Resources>
        <TextBox
            Text="{Binding Path=Customer.FirstName, diag:PresentationTraceSources.TraceLevel=High}"
            Height="23" HorizontalAlignment="Left" Margin="90,18,0,0" VerticalAlignment="Top" Width="120"/>
    </Grid>
</Window>
If the above suggestions to do not solve your problem:
Open the QuickWatch dialog, change the Expression to the named control in the XAML and look at the control's DataContext property.
This information will at least confirm the shape (Type) of the DataContext and the values inside the DataContext.
This tip provides value in two ways:
If the DataContext had been set then subsequently changed by some other code, you'll be expecting the initial value but will see another value
If the property was nested within another class, you can easily see the shape of your DataContext and then ensure that your bindings are properly dotted in.
Notice the path to the FirstName property is DataContext.Customer.FirstName.
This means that if you wanted to data bind to the Text property on a TextBox that was a child of the Grid named layoutRoot, the binding expression must read:
<TextBox Text="{Binding Path=Customer.FirstName}" ... />

If you are binding to a CLR object, put a breakpoint in the source property getter to see that it's actually being queried.
If it's not be queried, you have a mismatch in the property name, property is not properly dotted in, DataContext is null or does not contain this property.
Important |
The use of a converter to troubleshoot a data binding only works if the DataContext is not null, and the DataContext Type exposes a property with the same name in the binding expression. |
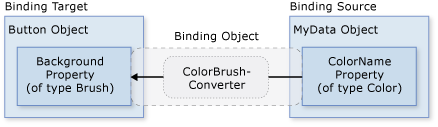
A ValueConverter allows you to view the data as its being moved between the target and source. In the below image the converter in the middle is named "ColorBrushConverter."
The below converter is a no-op converter named, "DebugConverter." This reusable converter will allow you to place a breakpoint in the Convert and ConvertBack methods and then view the value of the "value" parameter at debug time.
 using System;
using System.Windows.Data;

namespace DebugDataBindings {
    public class DebugConverter : IValueConverter {

        public Object Convert(Object value, Type targetType, Object parameter, System.Globalization.CultureInfo culture) {

            //set a breakpoint here
            return value;
        }

        public Object ConvertBack(Object value, Type targetType, Object parameter, System.Globalization.CultureInfo culture) {

            //set a breakpoint here
            return value;
        }
    }
}
The below XAML show the above converter being applied to the TextBox.Text property binding.
 <Grid x:Name="layoutRoot">
        <Grid.Resources>
            <local:DebugConverter x:Key="debugConverter" />
        </Grid.Resources>
        <TextBox Text="{Binding Path=Customer.FirstName, Converter={StaticResource debugConverter}}"
            Height="23" HorizontalAlignment="Left" Margin="90,18,0,0" VerticalAlignment="Top" Width="120"/>
    </Grid>
Microsoft values your opinion about our products and documentation. In addition to your general feedback it is very helpful to understand:
Thank you for your feedback and have a great day,
Karl Shifflett
Expression Team
Anonymous
July 07, 2010
Hi Karl,
Great article,
I am surprised you did not mention "Snoop" for debugging bindings.
Up to me this is best option to debug a binding and I use snoop in 99% of cases when I need to debug a binding or see why some part of UI behaves as it behaves.
I would be very greatful if someone can point to similar tool for debugging silverlight UI/bindings..
Thanks,
Kirill
Anonymous
July 08, 2010
Thanks for the tip Kirill.
Have a great day,
Karl
Anonymous
July 13, 2010
Just a small remark about the DebugConverter: In cases like this I find that it is better to do "System.Diagnostics.Debugger.Break();" instead of manually setting breakpoints. That way the breakpoints will not interfere with my "real" breakpoints in the breakpoint window.
Anonymous
July 14, 2010
Henrik Söderlund,
Thank you for your tip.
Have a great day,
Karl
Ask Learn is an AI assistant that can answer questions, clarify concepts, and define terms using trusted Microsoft documentation.
Please sign in to use Ask Learn.
Sign in