Rejoice! We can now capture loopback traffic.
Hey guys, Jeff here.
I work on a lot of networking cases, and the last thing I
ever want to hear is that a customer’s application is using local network
traffic - either by using the loopback address, 127.0.0.1, or just the public IP
address but the client and server both reside on the same machine.
Most tools, like Wireshark and Netmon aren’t able to capture
data that didn’t actually go out on the wire. Windows is smart enough that it
doesn’t send traffic destined for itself all the way down the stack to the
wire. There have been a few tools that allowed you to capture loopback data,
but nothing with the weight of the Windows product team behind them.
Until now. Message Analyzer
is the eventual replacement to Network
Monitor and offers lots of new capture features. The one I am talking about
today is the local/loopback capture.
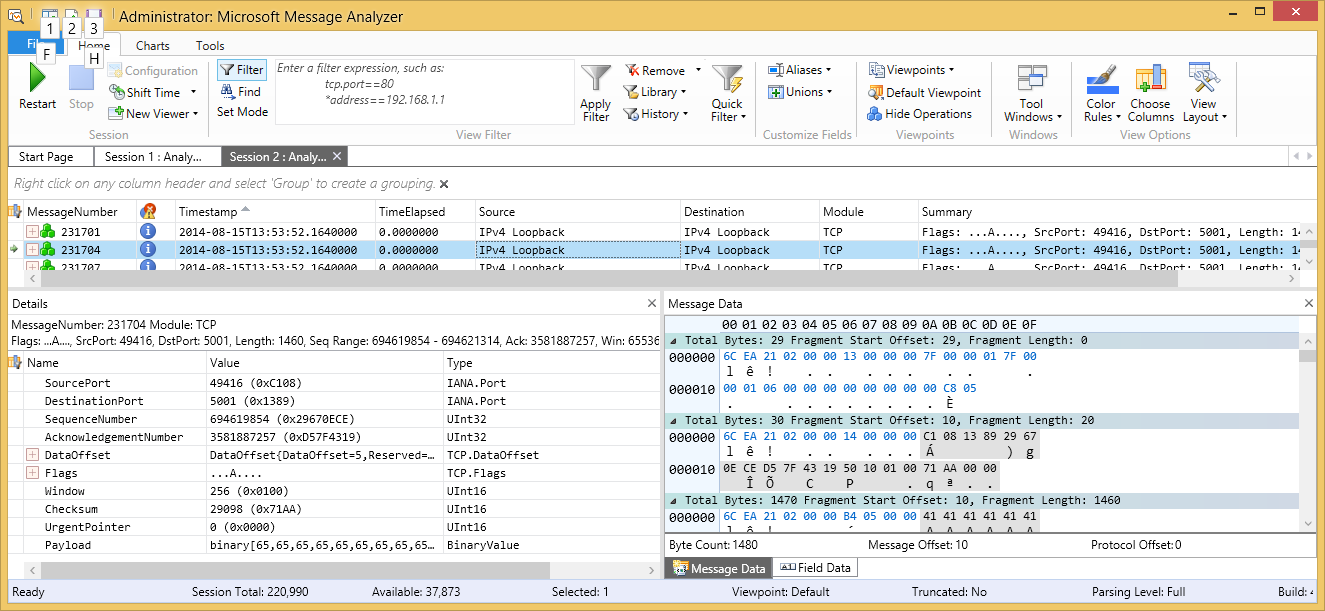
Here we can see that it knows the source and destination
addresses are the loopback address, 127.0.0.1
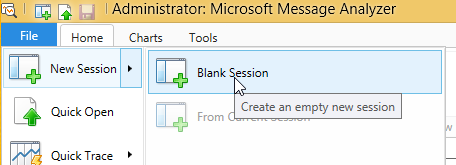
To capture loopback traffic, open Message Analyzer, and
create a New Blank Session.
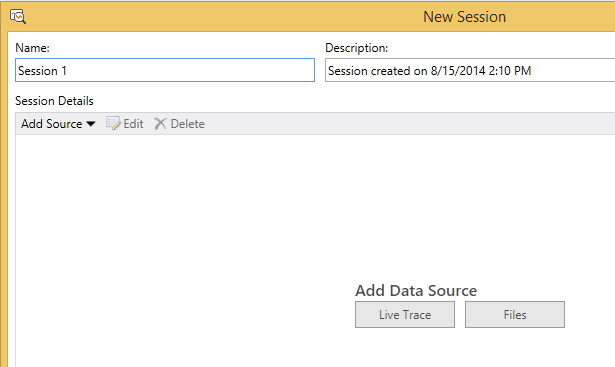
On the next screen, we get to choose if we are going to
start a live capture or open some files. Click Live Trace.
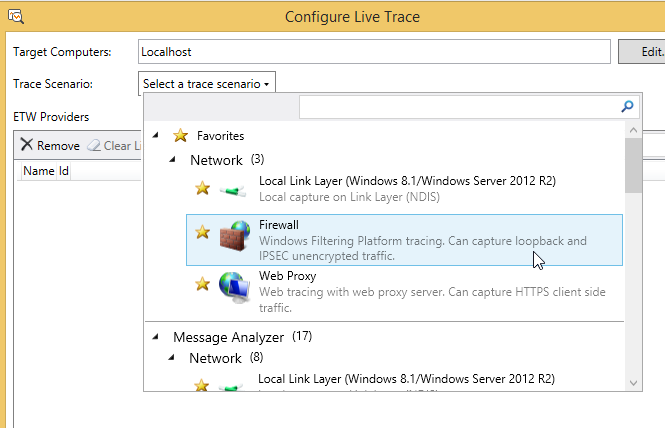
To get the loopback traffic, we are going to use the
Firewall provider. Add it and click OK, then click Start on the New Session
dialog.
That’s all there is to capturing local loopback traffic now.
Happy Capturing!
Follow us on Twitter, www.twitter.com/WindowsSDK.