WinDbg Preview 1.0.14.0 Release Notes
Hi Everyone!
We’re back and rolling out our first major update since TTD was announced! We’ve loved reading through your tweets, feedback, and blog posts about it. Don’t forget to read through the feedback hub and upvote the requests that you like! If you hit any issues with this build, don’t hesitate to leave a comment or submit it in the Feedback Hub.
WinDbg Preview
Better process server experience
WinDbg’s handling of process server (DbgSrv) remotes tends to be confusing around what is actually being debugged, and WinDbg Preview would disconnect from remotes a bit more often than is convenient. We’ve added a notification in the File menu to show what process server you’re connected to and interacting with.
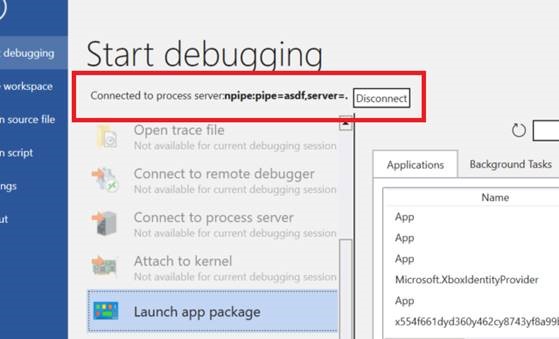
As part of this, when ending a debugging session, the process server connection will persist and can be disconnected in the File menu.
New default layout options
We’ve added a “Layouts” option in the “View” ribbon. There are currently three layouts: the default, one focused on disassembly, and one minimal. We’re looking for feedback on if these layouts are useful or if they could be changed to be more valuable.
Minor changes and bug fixes
- Fixed formatting of conditional ribbon tabs to be less confusing.
- Re-worked DML to be stricter in parsing to improve performance.
- Various fixes with the performance and behavior of ctrl+F.
- Added a warning when running un-elevated prior to trying to use TTD.
- Added the option to override automatic target bitness detection.
- Disabled various file menu and ribbon options when they can’t be used (like “Go” when in a dump file).
Time Travel Debugging
We’ve been hard at working fixing some bugs and prioritizing your feedback, so we only have a few time travel debugging updates for this release.
One key piece of feedback we need more data on is this one. We are looking at many ways for recording TTD traces without installing WinDbg, but we want to learn more about how you want to record before deciding on a solution. Anyone interested in that can comment on that feedback (or this post) to let us know why you want a standalone TTD recorder, why WinDbg doesn’t work for you or how you would use a TTD recorder differently than WinDbg.
Time Travel Debugging ribbon
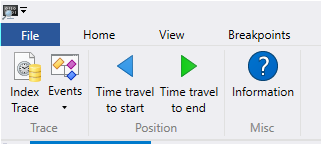
We’ve added a slightly more advanced Time Travel ribbon that will show up when debugging a time travel debugging trace. We’ll be growing this ribbon over time, so send us feedback if you have something you think should be added to this ribbon.
Known issues
- SOS will not work on x86 traces.
JavaScript and Data Model
We have some API changes here, and the updates haven’t made it 100% to the official JavaScript documentation on MSDN quite yet, so this is out of sync with the official documentation.
Metadata from JavaScript scripts
JavaScript extensions can now return metadata for properties and other constructs. This means that the extension can provide help strings, indicate the display radix for values, and more. Metadata is provided by placing a metadata descriptor on an object via either presence of [Symbol.metadataDescriptor] or an explicit call to host.metadata.defineMetadata. Function returns, iterated values, and other value contexts can return metadata for their value via host.metadata.valueWithMetadata.
JavaScript API updates
Some potentially source level breaking changes were made to the APIs within the JavaScript provider (including new projected methods and properties on native objects). Existing extensions will not see any of the potentially breaking changes without indicating that they support a new version of the JsProvider API. Support for the new API version is indicated by placing a host.apiVersionSupport record in the array returned by initializeScript with a claim of supporting version 1.1. maybe? .. with a value indicating support for version 1.1.
Changes in API version 1.1 include:
- host.getModuleSymbol and host.getModuleType return null if they cannot find the symbol instead of throwing an exception.
- All native objects have the address property on them in addition to .targetLocation. If the object does not have an address, an exception will be thrown when accessing the property.
- All native objects have new .getObjectValue and .setObjectValue methods on them to access properties on the object which may conflict with names JavaScript places on the object (e.g.: ‘address’) .
Other changes
There’s many other bug fixes and improvements, here are the notable ones:
- JavaScript extensions can now add and remove properties on data model objects via Object.defineProperty and the delete operator. Adding or registering a JavaScript class as a parent model or type signature is still the strongly preferred way of manipulating the object model.
- JavaScript extensions can now modify global variables within modules in the debug target through a new host.setModuleSymbol API.
- All of the math functions which are on the 64-bit library type (e.g.: .add, .subtract, .multiply, .divide, etc…) are now present on JavaScript numbers as well.
- JavaScript functions and properties can now return values which are enums through custom marshaling. A function or property accessor can return host.typeSystem.marshalAs(value, type…) in order to evoke such custom marshaling.
- The breakpoint command in the script debugger can now break on function names in addition to line/column positions.
- Type objects in JavaScript extensions have access to their containing module through the .containingModule property.
As always, if anything is unclear, or if you have any comments, feel free to leave them below!
-Andy