Ask Learn
Preview
Ask Learn is an AI assistant that can answer questions, clarify concepts, and define terms using trusted Microsoft documentation.
Please sign in to use Ask Learn.
Sign inThis browser is no longer supported.
Upgrade to Microsoft Edge to take advantage of the latest features, security updates, and technical support.
Note
Access to this page requires authorization. You can try signing in or changing directories.
Access to this page requires authorization. You can try changing directories.
Hi Everyone!
We’re back and rolling out our first major update since TTD was announced! We’ve loved reading through your tweets, feedback, and blog posts about it. Don’t forget to read through the feedback hub and upvote the requests that you like! If you hit any issues with this build, don’t hesitate to leave a comment or submit it in the Feedback Hub.
WinDbg’s handling of process server (DbgSrv) remotes tends to be confusing around what is actually being debugged, and WinDbg Preview would disconnect from remotes a bit more often than is convenient. We’ve added a notification in the File menu to show what process server you’re connected to and interacting with.
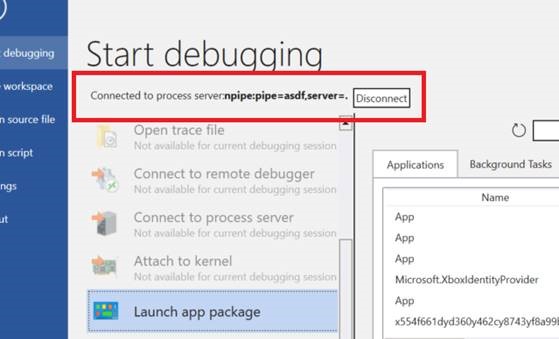
As part of this, when ending a debugging session, the process server connection will persist and can be disconnected in the File menu.
We’ve added a “Layouts” option in the “View” ribbon. There are currently three layouts: the default, one focused on disassembly, and one minimal. We’re looking for feedback on if these layouts are useful or if they could be changed to be more valuable.
We’ve been hard at working fixing some bugs and prioritizing your feedback, so we only have a few time travel debugging updates for this release.
One key piece of feedback we need more data on is this one. We are looking at many ways for recording TTD traces without installing WinDbg, but we want to learn more about how you want to record before deciding on a solution. Anyone interested in that can comment on that feedback (or this post) to let us know why you want a standalone TTD recorder, why WinDbg doesn’t work for you or how you would use a TTD recorder differently than WinDbg.
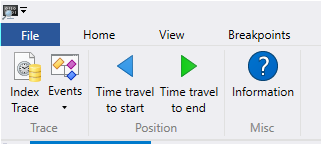
We’ve added a slightly more advanced Time Travel ribbon that will show up when debugging a time travel debugging trace. We’ll be growing this ribbon over time, so send us feedback if you have something you think should be added to this ribbon.
We have some API changes here, and the updates haven’t made it 100% to the official JavaScript documentation on MSDN quite yet, so this is out of sync with the official documentation.
JavaScript extensions can now return metadata for properties and other constructs. This means that the extension can provide help strings, indicate the display radix for values, and more. Metadata is provided by placing a metadata descriptor on an object via either presence of [Symbol.metadataDescriptor] or an explicit call to host.metadata.defineMetadata. Function returns, iterated values, and other value contexts can return metadata for their value via host.metadata.valueWithMetadata.
Some potentially source level breaking changes were made to the APIs within the JavaScript provider (including new projected methods and properties on native objects). Existing extensions will not see any of the potentially breaking changes without indicating that they support a new version of the JsProvider API. Support for the new API version is indicated by placing a host.apiVersionSupport record in the array returned by initializeScript with a claim of supporting version 1.1. maybe? .. with a value indicating support for version 1.1.
Changes in API version 1.1 include:
There’s many other bug fixes and improvements, here are the notable ones:
As always, if anything is unclear, or if you have any comments, feel free to leave them below!
-Andy
Ask Learn is an AI assistant that can answer questions, clarify concepts, and define terms using trusted Microsoft documentation.
Please sign in to use Ask Learn.
Sign in