Rambling … instrumentation and sampling, why I prefer the former
Continued from Rambling … loops and multi-processing. When things literally slow down…
While riding on the bus today, i decided to test both sampling and instrumentation to try and figure out some of the anomalies we discussed in previous “ramblings” posts. While sampling proved to be the most efficient and had the least impact on the test application, the instrumentation profiling resulted in a more meaningful report, in my humble opinion. However, the instrumentation not only slowed down the overall application, but changed the behaviour of the application … TestOne() was suddenly quicker than TestZero() as originally expected, while TestThree() was suddenly the slowest of all, which was puzzling. To complete the tests while on the bus, I reduced the test cycles to 5,000,000 iterations for each test run, which explains the improved times when using sampling :)
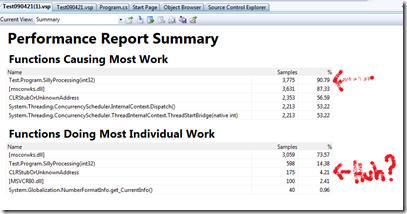
Sampling – Default Report
 … personally I dislike ‘unknown’ stuff.
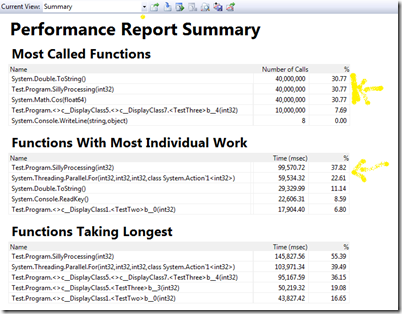
Instrumentation – Default Report
The instrumented performance session ran an average of ten (10) times slower than its sampling counter part. Unlike sampling, the instrumented session missed nothing … the instruction pointer was never left alone or out of view.
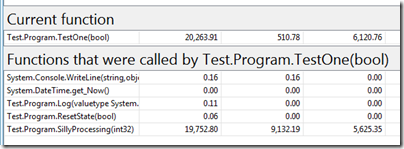
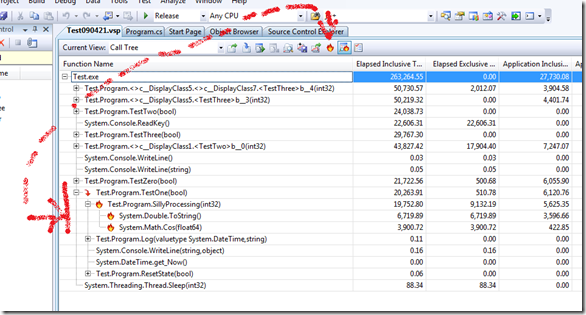
 … ToString() and the Cos() functions were the main culprits as expected
 … as designed, SillyProcessing(0 hogged the processing.
 Conclusion
It all started with a simple question by my son as per blog Rambling … why is my dual processor colleague not twice as fast?, diverted to Rambling … loops and multi-processing. When things literally slow down… and after this rambling we should be done once and for all …
So what have we gathered in a nutshell and in my personal opinion?
- Most importantly, don’t loose too much sleep over a question … it leads to theses excursions :)
- If have to run a stress test, don’t do it on the bus … people think you are weird just staring at a laptop, hardly ever touching the keyboard.
- Doubling the iron (the processor, etc.) does not necessarily double your processing speed and throughput.
- Use prototyping to evaluate hardware upgrades, parallelism and other program changes, “before” you get the sales and marketing staff all excited.
- Instrumentation is a lot more intuitive that sampling. The latter remind me checking up on my boys … they always behave when I check (“sample”), but I get the feeling that when I turn my back, all hell breaks loose in their worlds.
- Instrumentation can generate huge performance files … in my case 60G+ per file =:|
- VSTS 2008 has some cool performance analysis tools … with amazing stuff coming with 2010. If you own the tools, experiment with them and use them!
- Try the following features when you next have a chance:
- Using mark names to bookmark positions in a performance tracing session
- Sampling versus instrumentation options
- Comparing performance sessions … exceptional to test latest changes to a codebase and the impact on performance
- Filtering the performance reports using criteria such as between bookmark X and bookmark Y.
- Changing the root of a tree, removing the unnecessary clutter
- Using the hot path to guide you through the performance data jungle … great helper!
- … so much more, but best experienced by using it yourself.
- If I had not seen the 2010 enhancements, I would have given the 2008 performance tools


 stars …, but instead


 /5 will have to describe a great tool for the time being.
- Try the following features when you next have a chance:
I have had enough of processors and threads for a while. Signing off and suspending this series of rambling for the time being. Hope you enjoyed the journey :)
