SDLC – Software Development Lifecycle … designing the blueprint (part 7 of many)
Continued from SDLC – Software Development Lifecycle … analyzing the battle ahead (part 6 of many).
Overview
 During the previous phase, analysis, we communicated, we documented and we visualised. The meetings, the exploration, the observations, the surveys and the expert consultancy has hopefully not only created an analysis domain representing different points of view of the business requirements, but most importantly clarifies the requirements. At this stage we are entering the design world and need to ensure that inconsistencies, omissions and misunderstandings are minimised, if not eradicated … if we are unsure, it is the right time to cycle back, for another iteration of analysis.
We should share one common vision and a visual model of the business requirements. We are one …
Deliverable Chunks
 The design phase is the phase that most of us dream of … it allows us to take a whiteboard, like an artist would take a new sheet of paper, and start modelling and designing the solution.
The design should be based on well known and proven principles, concepts, blueprints and practices. Experience and well proven patterns create solid and usually maintainable solutions, just like the sowing patterns allow factories to create high quality clothes, again and again. Giving a factory the green light to experiment with new knitting machines, material and styles would most likely result in a drop in production, drop in quality and rise in production costs … with little reproducibility and predictability. Now imagine giving systems analysts and especially developers the same freedom …
During the design we take the analysis artefacts, which document the “big picture”, and drill down into the detail, defining subsystems, interaction, communication, security and interfaces, etc. We define the detail of the solution to be developed, the blueprint that will allow the developers, the integrators and the testers to build the ultimate business solution.
I personally love simplicity and visualisation, so my recommendations would be to:
- Keep it simple!
- Visualize as much as possible and shred the thesis!
- Aim for low coupling (minimise dependency on others) and high cohesion (focused on core responsibilities).
- Did I mention simplicity and visualisation?
The possible (not comprehensive list) artefacts mentioned in the analysis post included:
Data Models
Use Cases
Use Case Diagram
Universal Modelling Language (UML ) Diagrams, including Activity, State, Class and Sequence diagram
Data Flow Diagram (DFD)
Class Responsibility Collaborator (CRC) Model
… and more!
The artefacts emerging from the refinement of analysis artefacts include:
- Architecture design
- Subsystem design
- User interface design, including technical, navigation and graphical user interface (GUI) design
- Diagrams
- Collaboration
- Activity
- Sequence
- Component
- Deployment
- … and lots more
Listing all the deliverables of the analysis and design phases is way beyond the scope of this post. What we are trying to emphasise are the core visualization deliverables (models), so that we can draw some conclusions as to the value-add of VSTS 2010.
Once again we investigate Team Foundation Server (TFS) and Visual Studio team System (VSTS) in this world
To avoid looking for our helmets, we will assume that we are in a VSTS 2010 world, where the emergence of the new architecture edition and tools brings great relief. Again invest a peek at previous posts Rosario 2010 CTP2 Agile Planning, Design, Reviewing a Solution and A close encounter with Sequence Diagram to get an idea of what is coming and the breath of support for visualisation and modelling, or better download the latest Community Technology Preview (CTP) and have a critical look yourself.
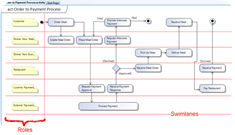
The diagrams introduced and supported with CTP2 include:
- Activity diagram
- Visualise the workflow through a system
- Use Case diagram
- Visualise the interaction between users (actors) and the system
- Sequence diagram
- Visualise the sequence of interaction between users (actors) and the system
 Component diagram
- Visualise the functional division of a system
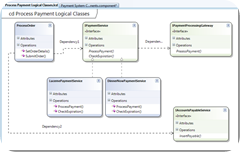
- Logical Class diagram
- Class diagram
- Visualise the classes and interfaces, as well as relationships within a project
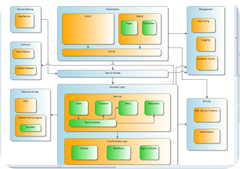
 Layer diagram (see below)
- Visualise the various pieces of a system and their dependencies
- The layer diagram, as shown, reminds me of the old system, application and deployment diagram, but closer inspection reveals a visualisation tool that is really exciting:
- Not only can we finally visualise the main areas and layers of our solution, but also enjoy code association and code validation, which is an exceptional solution review and solution maintenance feature.
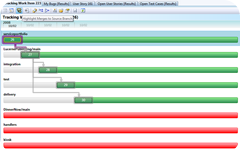
- Branching diagram
- Architecture Explorer
- Visualise the various pieces of a system and their dependencies
- Models
- Cass view
- Solution view
- UML Model view
- Visualization by …
- Assembly
- Namespace
- Class
What, if anything, is missing in terms of modelling in your opinion? Is the UML deployment diagram essential? What UML diagram would you add to the mix?

Next?
With the analysis and design efforts complete, we will explore architecture and testing .. but more on that the next time :)

