How to load test and get profiling results from a Web API hosted in a Windows Azure Cloud Service
This article describes how you can:
1. Create a simple Web API in Visual Studio 2013 with some bad peforming code
2. Host it on a Windows Azure cloud service
3. Create a load test and run it first locally and then cloud-based (new feature of Team Foundation Service)
4. Get profiling information from the Windows Azure cloud service in order to prove the bad peforming code
5. Scale your cloud service and compare the load test against a baseline.
First, create a new ASP.NET Web API project in Visual Studio 2013. Change the .NET Framework version from 4.5.1 to 4.5, because otherwise you will get warnings when publishing to Windows Azure (4.5.1 is not yet available at the time of writing this post)
Updated the ValuesController with the following code. (Note there is some real bad peforming code like string concatination)
public class ValuesController : ApiController
{
[HttpGet]
[ActionName("SlowMethod")]
public string SlowMethod()
{
string s = "";
for (int i = 0; i < 7000; i++)
{
s += "test";
}
return "SlowMethod";
}
[HttpGet]
[ActionName("FastMethod")]
public string FastMethod()
{
string s = "";
for (int i = 0; i < 10; i++)
{
s += "test";
}
return "FastMethod";
}
[HttpGet]
[ActionName("VerySlowMethod")]
public string VerySlowMethod()
{
string s = "";
for (int i = 0; i < 50000; i++)
{
s += "test";
}
return "VerySlowMethod";
}
[HttpGet]
[ActionName("VeryFastMethod")]
public string VeryFastMethod()
{
return "VeryFastMethod";
}
}
Next, change the WebApiConfig so that each method can be mapped correctly to an action on the controller
config.Routes.MapHttpRoute(
name: "DefaultApi",
routeTemplate: "api/{controller}/{action}/{id}",
defaults: new { id = RouteParameter.Optional }
);
In Visual Studio, right click the project and select Add Windows Azure Cloud Service. As a result, a new azure project is added.
Add a couple of additional performance counters by editing the diagnostics.wadcfg file (under BadPerformanceService.Azure\BadPerformanceServiceContent)
<!--Added the following counters-->
<PerformanceCounterConfiguration counterSpecifier="\Processor(_Total)\% Processor Time" sampleRate="PT30S" />
<PerformanceCounterConfiguration counterSpecifier="\Process(w3wp)\% Processor Time" sampleRate="PT30S" />
<PerformanceCounterConfiguration counterSpecifier="\Process(w3wp)\Private Bytes" sampleRate="PT30S" />
<PerformanceCounterConfiguration counterSpecifier="\Process(w3wp)\Thread Count" sampleRate="PT30S" />
<PerformanceCounterConfiguration counterSpecifier="\.NET CLR Interop(_Global_)\# of marshalling" sampleRate="PT30S" />
<PerformanceCounterConfiguration counterSpecifier="\.NET CLR Loading(_Global_)\% Time Loading" sampleRate="PT30S" />
<PerformanceCounterConfiguration counterSpecifier="\.NET CLR LocksAndThreads(_Global_)\Contention Rate / sec" sampleRate="PT30S" />
<PerformanceCounterConfiguration counterSpecifier="\.NET CLR Memory(_Global_)\# Bytes in all Heaps" sampleRate="PT30S" />
<PerformanceCounterConfiguration counterSpecifier="\.NET CLR Networking(_Global_)\Connections Established" sampleRate="PT30S" />
<PerformanceCounterConfiguration counterSpecifier="\.NET CLR Remoting(_Global_)\Remote Calls/sec" sampleRate="PT30S" />
<PerformanceCounterConfiguration counterSpecifier="\.NET CLR Jit(_Global_)\% Time in Jit" sampleRate="PT30S" />
<PerformanceCounterConfiguration counterSpecifier="\ASP.NET\Request Execution Time" sampleRate="PT3M"/>
<!--End -->
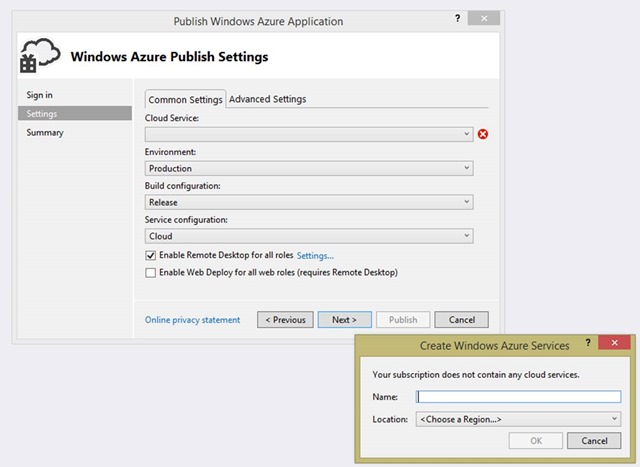
Right click project and choose Publish to Windows Azure. Import your publish profile file.
Create a cloud service (name it something like badperformancewebapi) and enable remote desktop if you want.
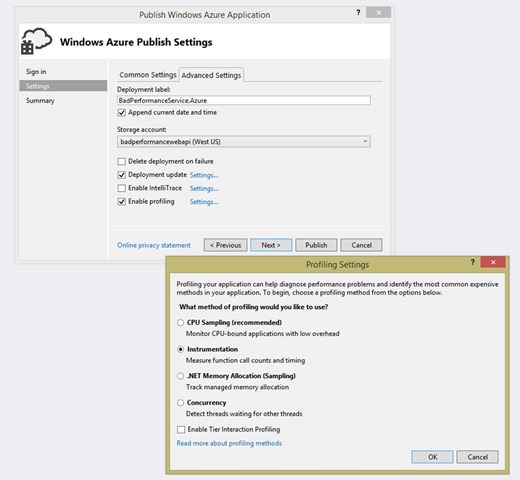
In the advanced settings, check Enable Profiling and Instrumentation
Publish the cloud service and wait for it to complete.
13:20:52 - Checking for Remote Desktop certificate...
13:20:53 - Preparing deployment for BadPerformanceService.Azure - 10/10/2013 13:20:39 with Subscription ID 'xxxx' using Service Management URL 'https://management.core.windows.net/'...
13:20:53 - Connecting...
13:20:53 - Verifying storage account 'badperformancewebapi'...
13:20:54 - Uploading Package...
13:58:02 - Creating...
13:59:26 - Created Deployment ID: a55622d386774ff1b70cbc2fc5c683a5.
13:59:26 - Instance 0 of role BadPerformanceService is creating the virtual machine
13:59:29 - Starting...
13:59:48 - Initializing...
14:00:21 - Instance 0 of role BadPerformanceService is starting the virtual machine
14:01:59 - Instance 0 of role BadPerformanceService is in an unknown state
14:02:30 - Instance 0 of role BadPerformanceService is busy
14:03:02 - Instance 0 of role BadPerformanceService is ready
14:03:02 - Created Website URL: https://badperformancewebapi.cloudapp.net/
14:03:02 - Complete.
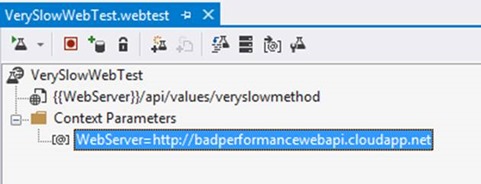
Next, create one or more web tests. In my case, I created 4 separate web tests (one for each method) and parameterized the web server. This allows you to run the test either locally or in the cloud
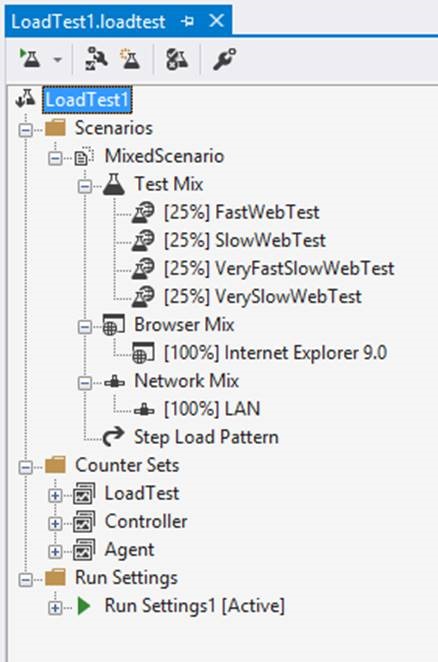
The load test simply combines the 4 web tests, but if necessary you can create another mix of tests. (Step load pattern 10 up to 200 users, all from 1 machine)
Run the load test against the cloud service and wait for it to complete.
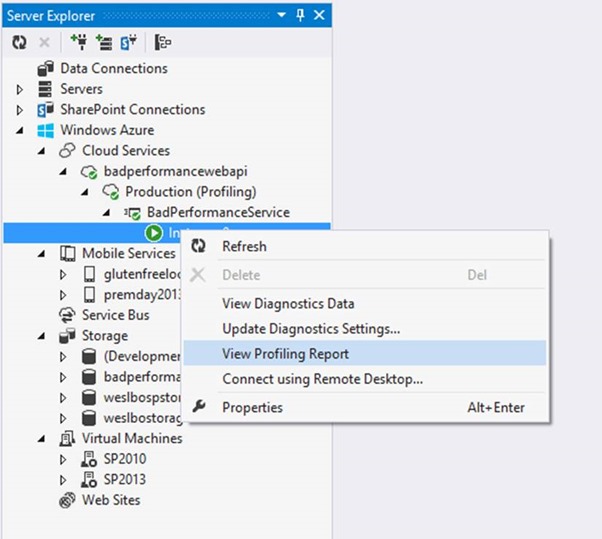
A profiling session is created for each instance of the role in your cloud service. To view your profiling reports of each session from Visual Studio, you can view the Server Explorer window and then choose the Windows Azure node to select an instance of a role. You can then view the profiling report as shown in the following illustration.
Please be aware that it can take a while until the profiling report becomes available.
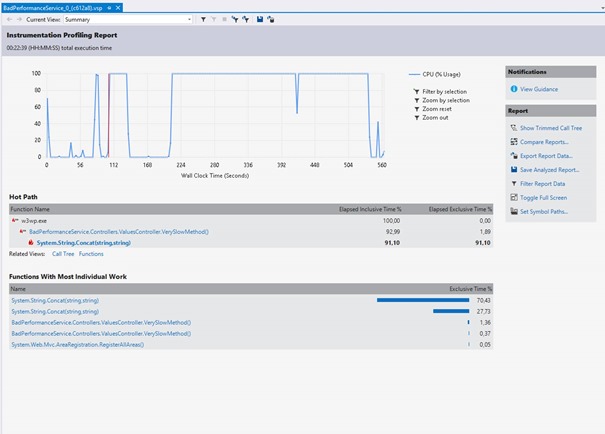
And voilà, here is the report that allows you to drill down in the different hotpaths.
Right now the load test is all running from your local machine. Your machine becomes a bottleneck as soon as you add more users to the test. You can run the same load test in the cloud, allowing you to scale the number of tests and users.
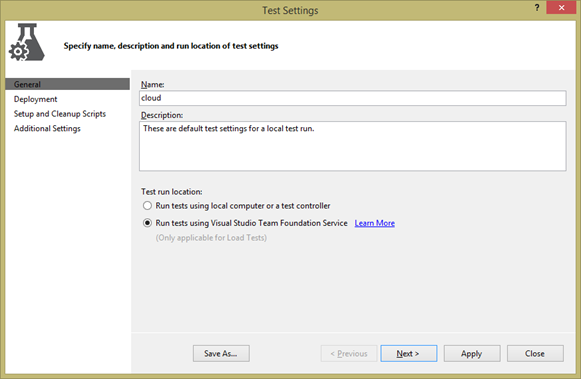
Create a new test settings file (cloud.testsettings) and choose to run the tests using Visual Studio Team Foundation Service
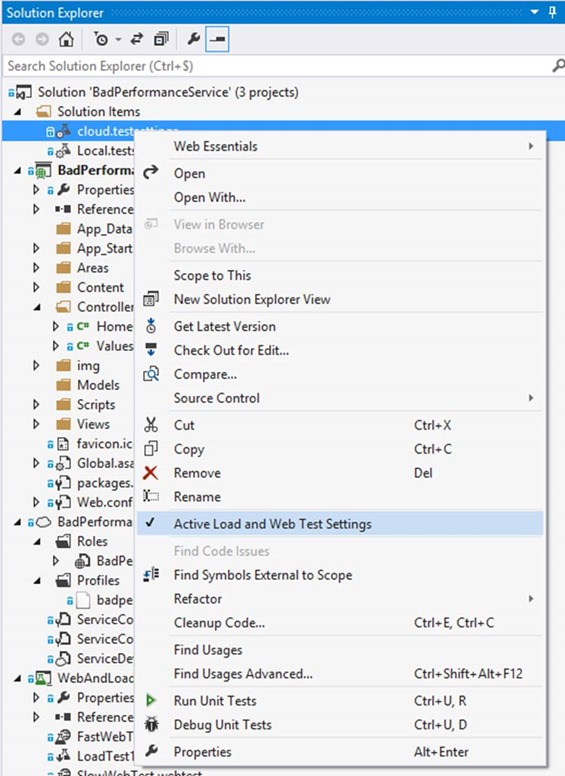
Make sure you are connected to your Team Foundation Service project and make sure that the cloud test settings file is the active one. (right click your settings file)
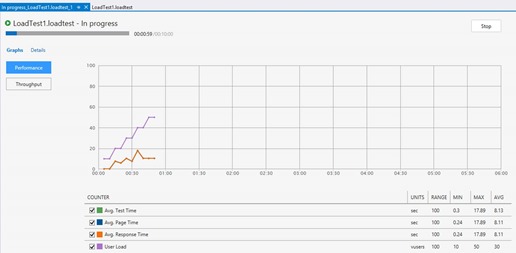
Run the load test and notice how the UI is different compared to a local load test. Wait for it to finish (or stop it) and then wait for the collection results.
Then, download and view the report to further diagnose the response time. Alternatively, you can download once more the profiling report from the Windows Azure Cloud Service.
Scale your cloud service and compare the load test against a baseline.
In order to test whether adding more servers (scaling) to your cloud service will indeed increase the performance, follow these steps:
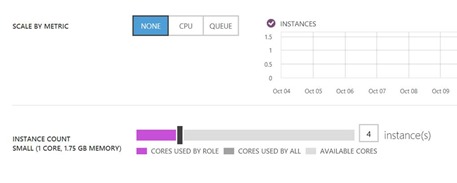
1. Confirm you have only 1 SMALL Windows Azure Cloud Service instance (1 CORE, 1.75 GB MEMORY)
2. Run a cloud load test for 10 minutes.
3. Scale up the environment (for example add a couple of instances) and wait for it to finish.
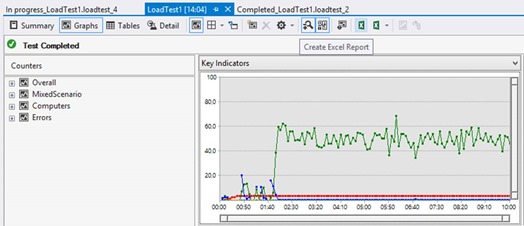
4. Re-run the cloud load test for 10 minutes and download the report
5. Create an excel report (click the toolbar icon)
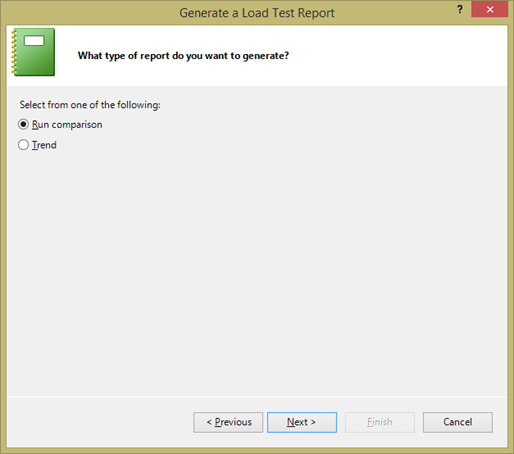
6. Choose to run a comparison
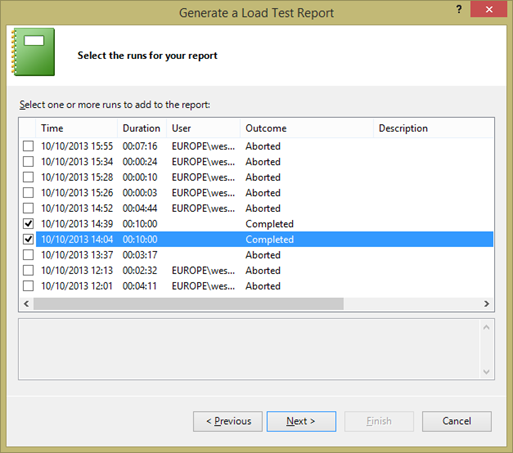
7. Choose the 2 load tests
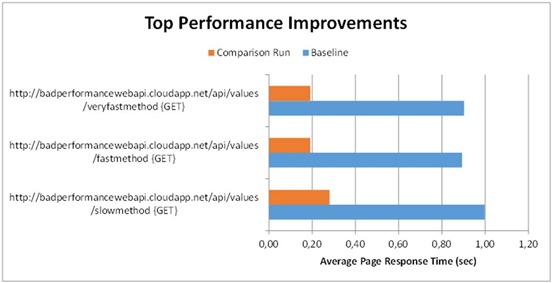
Now you can explore the generated excel file and confirm your performance problem is solved by scaling up. OK, we still might need to get rid of the string concatenation in the code :-)
