New Release for the New Year!
I hope everyone has had a wonderful holiday season! We have released our two new features, please look below to learn more about the work our team has focused on over the last few months.
Our deployment went live with the new Reporting and Data Subscription Features highlighted below! Please visit https://winqual.microsoft.com.
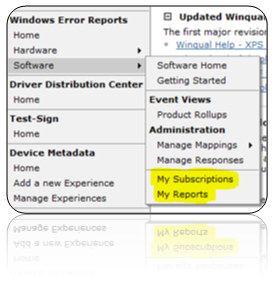
And select the My Reports or Data Subscription link from:
Previous information about features: https://blogs.msdn.com/wer/archive/2008/12/02/happy-holiday-s.aspx
Windows Error Reporting > Software > My Subscriptions
Windows Error Reporting > Software > My Reports
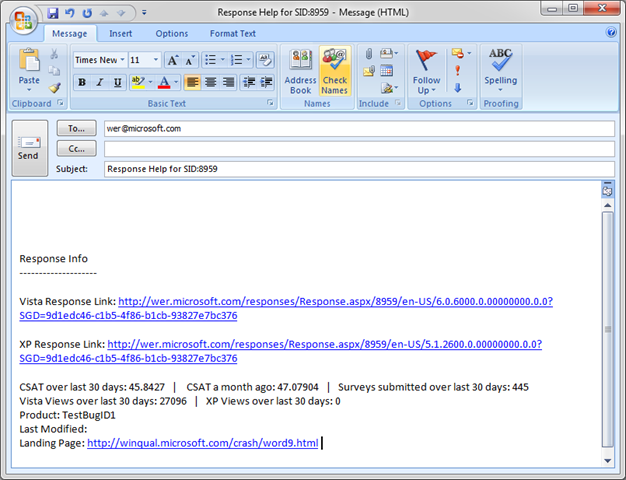
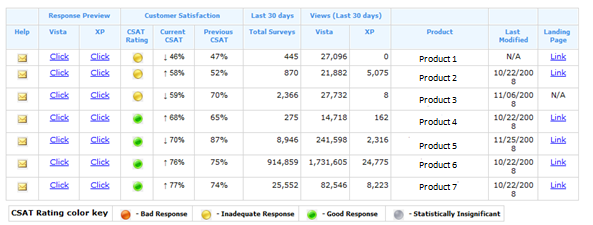
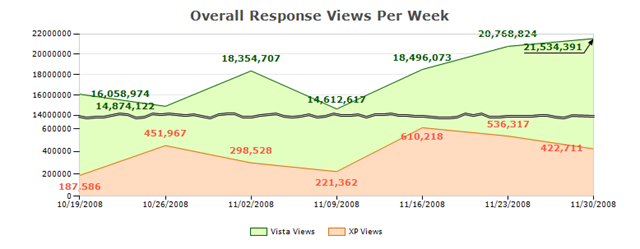
The first ISV report that we have created shows ISV's their overall response quality and the amount of times people have viewed and submitted survey results.
Features:
- Help: A help link that will let ISV's request help from our team quickly, by including the current information about a particular response:

- Preview of Vista and XP Responses:
- Overall CSAT rating indicator:
 Bad - a response that offers an immediate 'fix', this corresponds to a customer satisfaction rating less than 50% . For a response that does not provide an immediate 'fix', this corresponds to a customer satisfaction rating less than 40% .
 Inadequate - For a response that offers an immediate 'fix', this corresponds to a customer satisfaction greater than 75% . For a response that does not provide an immediate 'fix', this corresponds to a customer satisfaction rating greater than 60% .
 Good - For a response that offers an immediate 'fix', this corresponds to a customer satisfaction greater than 75% . For a response that does not provide an immediate 'fix', this corresponds to a customer satisfaction rating greater than 60% .
 Statistically Insignificant - This corresponds to a response that has had less than 30 user surveys submitted in the last 30 days.
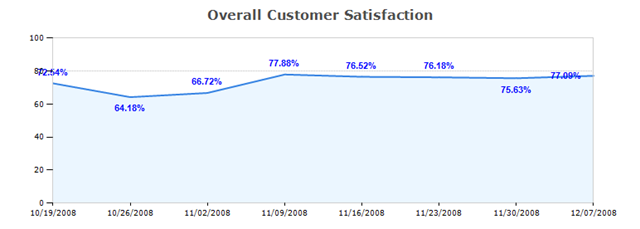
- Current CSAT: Take the Users survey results and apply this formula for the last 30 days:
[Yes this helped me] / ([No this didn't help me] + [This somewhat helped me]) - Previous CSAT: Use same formula above but for the 30 days prior to the Current CSAT
- Total Surveys: Total number of survey's submitted
- Vista & XP Views (Last 30 days): Number of customers who have viewed the response and on which OS.
- Product Name: The product name this response is targeting
- Last Modified: Date this response was last modified
- Landing page: The URL for the landing page users will be directed to.