OpsMgr: Sample Object Health Dashboard with “RAINBOW Bar” Columns
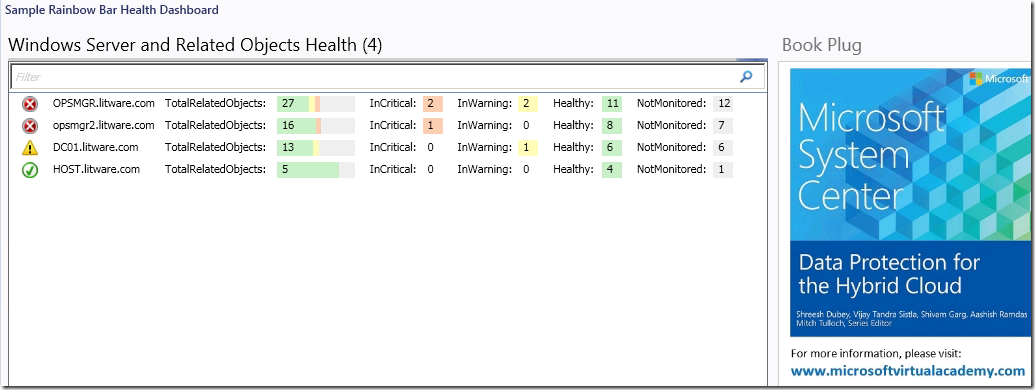
This article features another sample dashboard that consist of a state widget with Rainbow Bar columns created from a custom column generator component. In each row, there is a monitored server object, the total number of its related monitoring objects, how many of these objects are in Critical state, Warning state, Healthy or Not Monitored.
I also added a book plug with this summary dashboard to help spread the word about this free e-book:
Microsoft System Center Data Protection for the Hybrid Cloud, authored by Shreesh Dubey, Vijay Tandra Sistla, Shivam Garg, and Aashish Ramdas with Mitch Tulloch as Series Editor.
For more information, please visit here.
The e-book can be downloaded from the Microsoft Virtual Academy here.
The management pack bundle (MPB) for this Sample Object Health Dashboard can now be downloaded from the TechNet Gallery.
The key component used here to generate the custom columns with “Rainbow Bars” per row is the “Microsoft.Exchange.15.Visualization.Components.Common.DataObjectColumnGenerator" component defined in the Microsoft Exchange Server 2013 Visualization Library management pack (Microsoft.Exchange.15.Visualization.Components).
This component is used within the Exchange 2013 Organization and Server Summary Dashboards. Here’s an example of what the Exchange 2013 Organization Dashboard looks like ( Current Version: 1.1.108.91 ):

Important Note:
The Microsoft Exchange Server 2013 Visualization Library management pack has a dependency on the main Microsoft Exchange Server 2013 Monitoring management pack, hence both management packs will need to be imported together if not already in order for the “Microsoft.Exchange.15.Visualization.Components.Common.DataObjectColumnGenerator" component to be available for use by other dashboards/widgets.
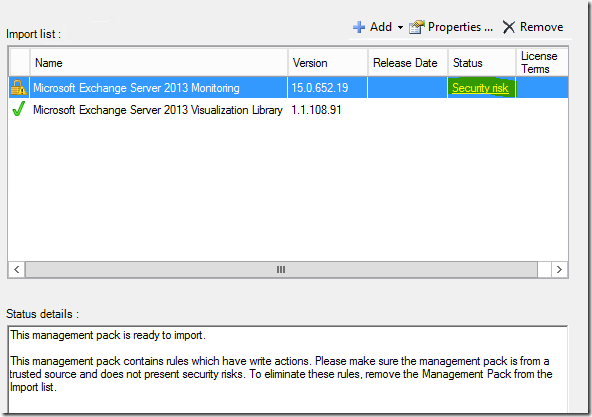
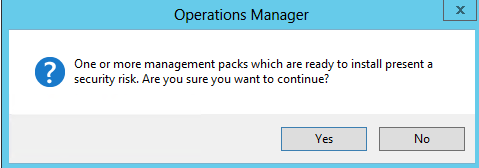
A warning message as follows will be presented for a final confirmation to import the Microsoft Exchange Server 2013 Monitoring management pack.
3 new Datasets will be created for Exchange 2013 in the data warehouse database.
Before MP Import:
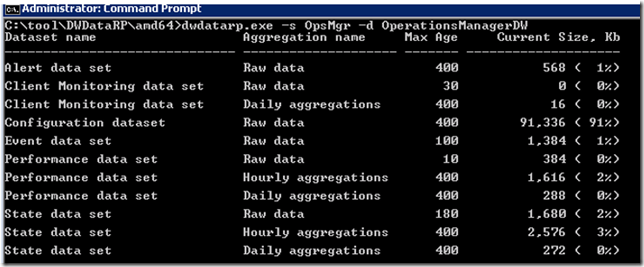
After MP Import:

Here is the PowerShell script used in the PowerShell Datasource component to retrieve health state of each of the objects related to the a server object, convert results to “RAINBOWDATA” type and return the collection to the column generator component of the State Widget:
#////////////////////////////////////////////////////////////////////////////////////////////////
$WindowsServerClass = Get-SCOMClass -Name "Microsoft.Windows.Server.Computer"
$serverObjects = Get-SCOMClassInstance -class $WindowsServerClass
$dataObjects = @()
$yellow = [double]0
$green = [double]0
$red = [double]0
$gray = [double]0
$white = [double]0
$all = [double]0
foreach ($serverObject in $serverObjects) {
$dataObject = $ScriptContext.CreateFromObject($serverObject, "Id=Id,HealthState=HealthState,Name=Name", $null)
if ($dataObject -ne $null) {
#Get & record the health state of each of the objects related to the a server object( Microsoft.Windows.Server.Computer )
$relatedItems = $serverObject.GetRelatedMonitoringObjects()
foreach ($relatedItem in $relatedItems)
{
If($relatedItem.HealthState.toString() -eq "Success"){$green++}
ElseIf($relatedItem.HealthState.toString() -eq "Warning"){$yellow++}
ElseIf($relatedItem.HealthState.toString() -eq "Error"){$red++}
ElseIf($relatedItem.HealthState.toString() -eq "Uninitialized"){$gray++}
Else
{
If($relatedItem.IsAvailable -ne $True){$white++}
}
}
$dataObject["TotalRelatedObjectField"] = "TotalRelatedObjects:"
$Overallstat = $ScriptContext.CreateInstance("RAINBOWDATA")
$Overallstat["GreenValue"] = $green
$Overallstat["YellowValue"] = $yellow
$Overallstat["RedValue"] = $red
$Overallstat["GrayValue"] = $gray
$Overallstat["Sum"] = $relatedItems.count
$dataObject["AppPoolCount"] = $Overallstat
#////////////////////////////////////////////////////////////////////////////////////////
Resulting Columns: 
#////////////////////////////////////////////////////////////////////////////////////////
$dataObject["CriticalRelatedObjectField"] = "InCritical:"
$Criticalstat = $ScriptContext.CreateInstance("RAINBOWDATA")
$Criticalstat["RedValue"] = $red
$dataObject["HealthStateCritical"] = $Criticalstat
#////////////////////////////////////////////////////////////////////////////////////////
Resulting Columns: 
#////////////////////////////////////////////////////////////////////////////////////////
$dataObject["WarningRelatedObjectField"] = "InWarning:"
$Warningstat = $ScriptContext.CreateInstance("RAINBOWDATA")
$Warningstat["YellowValue"] = $yellow
$dataObject["HealthStateWarning"] = $Warningstat
#////////////////////////////////////////////////////////////////////////////////////////
Resulting Columns: 
#////////////////////////////////////////////////////////////////////////////////////////
$dataObject["HealthyRelatedObjectField"] = "Healthy:"
$Healthystat = $ScriptContext.CreateInstance("RAINBOWDATA")
$Healthystat["GreenValue"] = $green
$dataObject["HealthStateHealthy"] = $Healthystat
#////////////////////////////////////////////////////////////////////////////////////////
Resulting Columns: 
#////////////////////////////////////////////////////////////////////////////////////////
$dataObject["GrayRelatedObjectField"] = "NotMonitored:"
$Graystat = $ScriptContext.CreateInstance("RAINBOWDATA")
$Graystat["GrayValue"] = $gray
$dataObject["HealthStateGray"] = $Graystat #////////////////////////////////////////////////////////////////////////////////////////
Resulting Columns: 
#////////////////////////////////////////////////////////////////////////////////////////
$white = [double]0
$gray = [double]0
$yellow = [double]0
$green = [double]0
$red = [double]0
$all = [double]0
}
$dataObjects += $dataObject
#///////////////////////////////////////////////////////////////////////////////////////
Columns: 
#//////////////////////////////////////////////////////////////////////////////// ///////
}
foreach ($dataObject in $dataObjects)
{
$ScriptContext.ReturnCollection.Add($dataObject)
}
#////////////////////////// Script End /////////////////////////////////
The RainbowData is a complexType with the following double typed elements:
<xs:complexType name="RainbowData" xmlns:sc="https://schemas.microsoft.com/SystemCenter/Common/TypeExtensions" xmlns:xs="https://www.w3.org/2001/XMLSchema">
< xs:sequence minOccurs="1" maxOccurs="1">
< xs:element name="WhiteValue" type="xs:double" />
< xs:element name="GreenValue" type="xs:double" />
< xs:element name="YellowValue" type="xs:double" />
< xs:element name="RedValue" type="xs:double" />
< xs:element name="GrayValue" type="xs:double" />
< xs:element name="Sum" type="xs:double" />
</xs:sequence>
< /xs:complexType>
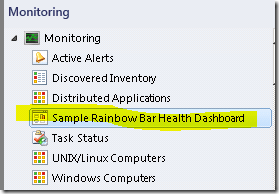
When the sample MP is imported into a OpsMgr 2012 environment, the summary dashboard will appear at the root of the Monitoring Workspace with display name as: Sample Rainbow Bar Health Dashboard:
When selected, a summary health dashboard that looks similar to the following example will be displayed:

Important Note:
The reason why column headers were not used for the state widget of the sample health dashboard was because the column generator was hardcoded to only display the strings defined in the Microsoft Exchange Server 2013 Visualization Library management pack on the headers of the columns generated.
Therefore, any other strings used for the column header names would not appear on the state widget, example as follows:

Here is the list of string resources and their corresponding display string that are defined in the Microsoft Exchange Server 2013 Visualization Library management pack:
| If StringResource ID is used: | Will display: |
| Microsoft.Exchange.15.Visualization.Components.HealthStateCriticalDisplayString | Critical |
| Microsoft.Exchange.15.Visualization.Components.HealthStateWarningDisplayString | Warning |
| Microsoft.Exchange.15.Visualization.Components.HealthStateHealthyDisplayString | Healthy |
| Microsoft.Exchange.15.Visualization.Components.HealthStateDescUnknownDisplayString | Unknown |
| Microsoft.Exchange.15.Visualization.Components.HealthStateDescNormalDisplayString | Pass |
| "Microsoft.Exchange.15.Visualization.Components.HealthStateDescErrorDisplayString | Fail |
| Microsoft.Exchange.15.Visualization.Components.AlertsTextDisplayString | alerts |
| Microsoft.Exchange.15.Visualization.Components.NewAlertsTextDisplayString | new |
| Exchange.15.Visualization.OrganizationGridData.HealthState | State |
| Exchange.15.Visualization.OrganizationGridData.InMaintenanceMode | Maintenance Mode |
| Exchange.15.Visualization.OrganizationGridData.Name | Organization |
| Exchange.15.Visualization.OrganizationGridData.AlertsCount | Alerts |
| Exchange.15.Visualization.OrganizationGridData.DagRainbow | DAGs |
| Exchange.15.Visualization.OrganizationGridData.ADSiteRainbow | AD Sites |
| Exchange.15.Visualization.OrganizationGridData.CasRainbow | CA Servers |
| Exchange.15.Visualization.OrganizationGridData.MbxRainbow | Mailbox Servers |
| Exchange.15.Visualization.OrganizationGridData.EtRainbow | ET Servers |
| Exchange.15.Visualization.OrganizationGridData.MbxDbCount | Mailbox Databases |
| Exchange.15.Visualization.OrganizationGridData.MailboxCount | Mailboxes |
| Exchange.15.Visualization.ServerGridData.HealthState | State |
| Exchange.15.Visualization.ServerGridData.InMaintenanceMode | Maintenance Mode |
| Exchange.15.Visualization.ServerGridData.Name | Name |
| Exchange.15.Visualization.ServerGridData.Organization | Organization |
| Exchange.15.Visualization.ServerGridData.ServerRole | Roles |
| Exchange.15.Visualization.ServerGridData.ADSite | AD Site |
| Exchange.15.Visualization.ServerGridData.Dag | DAG |
| Exchange.15.Visualization.ServerGridData.CAArray | CA Array |
| Exchange.15.Visualization.ServerGridData.NTServiceRainbow | Windows Services |
| Exchange.15.Visualization.ServerGridData.AppPoolCount | IIS Application Pools |
| Exchange.15.Visualization.ServerGridData.ServerResourcesHealthSetRainbow | Server Resources |
| Exchange.15.Visualization.ServerGridData.ServiceComponentsHealthSetRainbow | Service Components |
| Exchange.15.Visualization.ServerGridData.CustomerTouchPointsHealthSetRainbow | Customer Touch Points |
| Exchange.15.Visualization.ServerGridData.KeyDependenciesHealthSetRainbow | Key Dependencies |
| Exchange.15.Visualization.ServerGridData.AlertsCount | Alerts |
| Exchange.15.Visualization.ServerGridData.MbxDbCount | Mailbox Databases |
| Exchange.15.Visualization.ServerGridData.MbxCount | Mailboxes |
| Exchange.15.Visualization.ServerGridData.CpuUsage | CPU (%) |
| Exchange.15.Visualization.ServerGridData.MemoryUsage | Memory (MB) |
| Exchange.15.Visualization.ServerGridData.Version | Version |
| Exchange.15.Visualization.ServerGridData.IPAddress | IP Address |
| Exchange.15.TestObject.State | State |
| Exchange.15.TestObject.IntValue | Number |
| Exchange.15.TestObject.PercentBarValue | Blue cell |
| Exchange.15.TestObject.RainbowBarValue | Rainbow |
| Exchange.15.TestObject.DoubleValue | Double |
| Exchange.15.TestObject.StringValue | Status String |
| Exchange.15.TestObject.SecondStringValue | Second String |
Related post:
Sample OS Summary Dashboard with “Blue Bar” Columns
For more information about OpsMgr 2012 Dashboard Component Types and Implementations, go to: https://social.technet.microsoft.com/wiki/contents/articles/18657.operations-manager-management-pack-authoring-dashboards.aspx
Thank you for your support !