OpsMgr: Sample OS Summary Dashboard for Server Processor & Memory
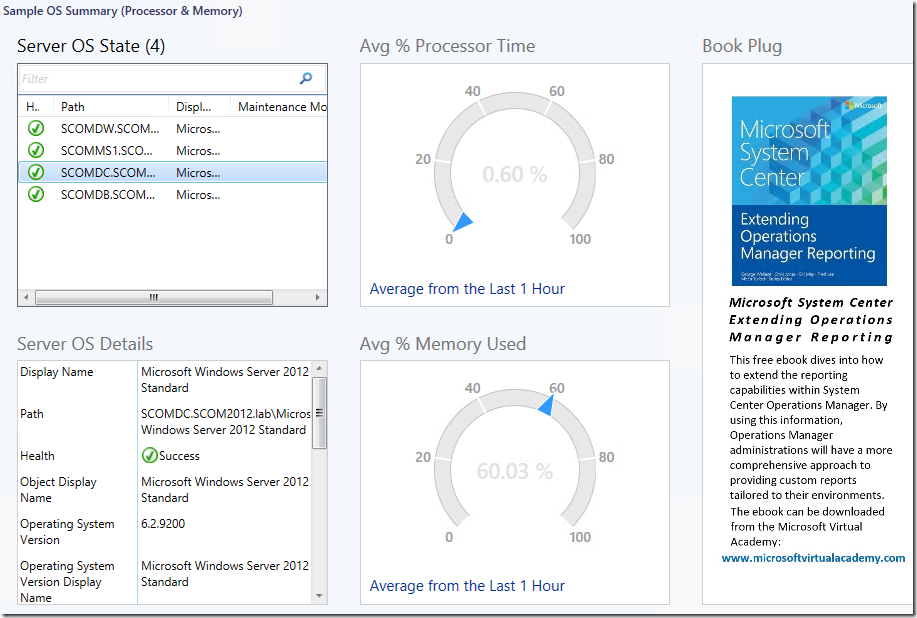
This article features an example of a dashboard, the Sample OS Summary Dashboard for Processor and Memory, that displays the health states of all monitored Windows Server OS instances, provides detail information and visualization on their average performance stats using speedometer gauges in a contextual manner.
I also want to use this sample dashboard as a book plug to help spread the word about this free ebook: Microsoft System Center: Extending Operations Manager Reporting, authored by George Wallace, Chris Jones, Bill May, and Fred Lee with Mitch Tulloch as Series Editor.
This ebook dives into how to extend the reporting capabilities within System Center Operations Manager. By using this information, Operations Manager administrations will have a more comprehensive approach to providing custom reports tailored to their environments. Learn how to create these custom reports and package them up in management packs for deployment.
The ebook can be downloaded from the Microsoft Virtual Academy here.
The Sample Management Pack Bundle (MPB) for the OS Summary Dashboard can be downloaded from the TechNet Gallery.

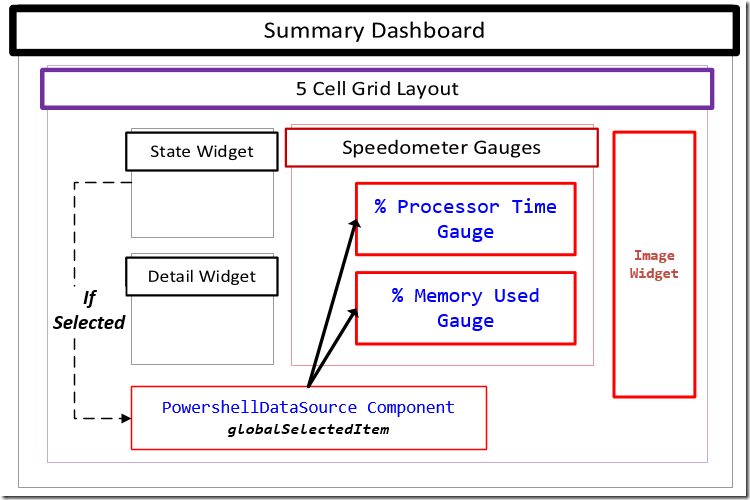
Here is a logical representation of the sample summary dashboard composition:

Here is the PowerShell script used in the PowerShell Datasource component to retrieve the average CPU and memory performance stats for the selected Windows Server object.
#////////////////////////////////////////////////////////////////////////////////////////////
Param($globalSelectedItems)
foreach ($globalSelectedItem in $globalSelectedItems) {
$selectedObject = $globalSelectedItem["DisplayName"]
$hostpath = $globalSelectedItem["Path"] #Get the server name
}
$class = get-scomclass -Name Microsoft.Windows.Server.OperatingSystem
#Look for OS instance of server
$selectedserverOS = Get-SCOMClassInstance -class $class | ? {$_.Path -ilike $hostpath}
$dataObject = $ScriptContext.CreateInstance("xsd://OSMEMPROC!val/stat")
$dataObject["Id"] = "ItemSelected"
$dataObject["Path"] = $hostpath
$aggregationInterval = 60
#Last 60 minutes (1hr)
$dt = New-TimeSpan -minute $aggregationInterval
$now = Get-Date
$from = $now.Subtract($dt)
#Note: theGetMonitoringPerformanceData retrieves data recorded in UTC. So you may need to add some extra lines in the script to handle that as some local times may be a future date and no data will be returned.
$perfRules = $selectedserverOS.GetMonitoringPerformanceData()
foreach ($perfRule in $perfRules)
{
#Get % Processor Time Stat
if($perfRule.CounterName -eq "% Processor Time") {
$data = $perfRule.GetValues($from, $now) | % { $_.SampleValue } | Measure-Object –Average
$CPUStat = [math]::round($data.Average,2)
$dataObject["CPUStat"] = $CPUStat
}
#Get % Memory Used Stat
if($perfRule.CounterName -eq "PercentMemoryUsed") {
$data = $perfRule.GetValues($from, $now) | % { $_.SampleValue } | Measure-Object –Average
$MemState = [math]::round($data.Average,2)
$dataObject["MemStat"] = $MemState
}
}
$ScriptContext.ReturnCollection.Add($dataObject)
#////////////////////////////////////////////////////////////////////////////////////////////
For more information about OpsMgr 2012 Dashboard Component Types and Implementations,
Go to: https://social.technet.microsoft.com/wiki/contents/articles/18657.operations-manager-management-pack-authoring-dashboards.aspx
Thank you for your support !