Azure Developers .NET Day is back on April 30th! Join the .NET community to learn cutting-edge cloud development techniques from experts on cloud services for AI, data, cloud-native, and developer productivity. Elevate your cloud development skills today!
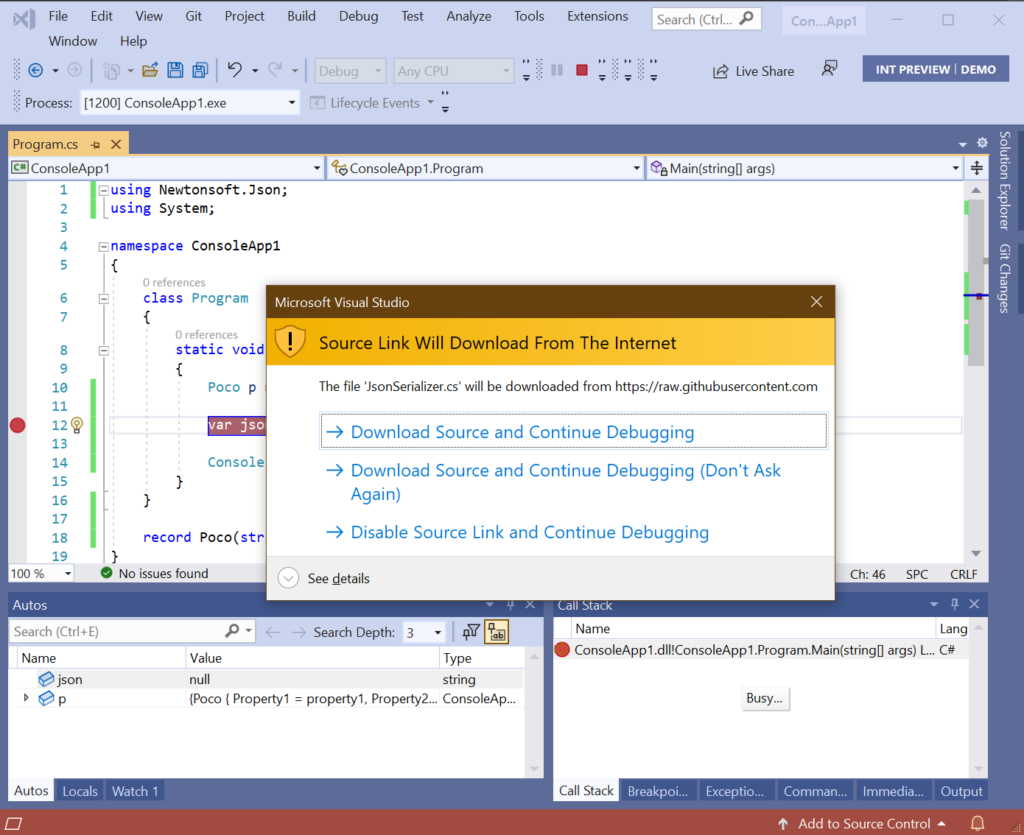
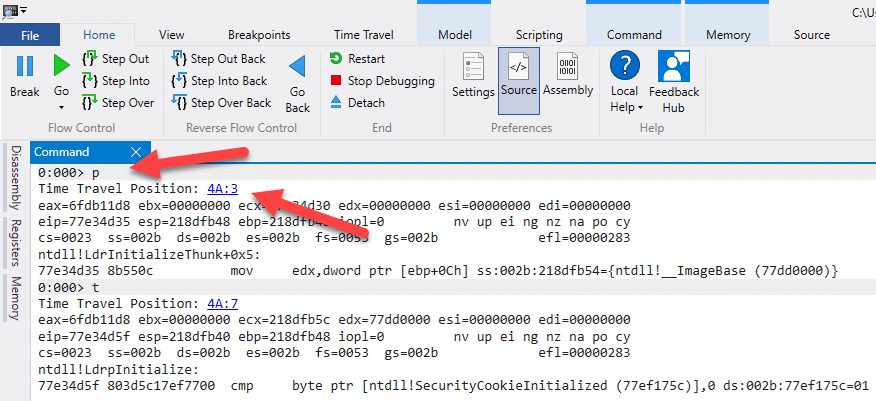
When you are debugging an application, there are many tools and techniques you can use, like logs, memory dumps and Event Tracing for Windows (ETW). In this post, we will talk about Time Travel Debugging, a tool used by Microsoft Support and product teams and more advanced users, but I encourage everyone to try this approach when diagnosing ...
In ASP.NET Core 2.1, we brought SignalR into the ASP.NET Core family. Many of our users have asked what this means for the previous version of SignalR: ASP.NET SignalR.
As a reminder, ASP.NET SignalR is represented by the NuGet package and runs on applications using .NET Framework and System.Web. ASP.NET Core SignalR is part of the ASP.NET ...
We’re always looking for ways to make developing with Visual Studio faster. One of the tasks developers do many times a day is launching debugging sessions. We identified that script debugging added about 1.5s per F5, but only about 15.5% of people actively debugged script using Visual Studio.
Based on the above, in Visual Studio 15.7 ...
Updated 2017/1/3 - Setting to control script debugging added. See below. Visual Studio 2017 RC now supports client-side debugging of both JavaScript and TypeScript in Google Chrome. For years, it has been possible to debug both the backend .NET code and the client-side JavaScript code running in Internet Explorer at the same time. ...
ASP.NET developers who deploy their code to Azure App Service have remote debugging features available from the Visual Studio Server and Cloud Explorer windows. ASP.NET 4x projects can be debugged live in App Service by simply right-clicking your Web, Mobile, or API Apps in Cloud Explorer and clicking the “Attach Debugger” action. Under ...
In the previous versions of ASP.NET it was possible to debug certain parts of the framework stack but setting up the development environment and compiling all the binaries was not the easiest task. ASP.NET 5 changes that and makes debugging framework code as easy as debugging your own application. This article shows how to debug into the ASP....
In VS2010 and VS2012, the edit and continue option is disabled by default when creating a new web application project. In VS2013 preview, we turned it on by default. You can find this option on the Web tab in the web project’s properties window.
(image)
With “Enable Edit and Continue” on, the VS debugger starts your...


 Light
Light Dark
Dark