
Exploring Azure App Service – Azure Diagnostics
If you’ve followed our previous posts about using Azure App Service to host web apps in the cloud (1. Introduction to App Service, 2. Hosting web apps that use SQL) you’re already familiar with how easy it is to get an app running in the cloud; but what if the app doesn’t work correctly (it’s crashing, running too slow, etc.)? In this post we’ll explore how to use Azure’s Application Insights to have always on diagnostics that will help you find and fix these types of issues.
Azure Application Insights provides seamless integration with Azure App Service for monitoring, triaging and diagnosing code-level issues. It can easily be enabled on an existing web app with a single button click. Profiler traces and exception snapshots will be available for identifying the lines of code that caused issues. Let’s take a closer look at this experience.
Enable Application Insights on an existing web app to investigate issues
We recommend you follow along using your own application, but if you don’t have one readily available we will be using the Contoso University sample. The instructions on how to deploy it to App Service are in the readme file.
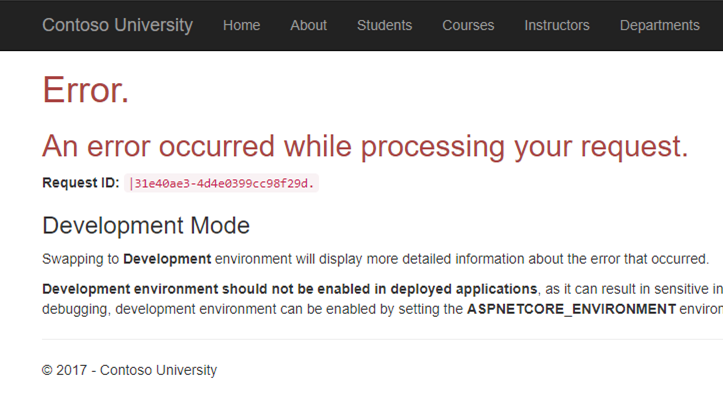
If you are following along with Contoso University, you will notice the Instructors page throws errors. In addition, the Courses tab loads a bit slower than others.
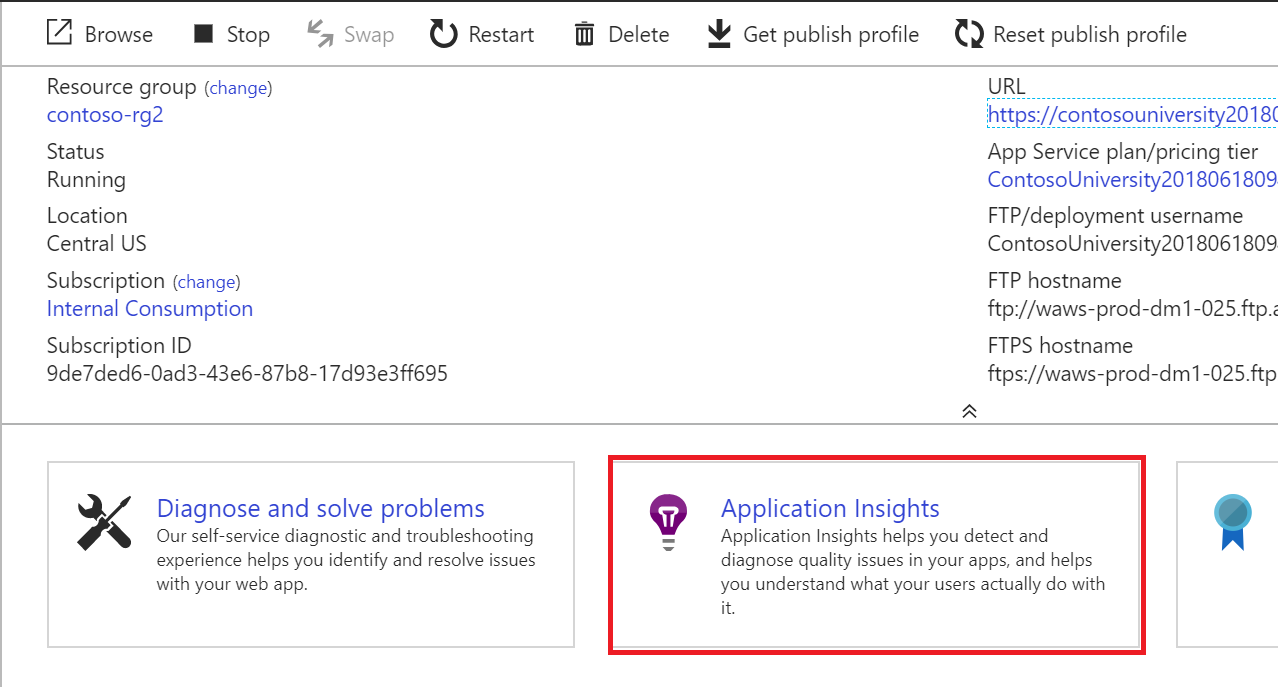
Let’s turn on Application Insights to investigate. After the app is deployed to App service, Application Insights can be enabled from the App Service portal by clicking the button on the overview blade:
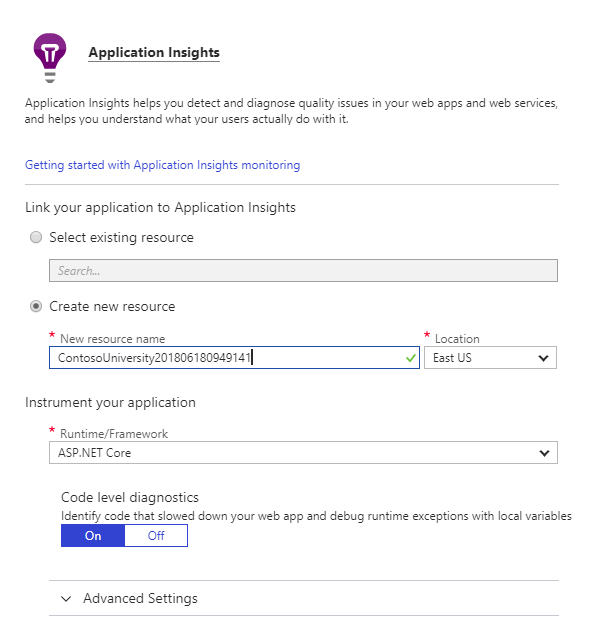
Fill out the Application Insights enablement blade the following way:
- Create a new resource, with an appropriate name.
- Leave all default options for Code-level diagnostics on. The added section Code level diagnostics is on by default to enable Profiler and Snapshot Debugger for diagnosing slow app performance and runtime exceptions.
- Click the ‘OK’ button. Once prompted if to restart the web app, click ‘Continue’ to proceed.

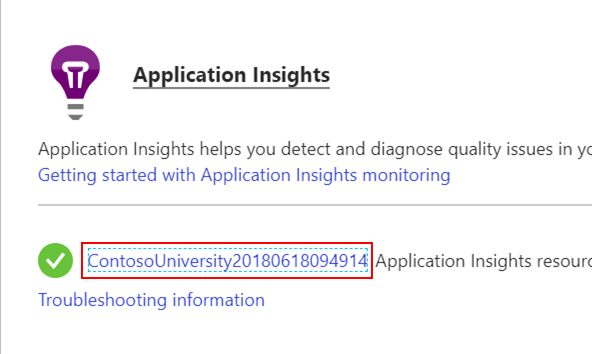
Once Application Insights is enabled, you will be able to see its connection status. You can now navigate to the Application Insights overview blade by clicking on the link next to the green check mark:

Generate traffic for your web app in order to reproduce issues
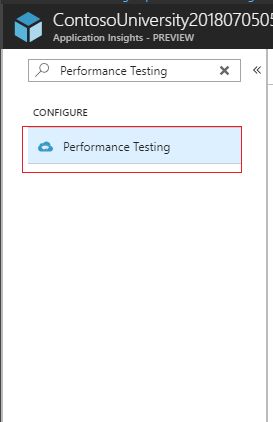
Let’s generate some traffic to reproduce our two issues: a) Courses page loading slowly, b) Instructors page throwing errors. You are going to use performance test with Azure portal to make requests to the following URLs:
- http://<your_webapp_name>.azurewebsites.net/Courses
- http://<your_webapp_name>.azurewebsites.net/Instructors
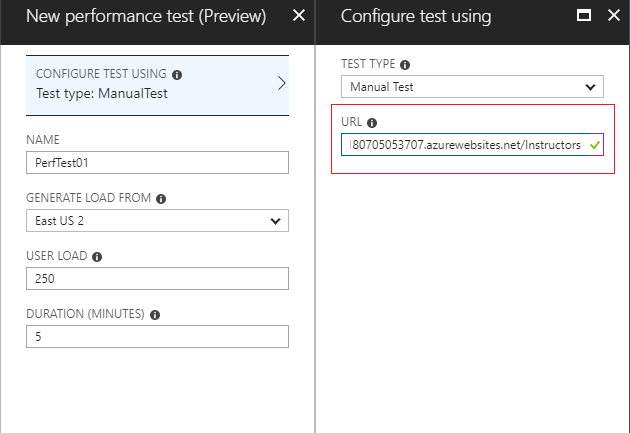
You are going to be creating two different performance tests, once for each URL. For the Courses page you are going to simulate 250 users over a duration of 5 minutes, since you are experiencing a performance issue. For the Instructors page you can simulate 10 users over 1 minutes since we’d generally expect less instructors than users on the site at any given time.
Profile your app during performance tests to identify performance issues
A performance test will generate traffic, but if you want to understand how you app performs you have to analyze its performance while the test is running using a profiler. Let’s do exactly that, using the Performance | Configure Profiler blade while one of our performance tests is running:
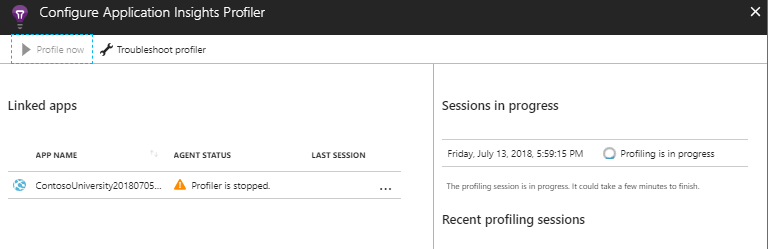
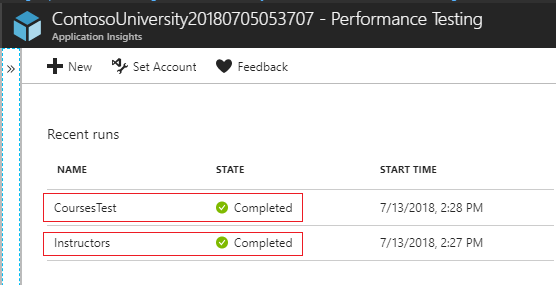
Later on we will walkthrough how to use the profiler to identify the exact lines of code responsible for the slow-down. For now, let’s focus on simply profiling . After clicking on “Profile now”, wait until the performance test finishes and the profiler has completed its analysis. After a new entry in the section “Recent profiling sessions” appears, navigate back to the Overview blade.
Diagnose runtime exceptions
If your web app has any failed requests, you need to root cause and solve the issues to ensure your app works reliably. After running your performance test on the Instructors page you have some example failed requests to take a look at:
Let’s go to Failures blade to investigate what failed.
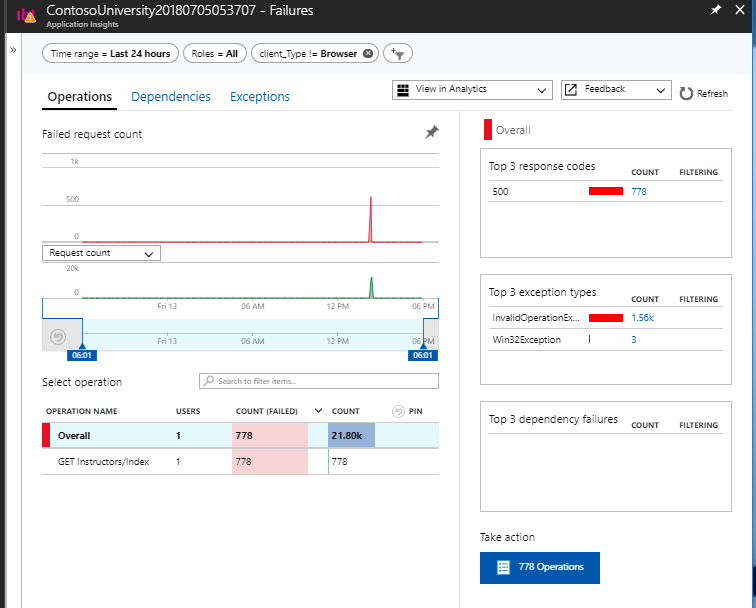
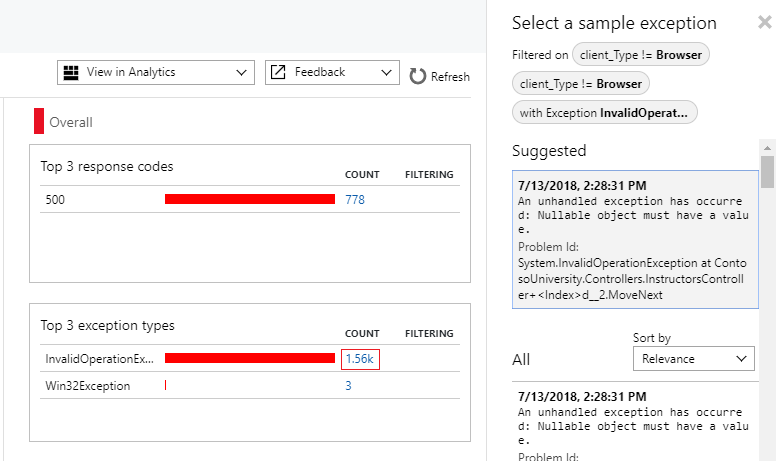
On the Failures blade, the top failed operation is ‘GET Instructors/Index’ and the top exception is ‘InvalidOperationException’. Click on the ‘COUNT’ column of the exception count to open list of sample exceptions. Click on the suggested exception to open the End-to-End Transaction blade.
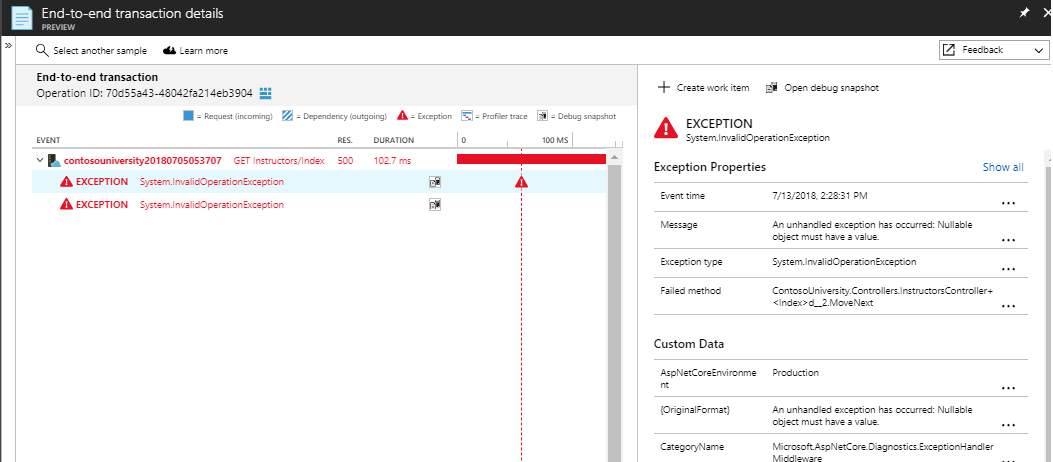
In the End-to-End Transaction blade, you can see ‘System.InvalidOperationException’ exceptions thrown from GET Instructors/Index operation. Select the exception row and click on ‘Open debug snapshot’.
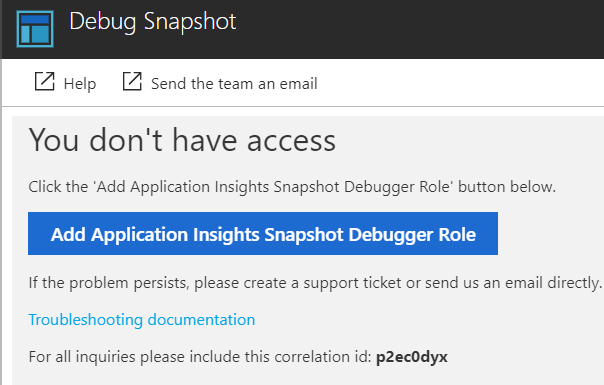
If it’s the first time you use Snapshot Debugger, you will prompt to request RBAC access to snapshots to safeguard the potentially sensitive data shown in local variables:
Once you get access, you will see a snapshot view like the following:
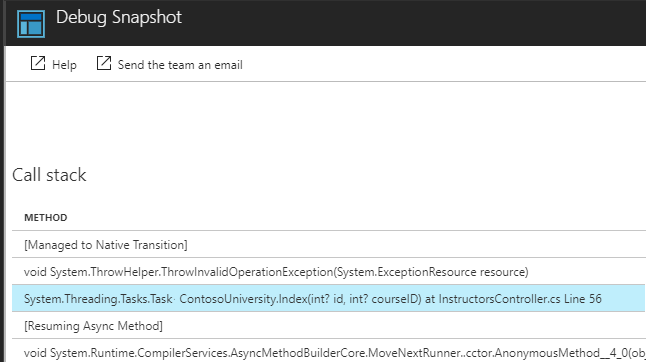
From the local variables and call stack, you can see the exception is thrown at InstructorsController.cs line 56 with message ‘Nullable object must have a value’. This provides sufficient information to proceed with debugging the app’s source code.
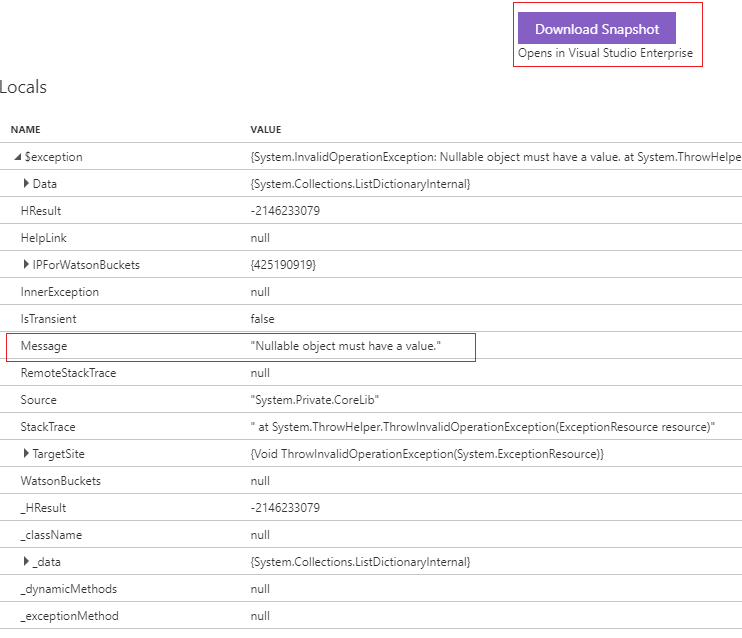
To get a better experience, download the snapshot and debug it using Visual Studio Enterprise. You will be able to interactively see which line of code caused the exception:
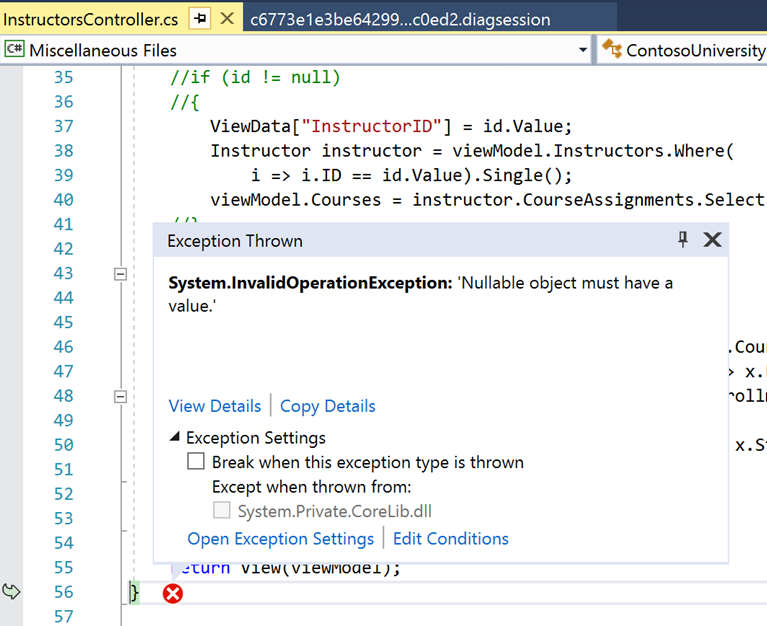
Looking at the code, the exception was thrown because ‘id’ is null and you are missing the appropriate check. When your app is running in the cloud, resources are dynamically provisioned and destroyed and so may not always get the chance to access the state of a failed component before it is reset. The Snapshot Debugger is a powerful tool that can maintain the failed state of the component even after the component’s state has been reset, by capturing local variables and call stack at the time the exception is thrown.
Diagnose bad performance from your web app
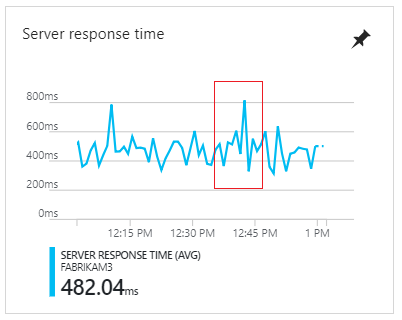
The server response time chart on the overview blade provides quick information on how performant your web app is over time. In the Contoso example, we see some spikes on the chart indicating there is a short period of time where users experienced slow responses for the requests they made.
To investigate further, navigate to the Performance blade in App Insights portal:
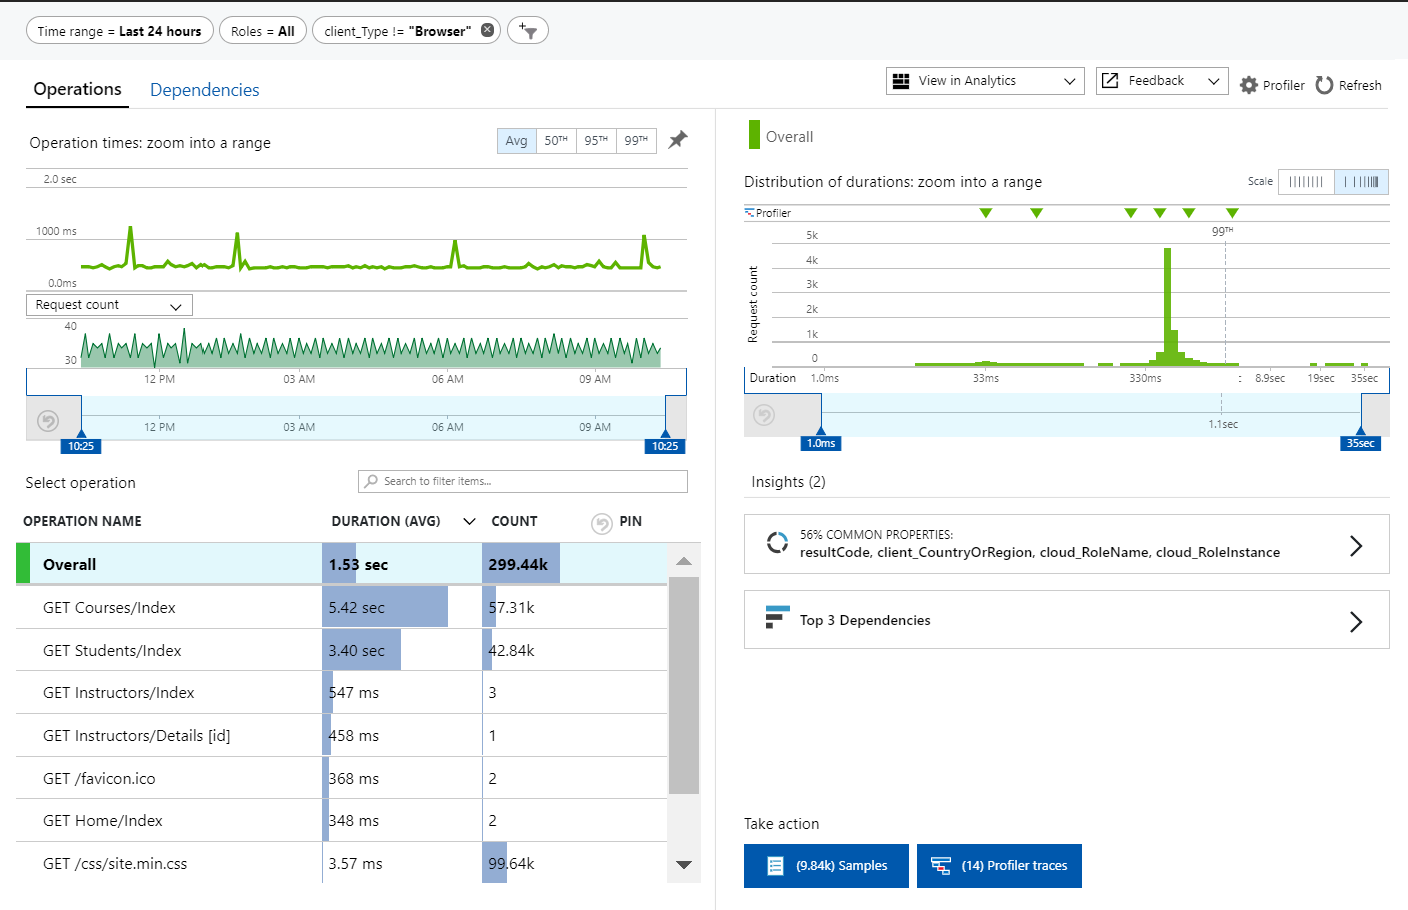
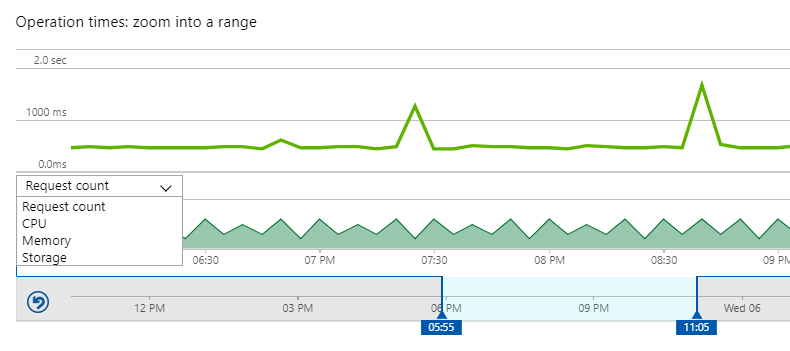
Zoom into the time range 6pm-10pm in the ‘Operation times: zoom into range’ chart to see spikes on the Request count.
Sort the Operations table by duration and request count to figure out where your web app spent the most time. In our example GET Courses/Index operation has the longest average duration. Let’s click on it to investigate why this operation takes so long.

The right side of the blade provides insights based on the Course/Index operation.
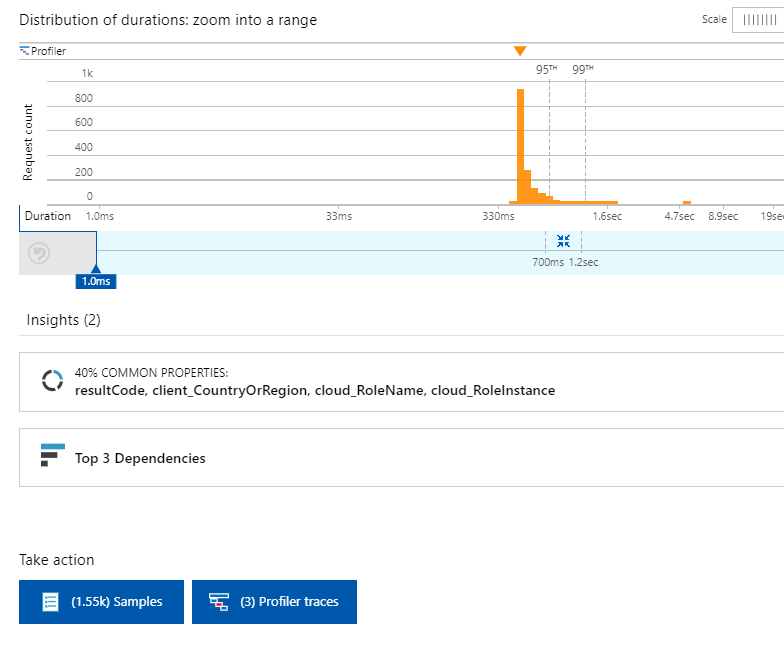
From the chart you can see although most operations only took around 400ms, the worst ones took up to 35 seconds. This means some users are getting really bad experience when hitting this URL and you should address it. Let’s look at Profiler traces to troubleshoot why GET Courses/Index was being so slow.
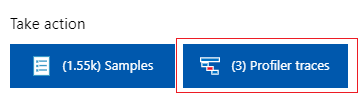
You should see profiler traces similar to the following:
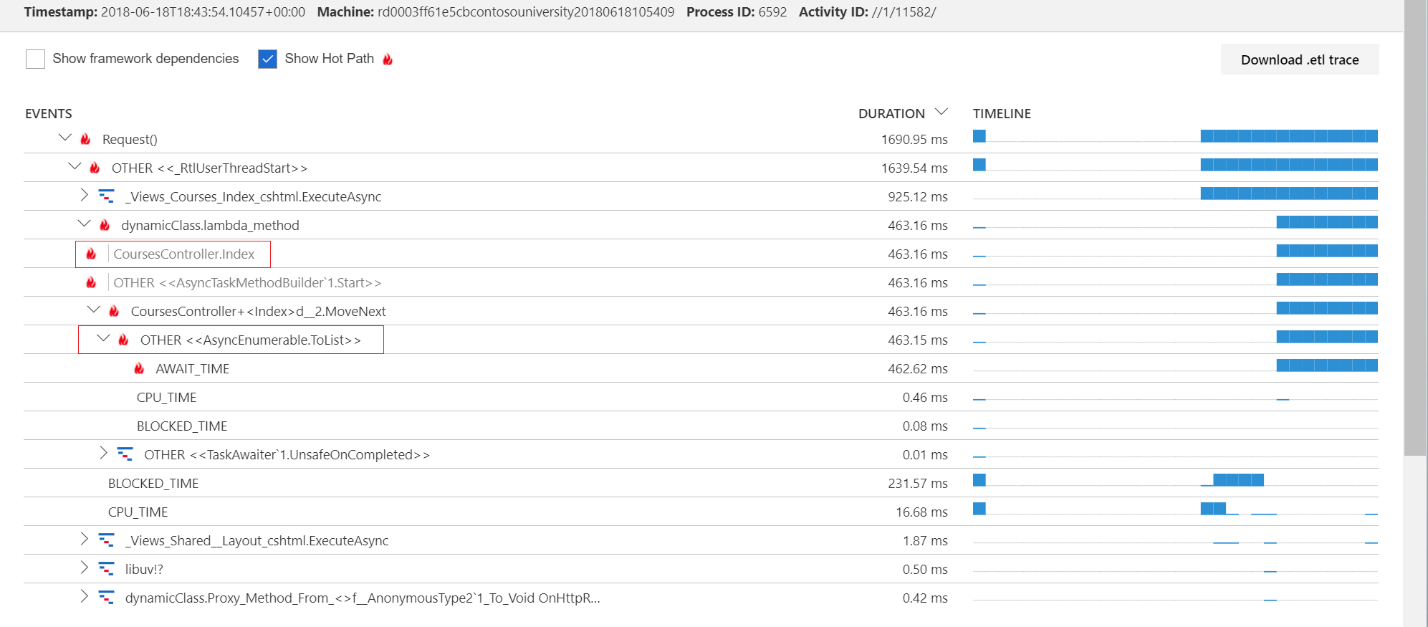
The code path that’s taking the most time is prefixed with the flame icon. In this particular request, most time was spent on reading the list of courses from the database. Browsing to the code CourseController.cs we can see that when loading the list of courses the AsNoTracking() optimization option is not used. By default, Entity Framework will turn on tracking which caches the results to compare with what’s modified. This could add an approx. ~30% overhead to your app’s performance. For simple read operation like this one, we can optimize the query performance by using the AsNoTracking() option.
Conclusion
We hope that you find it easy to use Application Insights to diagnose performance and errors in your web apps. We believe Azure App Service is a great place to get started hosting and maintaining your web apps. You don’t have to enable App Insights upfront; the option is always there to be turned on when and as needed without re-deployment.
If you have any questions or issues, let us know by leaving comments below.

Catherine Wang Program Manager, VS and .NET
Catherine is on Azure developer experience team and is responsible for Azure diagnostics, security and storage tools.
 Light
Light Dark
Dark
0 comments