
Notes from the ASP.NET Community Standup – October 18, 2016
This is the next in a series of blog posts that will cover the topics discussed in the ASP.NET Community Standup. The community standup is a short video-based discussion with some of the leaders of the ASP.NET development teams covering the accomplishments of the team on the new ASP.NET Core framework over the previous week. Within 30 minutes, Scott Hanselman, Damian Edwards, Jon Galloway and an occasional guest or two discuss new features and ask for feedback on important decisions being made by the ASP.NET development teams.
Each week the standup is hosted live on Google Hangouts and the team publishes the recorded video of their discussion to YouTube for later reference. The guys answer your questions LIVE and unfiltered. This is your chance to ask about the why and what of ASP.NET! Join them each Tuesday on live.asp.net where the meeting’s schedule is posted and hosted.
This week’s meeting is below:
Community Links
Request Filtering for ASP.NET Core applications: Part 4 – Extending the Request Filtering Rules
Localization Resource Generator & Translator via “dotnet” CLI
ASP.NET Core: Globalization and Localization
Building Apps with Polymer and ASP.NET Core
Don’t Share Your Secrets! (.NET CORE Secret Manager Tool)
Debugging into ASP.NET Core Source
Modifying the UI based on user authorisation in ASP.NET Core
Error Handling and ExceptionFilter Dependency Injection for ASP.NET Core APIs
Angular2 autocomplete with ASP.NET Core and Elasticsearch
ASP.NET Core with Angular2 – tutorial
Managing containerized ASP.NET Core apps with Kubernetes
Working with Environments and Launch Settings in ASP.NET Core
A question was asked on Twitter that Jon highlighted, asking if development had completely stopped on ASP.NET 4.6 and if there was a road map.
— We can tell you that development has not stopped, and we have released versions 4.6.1 and 4.6.2 of the .NET Framework with enhancements for ASP.NET. There are minor tweaks and adjustments being applied to the full framework as most of our attention is taken up by delivering the new .NET Core and ASP.NET Core frameworks. We expect to deliver features to the .NET Framework versions that help bring some of the innovation in .NET Core back to the existing .NET Framework so that applications built for Windows on the full framework get those benefits as well.
Accomplishments / Demo
Damian went on to present a demo and discussion about the logging and performance profiling features of ASP.NET Core with Visual Studio 2015. In particular, he spent time looking at using ETW (Event Tracing for Windows) and AppInsights integrations with Visual Studio. On Linux, there is a replacement for ETW that uses the same EventSource API but logs to a different location on disk.
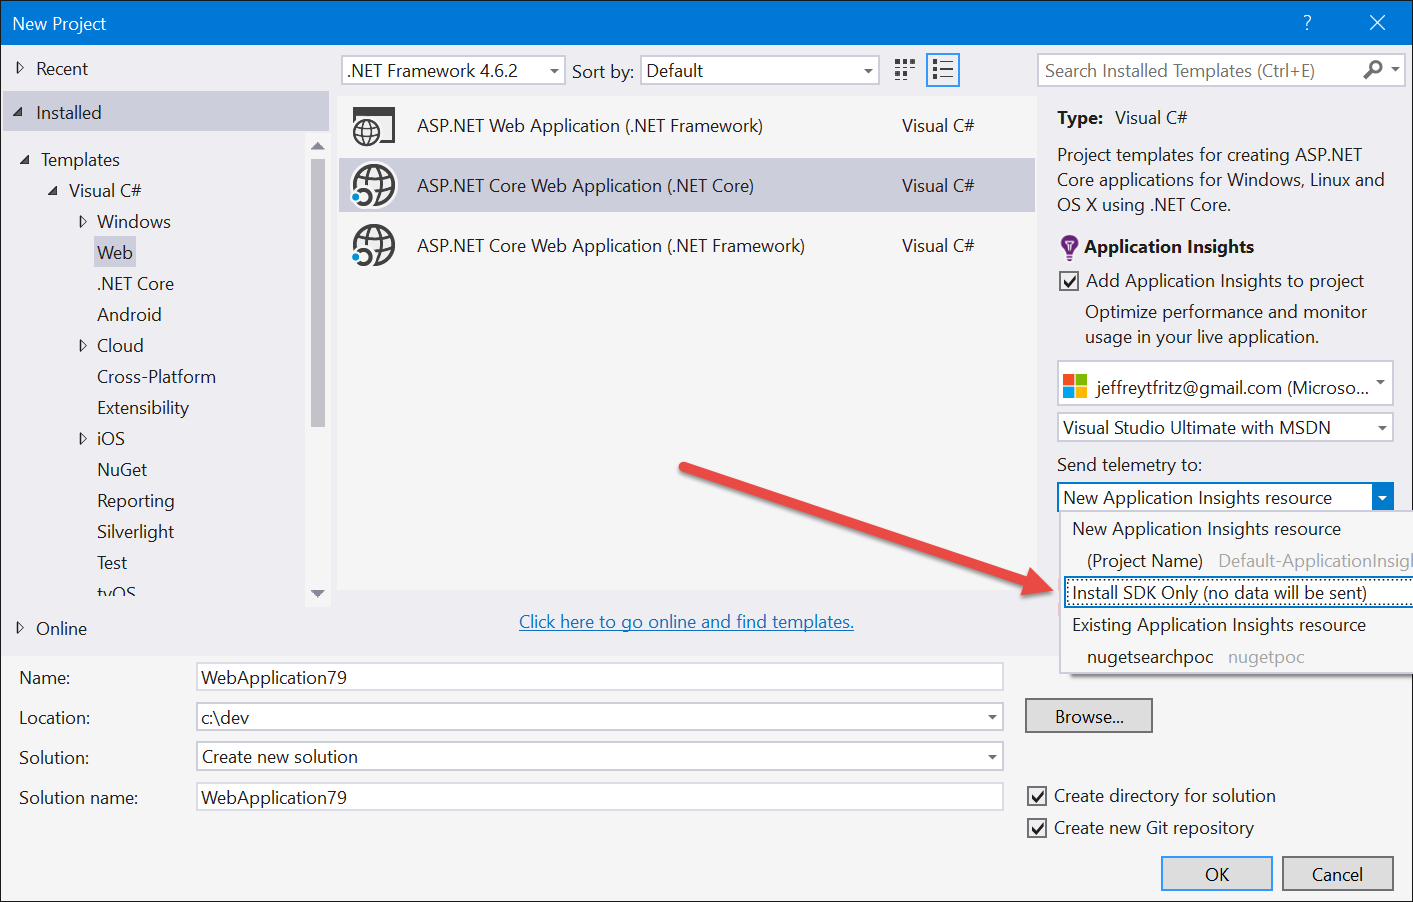
When starting a new project, there is an option in the window to add Application Insights to your project. You don’t need to sign up for an Azure account, and you can choose to “Install the SDK Only”.
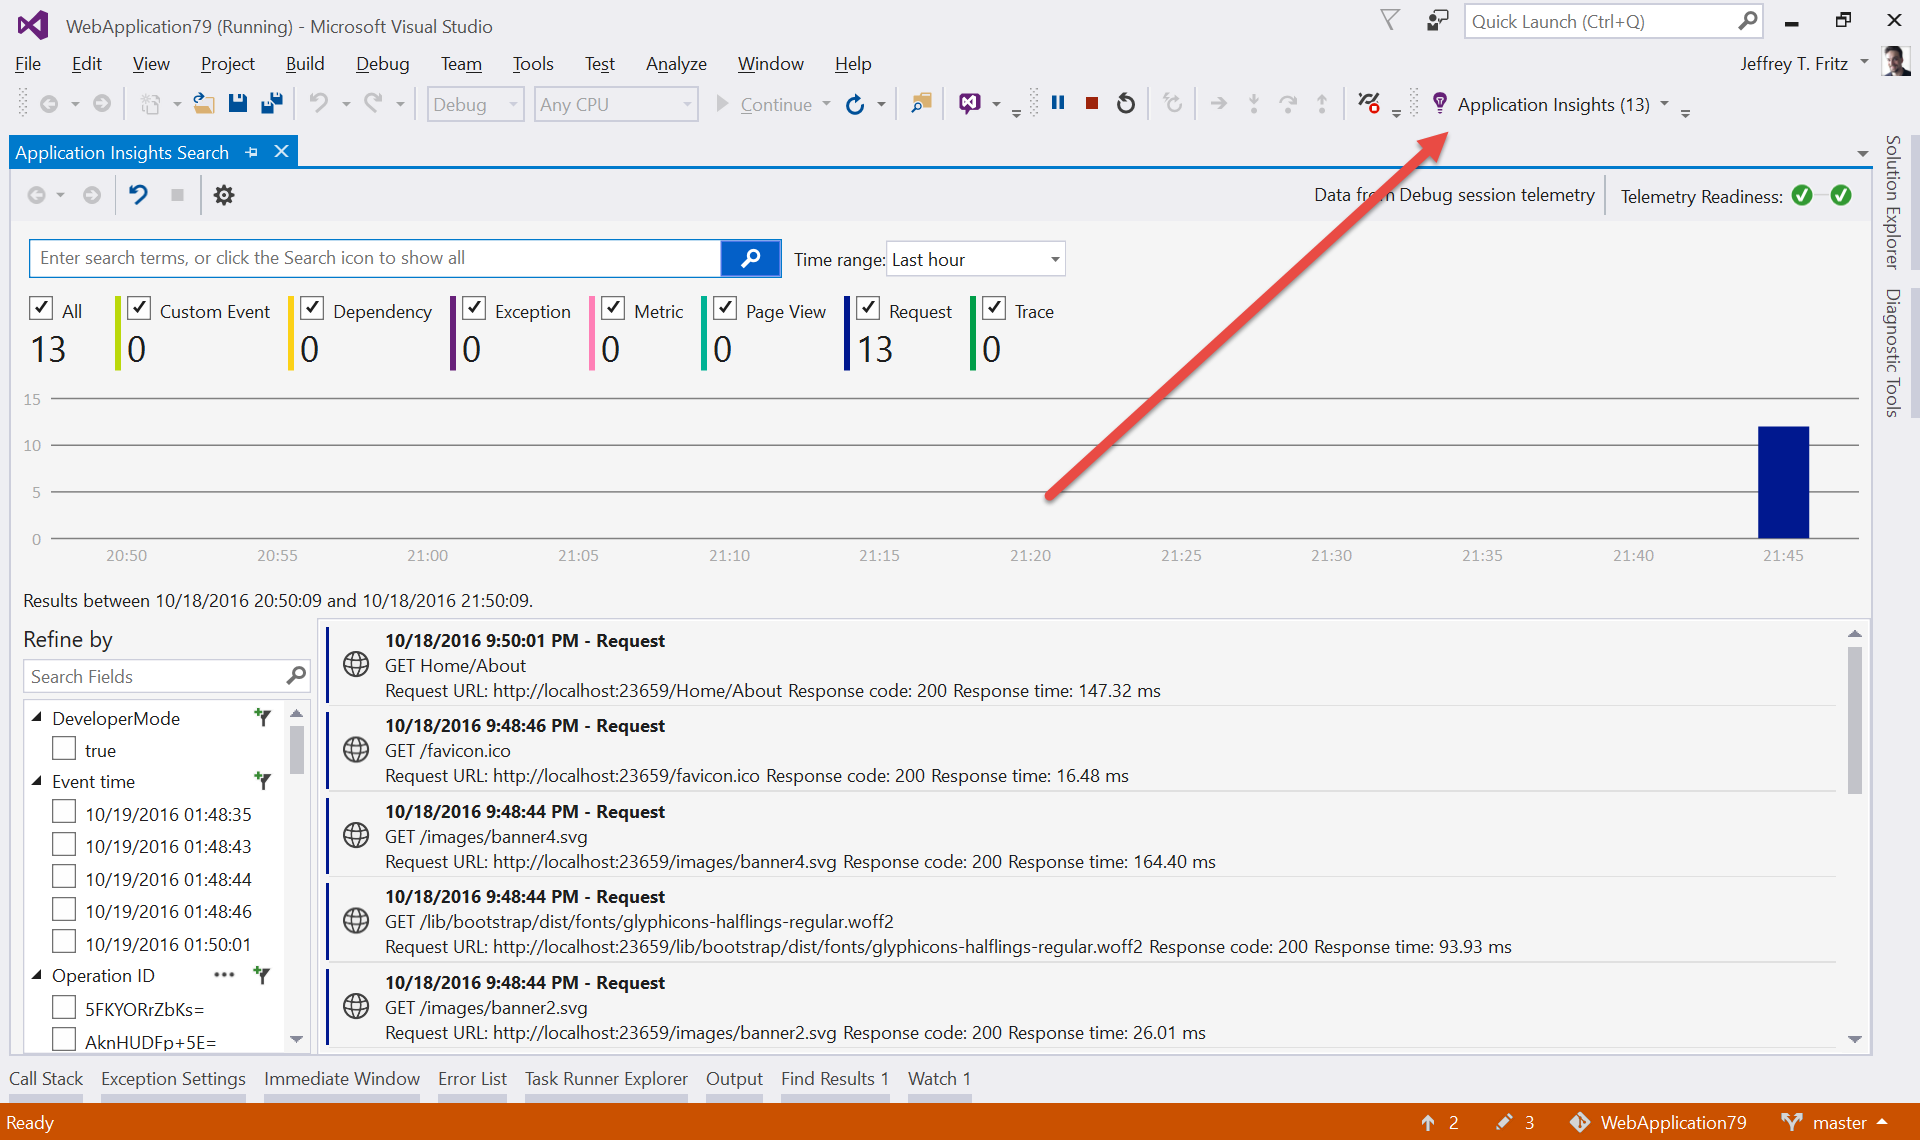
With AppInsight data collected locally, you can start your application with the debugger running, there is some very interesting data being analyzed by Visual Studio for you. The diagnostic tools window is available that shows the current memory, CPU usage, and events triggered by the application. You can click the AppInsights button on the toolbar to open the Application Insights Search window and see more detailed data about the interactions with the application.
These profilers and diagnostic tools are what really make Visual Studio shine for developers that need to do more than just ‘write code’.
The Application Insights team is working to add more features to their data collection and processing facilities inside of Visual Studio. They have also integrated with CodeLens for Visual Studio Ultimate users that shows the number of exceptions logged for each method you are viewing in the text editor. If your application has Application Insights running in production, you can connect your Visual Studio instance to that and see the exceptions logged in your production environment.
Damian went on to show us where the Application Insights telemetry is injected into the ASP.NET Core middleware. He went on to show us some improvements that he prototyped in an ASP.NET Core logger provider that logs more information to Application Insights.
In an effort to make it even easier to get this type of logging and analytics for Visual Studio developers, Damian showed the ETW logger provider that is already written but not yet shipped. You can grab it from the nightly MyGet feed under the Microsoft.Extensions.Logging.EventSource package name. With ASP.NET Core logging to ETW, you can then use the ETW PerfView tool to track and analyze the activities and events in your application.
Is there a performance impact while debugging and using ETW? When you get to about 60,000 events per second you will start to see performance impacts, and that won’t typically be hit in debugging sessions. ETW is designed to be turned on by default and it only impacts performance when there is a listener interacting with the Windows event stream.
Scott spent some time learning more about Application Insights and Visual Studio, and wrote up his experience on his blog.
Our next standup will be in two weeks, on November 1. Thanks for watching, and happy coding!
 Light
Light Dark
Dark
0 comments