Tracing in ASP.NET MVC Razor Views
System.Diagnostics.Trace can be a useful tool for logging and debugging, and sometimes it would be handy to be able to call one of the tracing methods from a Razor view.
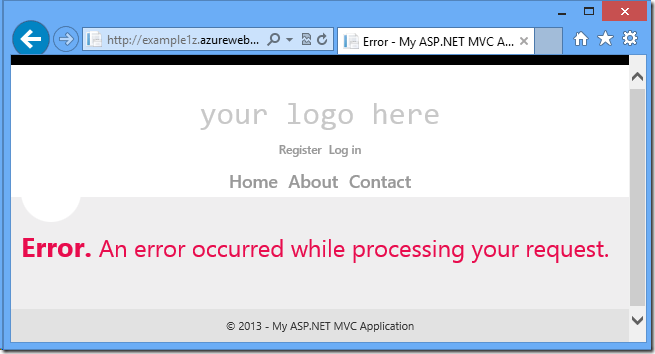
For example, when an MVC application runs in production, by default MVC catches most application exceptions for you and routes them to Views/Shared/Error.cshtml. That view doesn’t show error details for security reasons, so you end up with the not-very-helpful message “An error occurred while processing your request.”

Running locally you get detailed error info, or you can catch exceptions by running in debug mode, but what to do about errors that happen in production?
If you can re-create the error in production, you can temporarily tell the site to go ahead and display detailed error information by adding a customErrors element to your Web.config file in the system.web element:
- <system.web>
- <customErrors mode="Off" defaultRedirect="Error" />
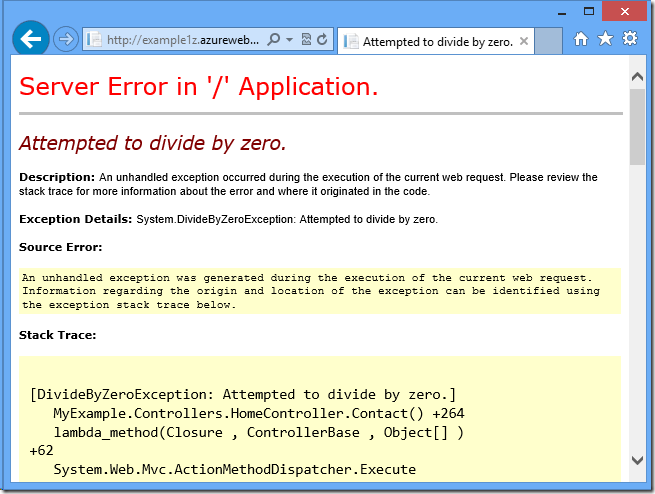
Now instead of “An error occurred” you get an actual error message and a stack trace.

But another quick-and-dirty alternative that doesn’t require temporarily exposing error details to the public, is to add tracing statements to the view, for example:
- @using System.Diagnostics
- @model System.Web.Mvc.HandleErrorInfo
- @{
- ViewBag.Title = "Error";
- var message = string.Format("Error in Controller {0}, Action method {1}. Exception: {2}",
- Model.ControllerName, Model.ActionName, Model.Exception.Message);
- if (Model.Exception.InnerException != null)
- {
- message += "; Inner exception: " + Model.Exception.InnerException.Message;
- }
- Trace.TraceError(message);
- }
- <hgroup class="title">
- <h1 class="error">Error.</h1>
- <h2 class="error">An error occurred while processing your request.</h2>
- </hgroup>
Unfortunately, when you do this you don’t get any trace output, and if you step through the code in the debugger you’ll see it step right over the TraceError method call without executing it.
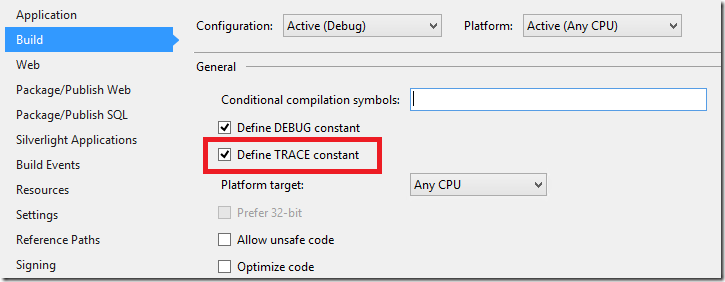
Trace statements require the TRACE compiler constant, but it’s on by default and you can verify that in the Build tab of the project properties window:

The problem is that this setting in the .csproj file only applies to .cs files. ASP.NET uses a different compile process for .cshtml files (or .aspx files in Web Forms), and the settings for that compile process are in the Web.config file. If you don’t explicitly specify the TRACE constant there, tracing method calls in .cshtml views are ignored.
You have at least two options for dealing with this situation if you want to add tracing in a view: define a TRACE constant for the .cshtml compiler, or use a static helper method.
Below is an example of what you have to add to the application Web.config file for a Visual Studio project that targets .NET 4.5, in order to define a TRACE constant for the .cshtml compiler:
- <system.codedom>
- <compilers>
- <compiler
- language="c#;cs;csharp"
- extension=".cs"
- type="Microsoft.CSharp.CSharpCodeProvider, System, Version=2.0.3600.0, Culture=neutral, PublicKeyToken=b77a5c561934e089"
- compilerOptions="/define:TRACE"
- warningLevel="1" />
- </compilers>
- </system.codedom>
With this in place the TraceError method call gets executed.
If you’re using a different Visual Studio or ASP.NET version, you can get the Version number you need by looking at your root Web.config file, copying out the codedom element from there, and adding the compilerOptions setting. The root Web.config file for .NET 4 or 4.5 is located in C:WindowsMicrosoft.NETFramework64v4.0.30319Configweb.config:
- <system.codedom>
- <compilers>
- <compiler language="c#;cs;csharp" extension=".cs" warningLevel="4" type="Microsoft.CSharp.CSharpCodeProvider, System, Version=4.0.0.0, Culture=neutral, PublicKeyToken=b77a5c561934e089">
- <providerOption name="CompilerVersion" value="v4.0"/>
- <providerOption name="WarnAsError" value="false"/>
- </compiler>
- <compiler language="vb;vbs;visualbasic;vbscript" extension=".vb" warningLevel="4" type="Microsoft.VisualBasic.VBCodeProvider, System, Version=4.0.0.0, Culture=neutral, PublicKeyToken=b77a5c561934e089">
- <providerOption name="CompilerVersion" value="v4.0"/>
- <providerOption name="OptionInfer" value="true"/>
- <providerOption name="WarnAsError" value="false"/>
- </compiler>
- </compilers>
- </system.codedom>
If you’d rather use a static trace helper, create a class like the following example:
- using System.Diagnostics;
- namespace MyExample
- {
- public static class TraceHelper
- {
- public static void MyTrace(TraceLevel level, string message)
- {
- switch (level)
- {
- case TraceLevel.Error:
- Trace.TraceError(message);
- break;
- case TraceLevel.Warning:
- Trace.TraceWarning(message);
- break;
- case TraceLevel.Info:
- Trace.TraceInformation(message);
- break;
- case TraceLevel.Verbose:
- Trace.WriteLine(message);
- break;
- }
- }
- }
- }
Now you can use virtually the same code in your view without having to add a codeDom element to your Web.config:
- @using MyExample
- @using System.Diagnostics
- @model System.Web.Mvc.HandleErrorInfo
- @{
- ViewBag.Title = "Error";
- var message = string.Format("Error in Controller {0}, Action method {1}. Exception: {2}",
- Model.ControllerName, Model.ActionName, Model.Exception.Message);
- if (Model.Exception.InnerException != null)
- {
- message += "; Inner exception: " + Model.Exception.InnerException.Message;
- }
- TraceHelper.MyTrace(TraceLevel.Error, message);
- }
- <hgroup class="title">
- <h1 class="error">Error.</h1>
- <h2 class="error">An error occurred while processing your request.</h2>
- </hgroup>
There are many ways to get the trace output, and I’ve added some links for info about that at the end of this post.
Adding tracing to views might be an effective way to debug a problem in production, and I’ve used Error.cshtml to show an example of how to do that. If your goal is a more permanent method of logging unhandled errors, a better method is to use an exception filter. To do that you create a class that implements IExceptionFilter, such as the following example:
- using System.Web.Mvc;
- namespace MyExample
- {
- public class ErrorLoggerFilter : IExceptionFilter
- {
- public void OnException (ExceptionContext context)
- {
- var message = string.Format("Error processing URL: {0}. Exception: {1}",
- context.HttpContext.Request.Url, context.Exception.Message);
- if (context.Exception.InnerException != null)
- {
- message += "; Inner exception: " + context.Exception.InnerException.Message;
- }
- context.HttpContext.Trace.Write(message);
- System.Diagnostics.Trace.TraceError(message);
- }
- }
- }
And then register the filter in App_Start/FilterConfig.cs:
- using System.Web;
- using System.Web.Mvc;
- namespace MyExample
- {
- public class FilterConfig
- {
- public static void RegisterGlobalFilters(GlobalFilterCollection filters)
- {
- filters.Add(new HandleErrorAttribute());
- filters.Add(new ErrorLoggerFilter());
- }
- }
- }
For another look at tracing best practices for web applications, see 47:00-55:36 in this video: Scott Guthrie: Building Real World Cloud Apps with Windows Azure – Part 2.
If you deploy your application to a Windows Azure Web Site, the latest SDK makes it exceptionally easy to get trace output immediately in the Visual Studio Output window while the site is running. In two weeks the tutorial I’ve written about this will be published on WindowsAzure.com; until then, see the intro in the ScottGu blog post introducing Windows Azure SDK 2.0.
Some other links:
- ASP.NET Tracing
Old but still a good resource for a basic introduction to the subject. - Trace Listeners
Information about trace listeners but doesn’t mention the WebPageTraceListener. - Walkthrough: Integrating ASP.NET Tracing with System.Diagnostics Tracing
This too is old, but includes some additional information that the introductory articles don’t cover. - ELMAH
A popular error logging utility for ASP.NET. Scott Hanselman’s blog posts about ELMAH are a good place to get started. - Streaming Diagnostics Trace Logging from the Azure Command Line (plus Glimpse!)
How to use the command line to do what my tutorial will show how to do in Visual Studio. Glimpse is a tool for debugging ASP.NET applications.
Thanks to Rick Anderson and Yishai Galatzer for help with the code for this blog post.

 Light
Light Dark
Dark
0 comments