
JScript Debugging in Visual Web Developer 2005
A lot of people have asked about how to debug JScript in Visual Web Developer 2005. You need to know a few tricks before you can set a breakpoint on an ASPX document (Note that the experience is vastly improved in our Orcas March CTP and I will be making a separate blog post on that soon).
1. Enable client script debugging on IE:

2. Start debugging in Visual Web Developer (F5)

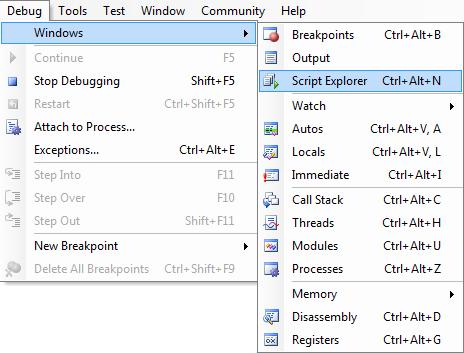
3. Bring up the Script Explorer window (Ctrl+Alt+N):
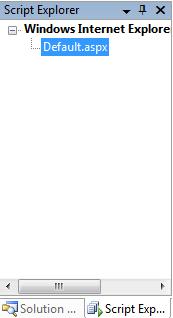
4. Once the Script Explorer window is opened, double click on the run-time document that you want to debug:
5. Now you can set a breakpoint in the run-time document:

The script execution will pause on the breakpoint when you execute the script. You can then examine objects at this point of the execution. For example, you can bring up the Quick Watch window and examine the data of the document object.

If you need to debug something during a page load, you can use the debugger statement:

Enjoy!
Barry Tang
Software Design Engineer
Visual Studio Web Tools
 Light
Light Dark
Dark
0 comments