Screencast: Using Glimpse with Windows Azure Web Sites
Glimpse is a great open source diagnostic tool for web applications. Glimpse runs in your browser (it’s all HTML, so no plug-ins required), and it gives you a glimpse into what’s happening on the server when your code executes. You can see what methods are executing, how long code takes to run, configuration information, and much more. By adding output from ASP.NET tracing, you can get valuable diagnostic information that would be difficult to obtain otherwise.
(Check out our screencast on using Glimpse later in this post.)
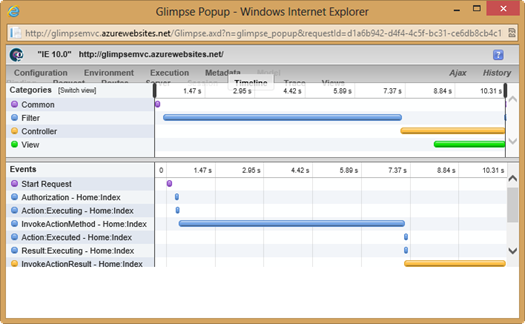
What you see below is just one view that Glimpse can give you. In this particular application, I have some code that’s taking a long time to run, and Glimpse gives me a good idea of exactly where to look.

You can add ASP.NET trace output to Glimpse as well. (As you’ll see when you watch the screencast, it appears on the Trace tab in Glimpse.) In order to see ASP.NET trace output, you’ll need to turn on tracing in your web.config file using the following code.
<trace enabled="true" writeToDiagnosticsTrace="true"/>
Using Glimpse with Windows Azure Web Sites
By default, Glimpse runs under a local policy that won’t allow you to use it on a remote server. In order to use Glimpse on your Windows Azure Web Sites site, you’ll need to disable that local policy. You can do that by adding the following snippet to the <glimpse> section in your web.config file.
<runtimePolicies>
<ignoredTypes>
<add type="Glimpse.AspNet.Policy.LocalPolicy, Glimpse.AspNet"/>
</ignoredTypes>
</runtimePolicies>
There are additional configuration options available as well, and you can find out about them on the Glimpse website.
Screencast Demo of Glimpse
In our screencast, you’ll learn how to install and configure Glimpse. You’ll see how you can dig into what’s happening on the server when your code runs, and you’ll also learn how to use Glimpse with Windows Azure Web Sites.