How to view the memory utilization of your Azure Web Site
It is always a good idea to monitor the memory utilization of your web site. That fact remains when running it in the Cloud. There are lots of comments made when discussing the Cloud that resources are unlimited and/or infinite, in some cases this is true, but when running on Azure Web Sites, the amount of memory your application has is determined by the instance size. Check the current memory amounts shown here, which are associated to Small, Medium and Large sizes.
When your application utilizes all allocated memory, it would likely stop functioning as expected and the error exception you receive might not always be an OutOfMemory (OOM) message. Therefore when your application starts to behave oddly, you might want to check this attribute.
NOTE: Please keep in mind that your Azure Web Site is running on top of a Windows Server OS and with IIS. Both of these consume a portion of the allocated memory to your platform.
In the current Azure Management Console you have a DASHBOARD and a MONITOR which provide information like HTTP SERVER ERRORS, REQUESTS, DATA OUT, CPU TIME, etc., as illustrated by Figure 1.
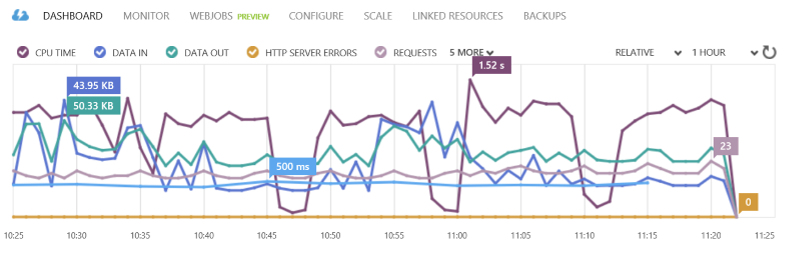
Figure 1, performance dashboard view in the current Azure Management console
In the existing Azure Management Console, there is no place to check for the current amount of memory consumption. However, in the new Azure Portal accessible here, you can now see the memory consumption for the VM presently hosting your Azure Web Sites.
So, once you are logged in to the new Azure Portal, select Browse and then Web Sites, as illustrated in Figure 2.
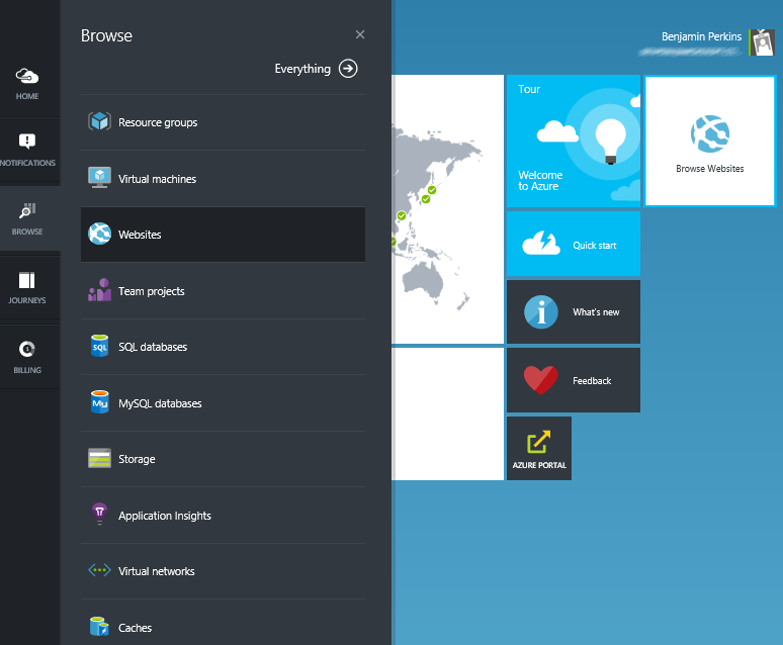
Figure 2, open a list of Azure Web Sites in the new Azure management console
Next, select the Azure Web Site in which you want to view the memory consumption for, then find the Quotas section and select it. As shown in Figure 3, a graph representing the VM memory consumption over the past 24 hours in addition to Average, Minimum and Maximum values are shown.
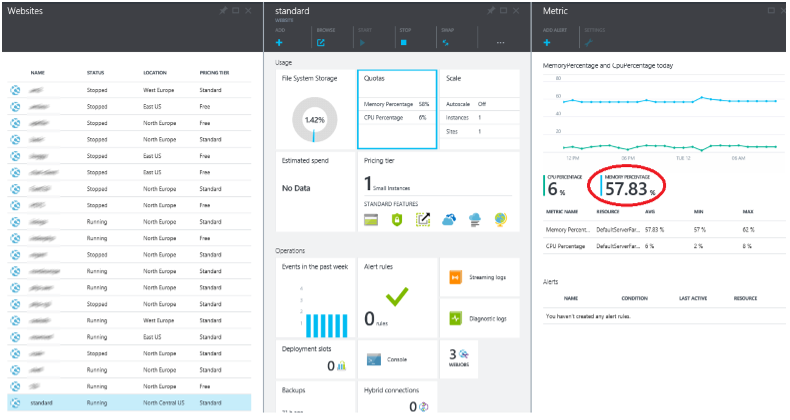
Figure 3, viewing memory consumption of your Azure Web Site
Keep in mind that the value presented on this blade is the total memory consumption of all Azure Web Sites running on the Virtual Machine (VM). A VM, in this context, is in many ways synonmous with a Web Hosting Plan, discussed here. For example, lets say you have a single Azure Web Site in this Web Hosting Plan, that would mean the memory consumption shown is only that of the Azure Web Site. However, if you have more than one web site on the VM, the metric diplays the memory consumption of all Azure Web Sites on that VM within the given Web Hosting Plan.
Troubleshooting
If you do find that your application is consuming too much memory or more than expected, you might consider taking a 'Diagnostic dump' of your worker via KUDU. You can achieve this by accessing your KUDU environment by following the instructions explained here, and selecting the Tools -> Diagnostic Dump menu item, as shown in Figure 4. Then review the results. Additionally, if your application is .NET based, consider using Diagnostics as a Service (DaaS), discussed here, which can provide excellent information on memory consumption.
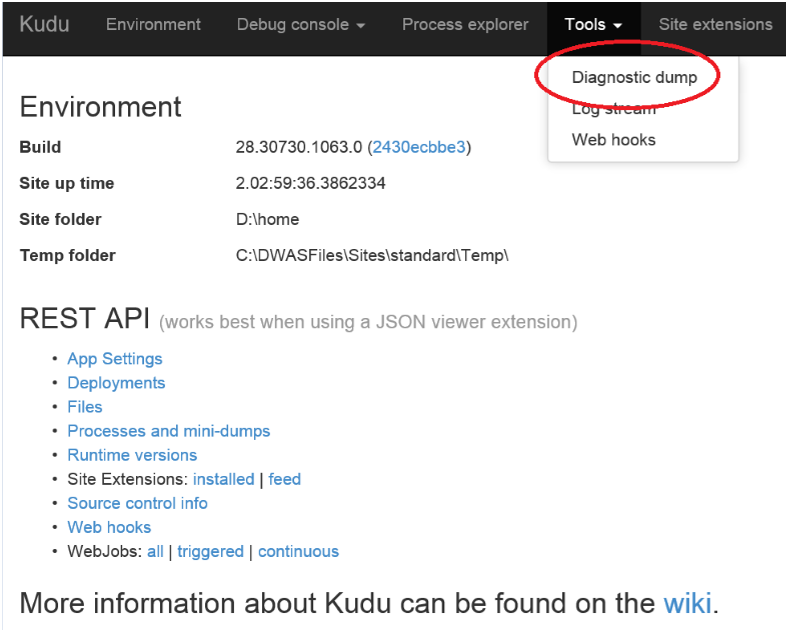
Figure 4, Use KUDU to get a memory dump of the web worker process on Azure Web Sites
If required, you can isolate a specific Azure Web Site from the others by moving the most suspicious web site (I.e. the one you suspect is consuming all the available memory) to another existing Web Hosting Plan in the same region, or create a new Web Hosting Plan specifically for this purpose. As shown in Figure 5, select the Azure Web Site which you want to isolate, then select the WEB HOSTING PLAN menu item. Once selected, a list of Web hosting plans are displayed and you can select an existing 'empty' one, or you can also create a new one.
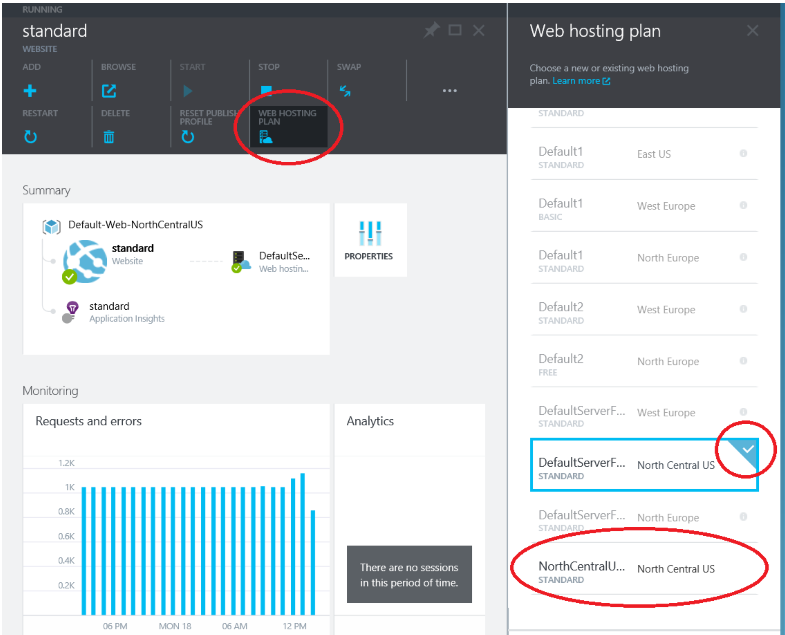
Figure 5, Move an Azure Web Site to another Web Hosting Plan
Once the Azure Web Site is moved to a Web Hosting plan that contains only the single web site, the memory consumption metric represents only that web site and your analysis can then begin to find the reason and gain insight on how to minimize it.