Creating Unit Monitors for Windows Azure Performance Counters in SCOM 2007 R2
Monitors are powerful management pack objects in SCOM. In the Operations Manager documentation, a monitor is described in the following manner: “monitors can be used to assess various conditions that can occur in monitored objects. For example, a monitor can be used to assess the values of a performance counter, the existence of an event, the occurrence of data in a log file, the status of a Windows Service, or the occurrence of a Simple Network Management Protocol (SNMP) trap. The result of this assessment determines the health state of a target and the alerts that are generated.” So basically, we use monitors to watch for certain events on a monitored object, assess the health state of that object, and then generate an alert if required based on that assessment.
In this post, we will create a simple unit monitor based on a performance counter to determine if any role instance of a Windows Azure application has CPU utilization above a specified threshold. If so, it will generate an alert. The idea is to simply respond to specific conditions met by a performance metric using a Unit Monitor. Since SCOM has no knowledge of Windows Azure data sources, we will have to leverage the Authoring Console so we can properly set our data source and then create the monitor. In this post, we will create our own unit monitor that will generate an alert if we have three consecutive samples of processor utilization above 80%. Alternatively, we could simply modify the existing Total CPU Utilization Percentage monitor by overriding the existing processor utilization threshold and adding a diagnostic or recovery task. But for learning purposes this exercise shows you how to do it yourself.
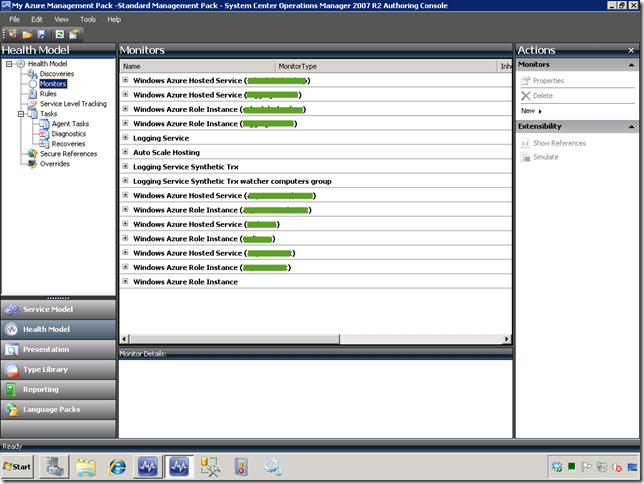
Below you will see that we have the Authoring Console running, and have loaded our management pack previously exported from the Operations Console. For your reference, here are some probable locations of the references the Authoring Console will most likely ask you to resolve before it loads your management pack:
- Microsoft.SqlServer.SqlAzure: C:\Program Files\System Center Operations Manager 2007
- Microsoft.SystemCenter.WebApplication.Library: C:\Program Files (x86)\System Center 2007 R2 Hotfix Utility\KB2495674\ManagementPacks
- Microsoft.SystemCenter.Azure: C:\Program Files (x86)\System Center Management Packs\Monitoring Pack For Windows Azure Applications
In the Health Model view, select the Monitors node, as seen below.
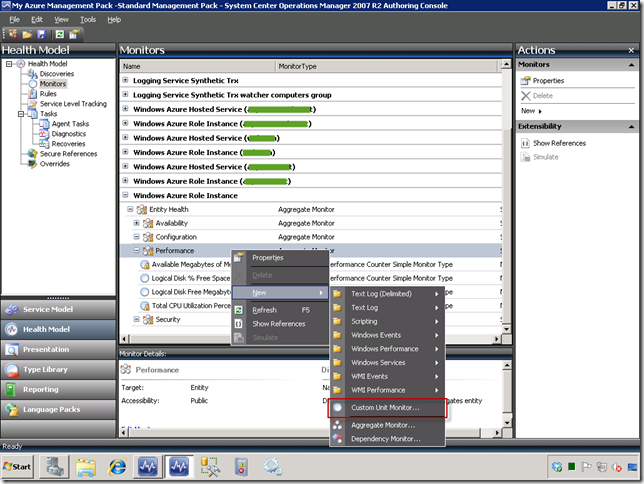
Expand the Windows Azure Role Instance node in the Monitors pane, and then the Performance node, which will have the two out of box monitors listed, as seen below (you will also see two below that I have already added). The out of box monitors are disabled by default (and thus you will see the icons are grayed), but you can enable them by using an override in the Operations Console. Go ahead and right-click on the Performance node, and then select New | Custom Unit Monitor… from the popup menu.
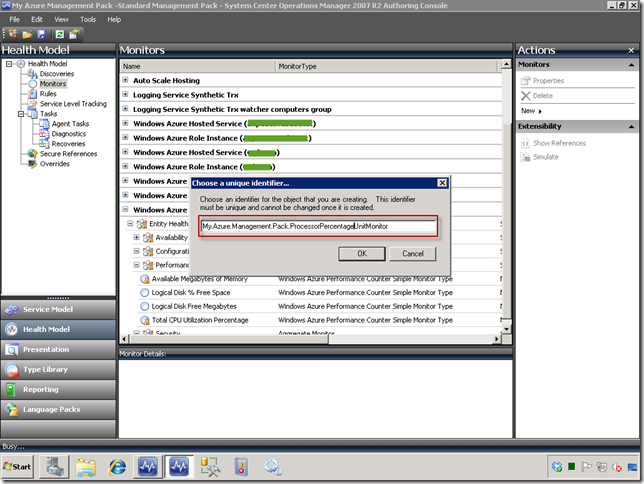
Now you will be asked to give the monitor a unique identifier, as seen below.
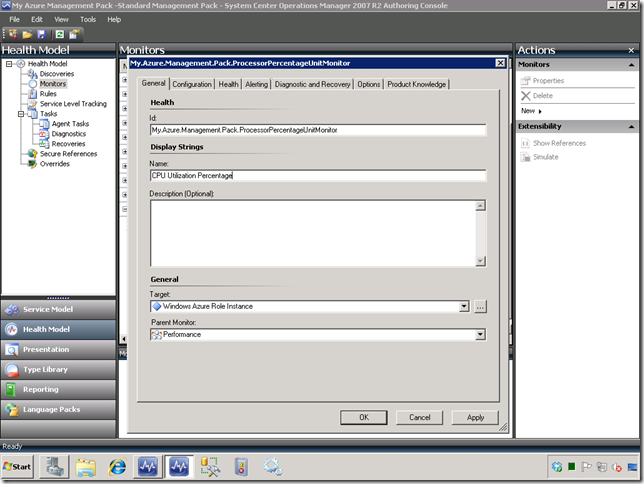
You will next see the configuration dialog with the General tab presented. It is already setup with the ID, Target, and Parent Monitor. So just provide a name and description as seen below.
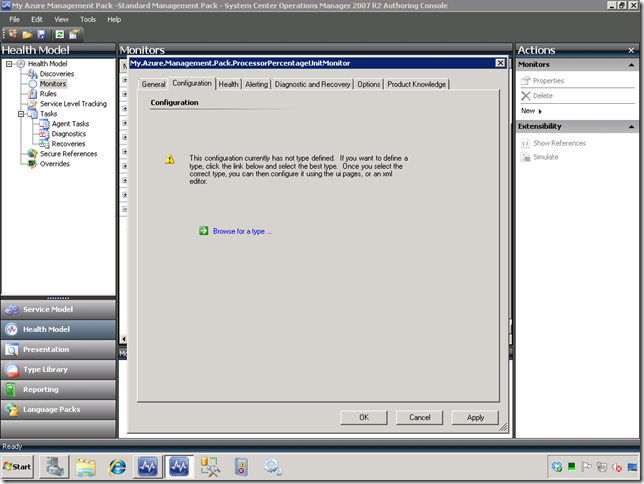
Select the Configuration tab, as seen below. Before you can proceed, you must select a unit monitor type. Select the Browse for a type… link as seen below.
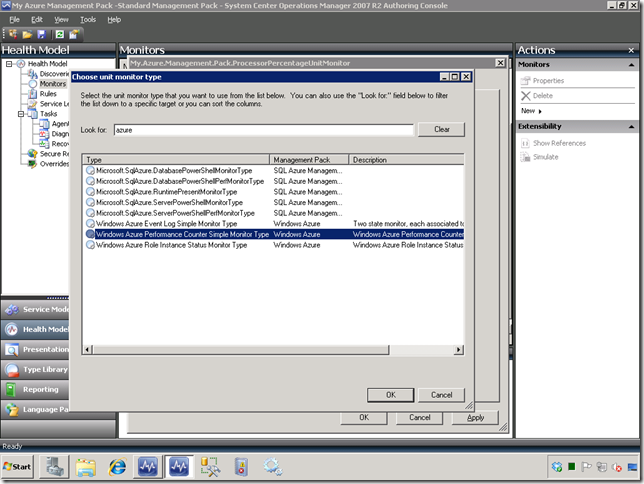
You will now see a dialog that allows you to select your unit monitor type, but you must first narrow your choices down to the unit monitor types in the Windows Azure management pack. So just type “azure” in the Look for: textbox. Your choices for unit monitor types are:
- Windows Azure Event Log Simple Monitor Type
- Windows Azure Performance Counter Simple Monitor Type
- Windows Azure Role Instance Status Monitor Type
Select the second of the three listed above, as seen below. Then click the OK button.
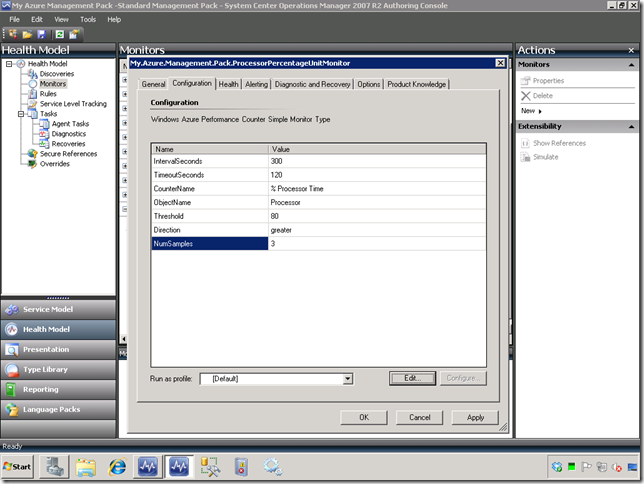
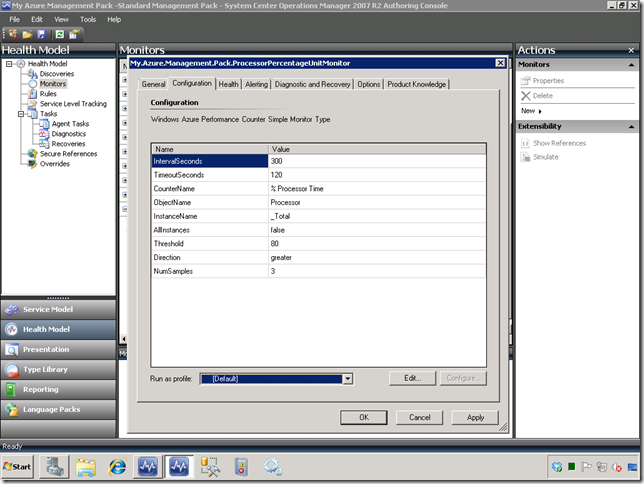
You will now see the desired configuration, where you will need to enter the appropriate values. Enter the values below, but don’t hit the OK button yet because we need to add additional values manually.
- Interval Seconds: 300
- Timeout Seconds: 120
- CounterName: % Processor Time
- ObjectName: Processor
- Threshold: 80
- Direction: greater
- NumSamples: 3
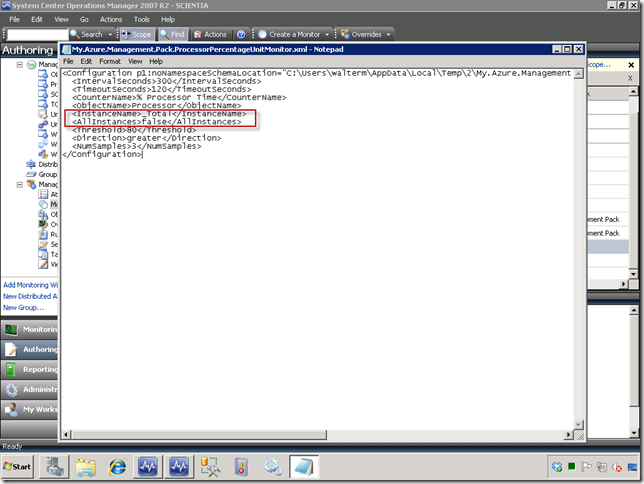
Now you need to select the Edit… button so we can add additional important configuration parameters, namely InstanceName and AllInstances. Be precise as below, or the editor won’t like it when you try to save the configuration. Save the configuration from the File menu and close the editor.
Now we have our final configuration, as seen below. Let’s next select the Health tab.
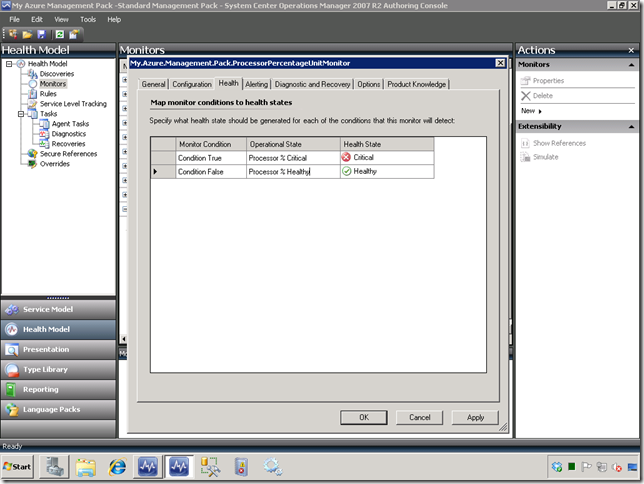
On the Health tab, enter your desired text in the Operational State fields. Select Critical for the condition True health state, and select Healthy for the condition False health state, as seen below.
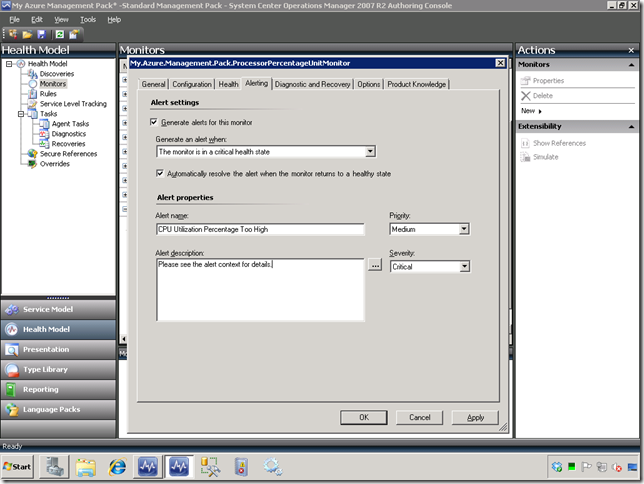
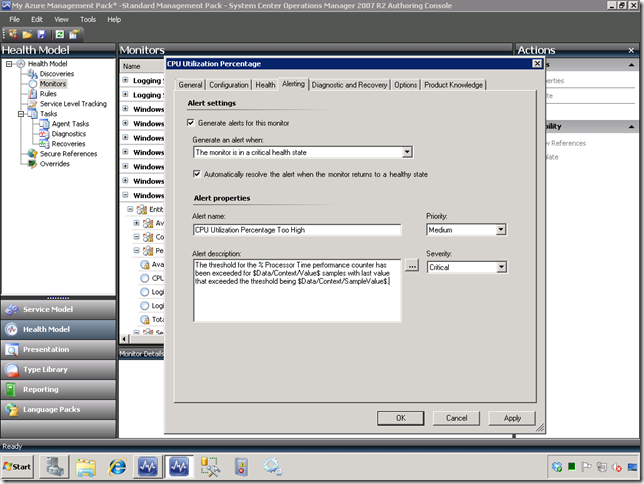
Next, we want to setup our alert. Select the “Generate alerts for this monitor” checkbox. Choose “The monitor is in a critical health state” from the dropdown box below. Leave the “Automatically resolve the alert when the monitor returns to a healthy state” checkbox checked. In the Alert name textbox, enter text indicative of the alert. Leave the Priority and Severity dropdowns as they are. Now, select the ellipsis next to the Alert description textbox, which will display the Alert Description dialog.
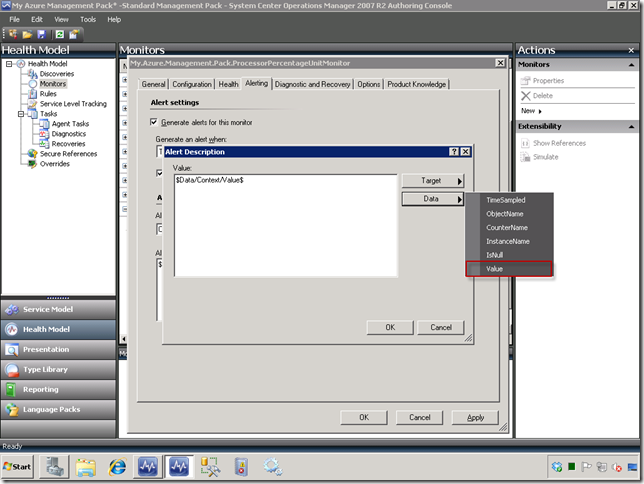
In the Alert Description dialog, clear out the existing text. From the Data button, select the Value item in the flyout menu. This will then insert the $Data/Context/Value$ parameter in the text box. This value will provide the number of samples, but you also want the sample value which represents the processor percentage. That actually is $Data/Context/SampleValue$ , but it isn’t in the flyout menu. What I did was to just cheat and grab the text from the out of box CPU Utilization Percentage monitor, which is as follows:
The threshold for the Processor\% Processor Time\_Total performance counter has been exceeded for $Data/Context/Value$ samples with last value that exceeded the threshold being $Data/Context/SampleValue$.
For a great list of variables, please see Kevin Holman’s blog here, where he indicates the difference between the Value and SampleValue variables we are working with. Another great place to check out for variables is Ben Oostdam’s blog here. When you’re done, select the OK button.
Your dialog should now look similar to below.
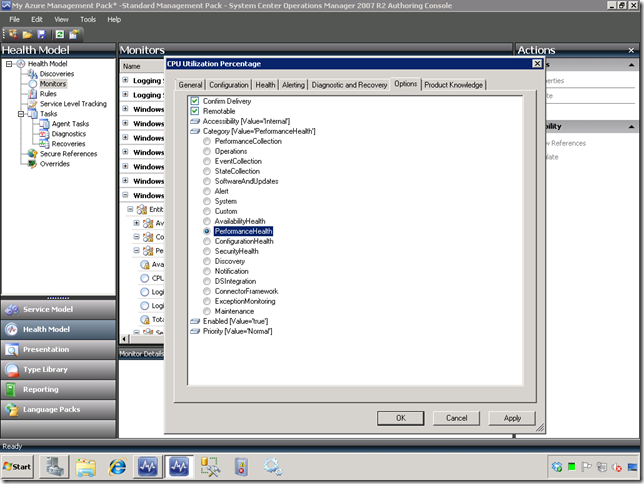
Finally, select the Options tab so this will be properly categorized when you setup notifications. Select the PerformanceHealth radio button. When you’re done, select the OK button.
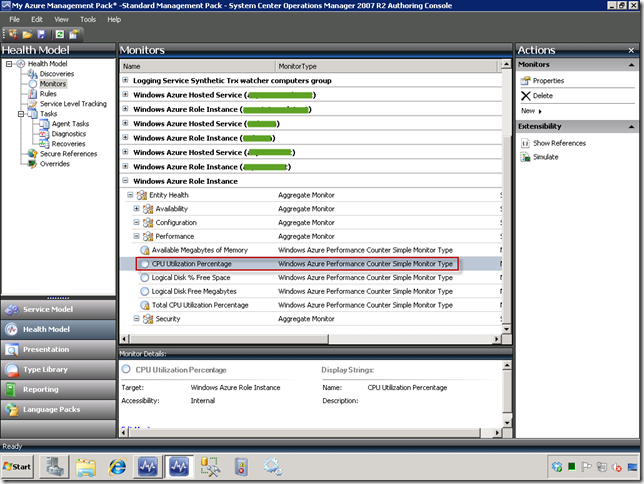
You should now see your unit monitor as below, and you’re ready to export the management pack to your management group. We have covered this in other blogs, so I won’t show how to do it here.
You can see how to setup notifications in the Operations Console based on alerts in my SCOM 2007 R2 Event Log Alerting and Monitoring for Azure Applications blog post. Look for the Setting up Notifications in SCOM section.
