Notes on Monitoring Windows Event Logs and Trace Logs in SCOM 2007 R2
In my previous post, I showed you how to visualize Windows Azure Event logs in SCOM 2007 R2. I would like to extend this post to add on some of my additional learning of dealing with Event logs, and Trace logs as well. First, I want to show how to split out event log errors from warnings. Second, I want to show how to visualize Trace logs as well as setup views that will show them individually from Event logs. Third, I want to show how doing all of this applies to notifications. These are not necessarily in any order.
Event Log and Trace Log Setup
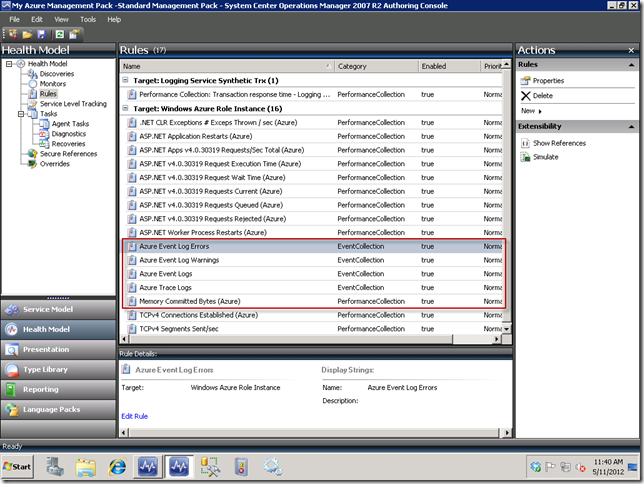
In the screenshot below, notice that I have four rules oriented around event logs and trace logs:
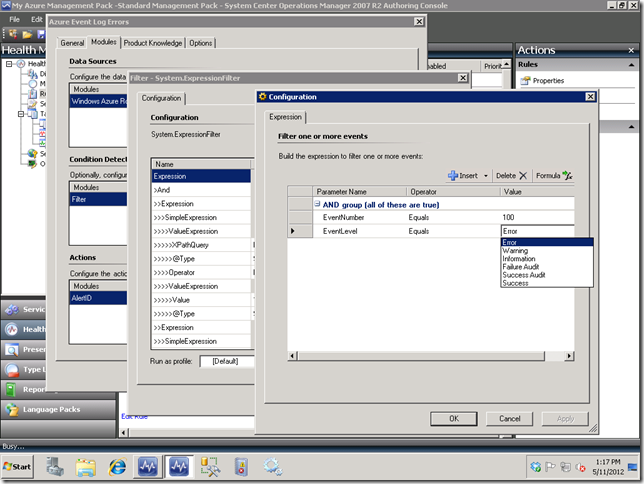
In the first two rules highlighted above for event logs, I have added a filter for Errors and Warnings, respectively. This means log items of others will be filtered out, so the reason for creating these is primarily for notification purposes. Recall in the previous post in the Authoring Console we created a Condition Detection filter that showed how to filter on certain event log channels, so I won’t go through all of the steps again since you can refer to that post. Below, I show how you can alternatively setup a filter for an Error, Warning, or any other type of event. It will translate these into the correct values, so don’t worry if the ordinal doesn’t match up with the event level ordinals you may have seen on various MSDN or TechNet pages.
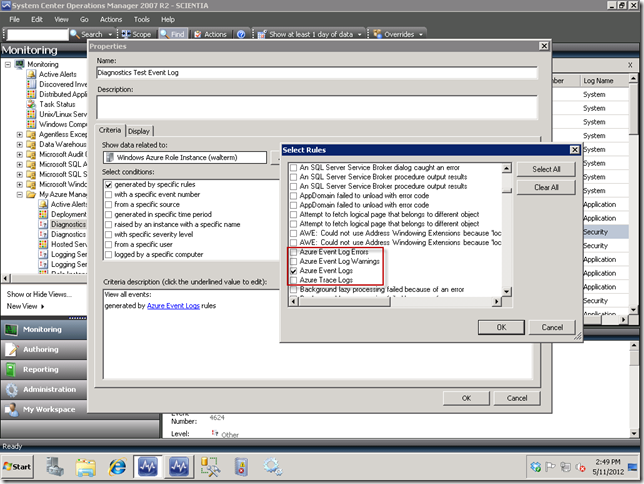
One other thing that you need to be sure to do when setting up an Event log rule for Windows Azure is to go to the Options tab of your rule editor and select the EventCollection category. The reason we have to do this is because when we create a rule for Windows Azure, we always create a custom rule, so we have to categorize this particular type in order to be able to visualize in the Event View, as seen below. If you don’t, then when you attempt to setup an Event View to show items generated by specific rules, your rule won’t show up.
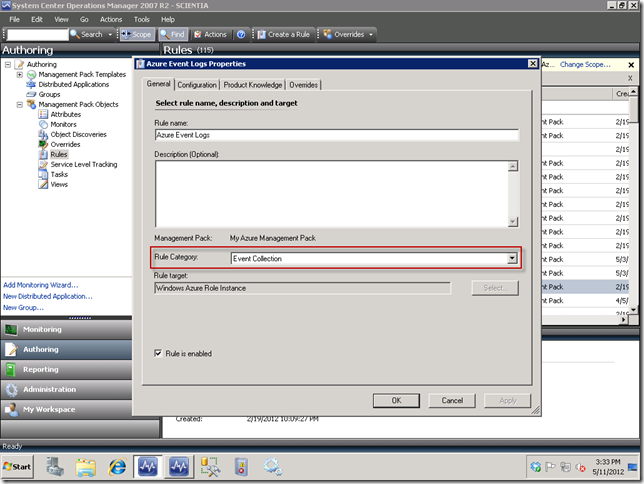
In order to verify that you have the proper rule category setup in the Operations Console, just open your rule and verify in the editor as seen below. If the rule category still has “Custom", then go ahead and change the rule category to Event Collection here.
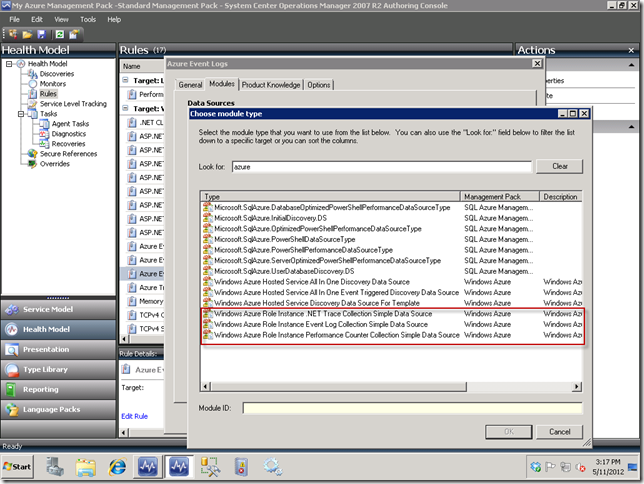
In the third and fourth rules mentioned above, these will respectively bring in all Event log and Trace log items unfiltered for visualizing in SCOM Event Views. One point I want to make here is that in the rule editor there is a different data source for Event logs than for Trace Logs. Notice your choices as seen below, after narrowing down the list by typing “azure” in the Look for: textbox. You will see separate items as follows:
- Windows Azure Role Instance .NET Trace Collection Simple Data Source
- Windows Azure Role Instance Event Log Collection Simple Data Source
- Windows Azure Role Instance .Performance Counter Collection Simple Data Source
So all you have to do is choose the right data source, assure that you have selected the right rule category, and you will have the full event and trace logs at your disposal when creating an Event View for your Windows Azure applications and also when you create a new notification subscription.
Notification Subscriptions
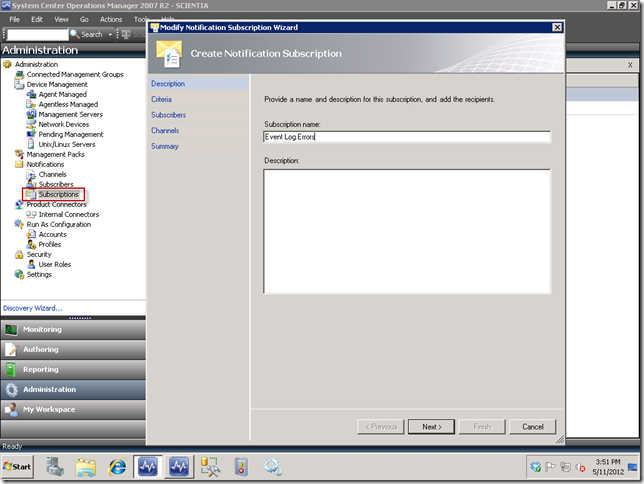
If your event and trace logs are setup properly above, then setting up notifications are straightforward, provided you have also properly setup your Channels and Subscriptions as described in my blog post SCOM 2007 R2 Event Log Alerting and Monitoring for Azure Applications, in the Setting up Notifications in SCOM section. In the screenshot below, I am setting up a notification subscription in the Administration view under the Subscriptions node.
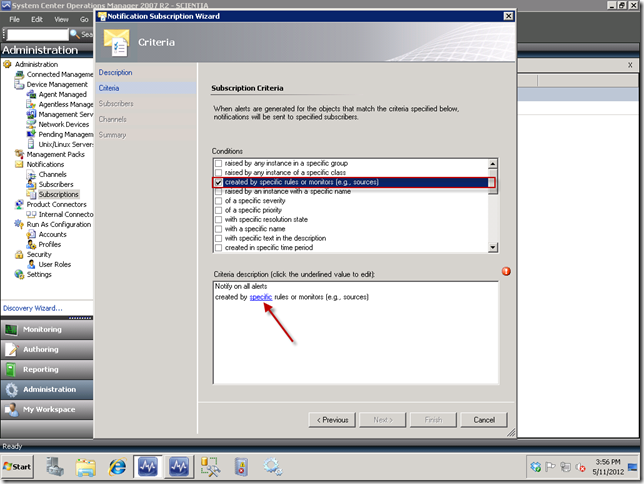
When you click the Next button, you would select the created by specific rules or monitors (e.g., sources) checkbox, and then select the specific rules that will generate your notifications. So you would click on the specific link as seen below.
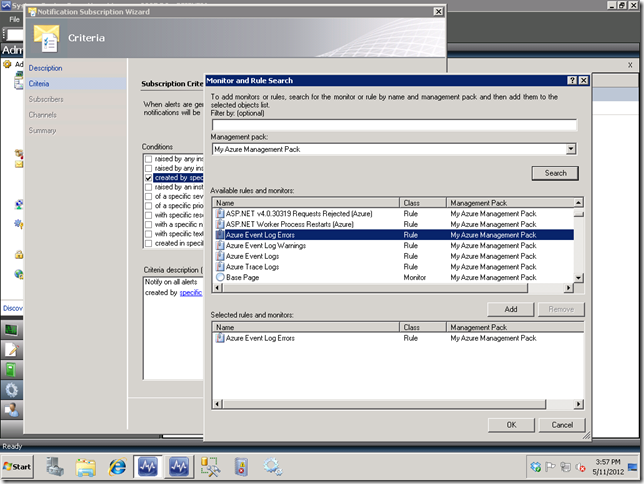
Once you select the specific link, you would then select your management pack in the Management pack: dropdown, scroll down to your rule, and then double-click it or select the Add button to add it to the Selected rules and monitors: list box as seen below.
So there. You should be all set now with respect to Event and Trace logs in terms of displaying them and setting up notifications, given the proper setup we discussed. Please feel free to post any comments or questions!
