Visualizing Windows Azure Event Logs in SCOM 2007 R2
In this blog, I will demonstrate how to visualize event logs in SCOM 2007 R2. Even though the Windows Azure Management Pack documentation says that the management pack “collects and monitors Windows events,” it doesn’t simply collect them on its own. It will only collect them if you create an event collection rule to collect them. In order to create any rule for Windows Azure, as we have seen in previous posts, you must either modify your management pack manually, or leverage the trusty Authoring Console, which ships with the System Center Operations Manager 2007 R2 Authoring Resource Kit which can be downloaded here. I will assume you have read my previous blog on configuring performance counter rules that shows in the beginning how to export your management pack and open it in the Authoring Console (there is a gotcha I pointed out regarding CU4 that I believe has been fixed in CU5, but haven’t checked it out yet).
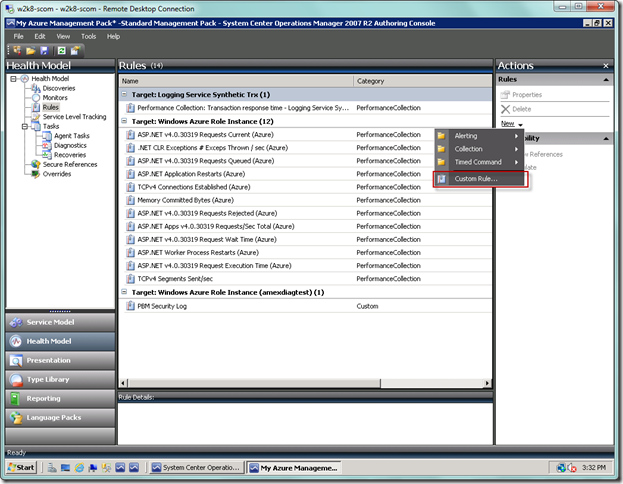
So presuming you now have your management pack loaded in the Authoring Console, and you are in the Health Model view, and your Actions pane is visible, in the right-hand corner you will need to select the New link and Custom Rule… from the fly out menu as seen below.
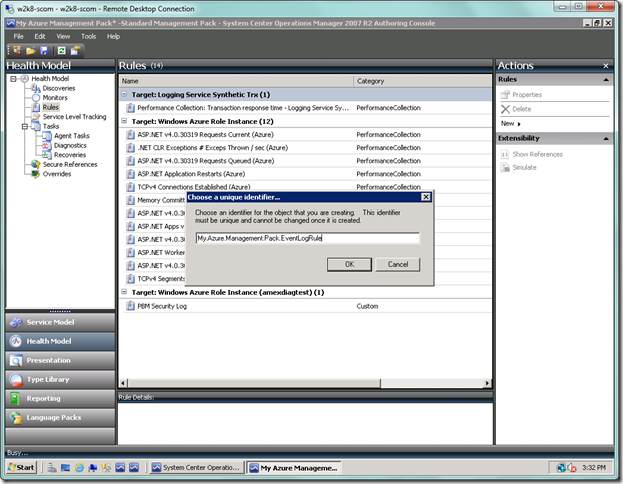
You will now see a dialogue asking you to complete the unique identifier for your rule. Tack on something like “EventLogRule” and then press OK, as seen below.
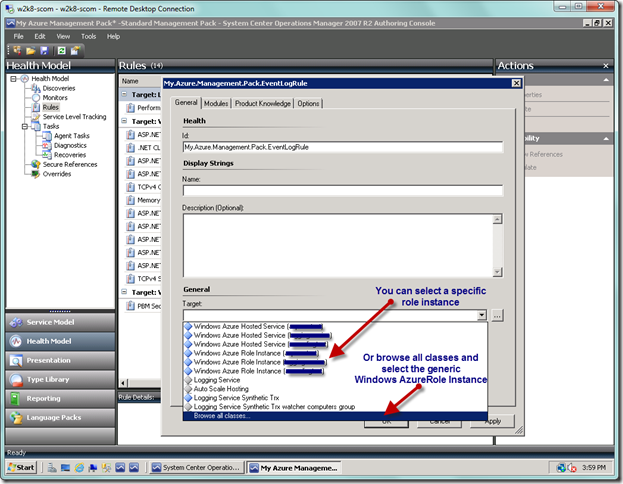
You should now see the dialog below that will allow you to configure your event collection rule. But there is a decision point here. You can either select a specific Windows Azure Role Instance from the Target dropdown, as seen below…
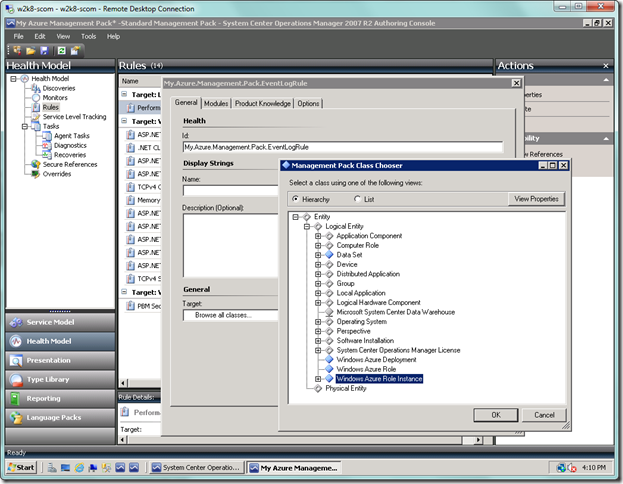
Or you can select the Browse all classes… item and then select the generic Windows Azure Role Instance, as seen below…
If you select an individual role instance, then you will have to create a rule for each of your applications. If you select the generic Windows Azure Role Instance, then this will be inherited by all of your role instances. Which path you decide on depends on your situation, but what you need to consider is if you require conditional filters that will apply to all of your role instances, or if you will vary the conditional filters on a role basis. Even though when you create event views in the Operations Console you can filter on criteria such as Source, Event Level, and Event Number, you can only filter on the name of the event log (e.g., Application or System) within the event rule filter itself. But if you don’t create a filter in the Authoring Console, you won’t be able to create one in the Operations Console and will have to go back to the Authoring Console to add the filter. Also, when you create a filter, it constrains what is actually collected, and whenever you make changes the changes only apply moving forward and not retroactively. I know, what a pain.
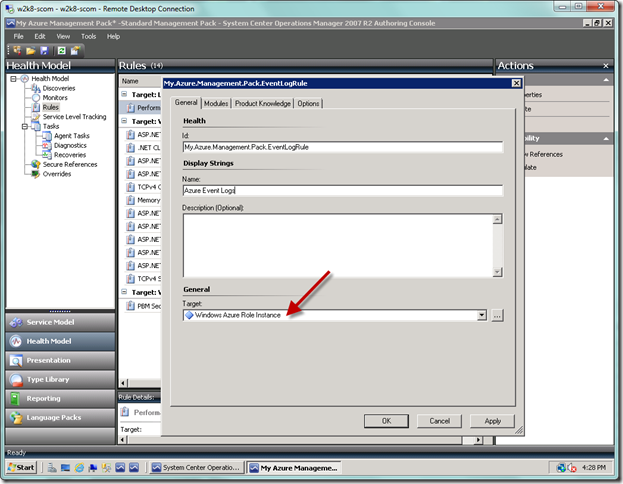
What I decided to do for this exercise was to use the generic role instance, and to go ahead and add a criteria filter in the Authoring Console to capture both System and Application event logs. That way, I can modify in the Operations Console at a later time. Be forewarned that if you make a change to the event rule filter in the Operations Console, even if from an individual role instance, then your change will apply to the base as well as all other instances. So it may work better for you to create these rules on an individual role instance level. Now that we have that established, you can see below on the General tab where I selected the base role instance so this would propagate to all role instances.
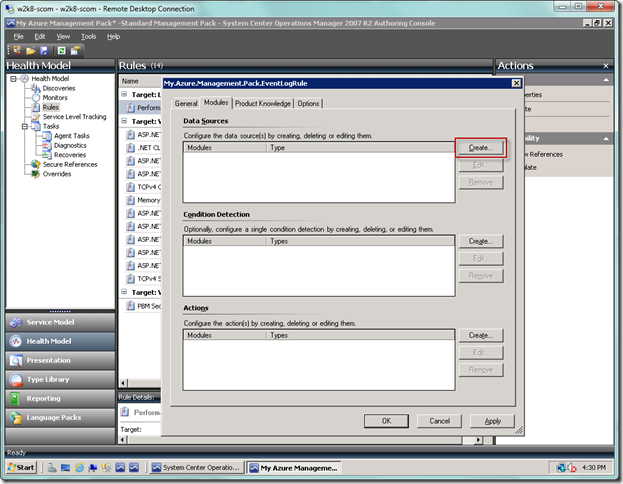
Now click on the Modules tab, as seen below, and let’s create our Windows Azure data source by selecting the Create… button below.
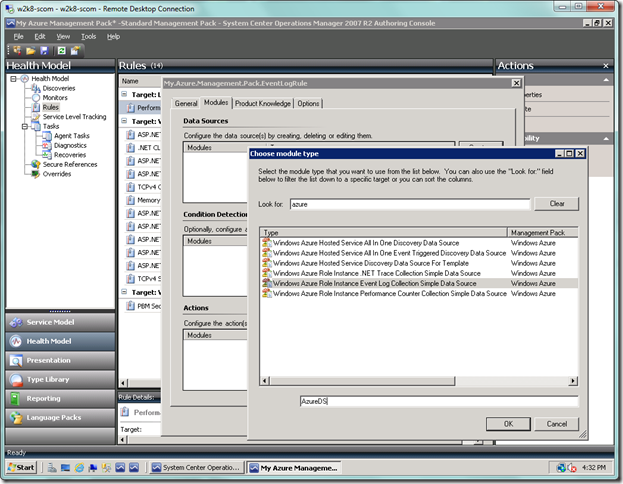
Type “azure” in the Look for: textbox to narrow down the search, select the Windows Azure Role Instance Event Log Collection Simple Data Source item in the list box, and type in “AzureDS” as your Module ID. Select OK when you’re done.
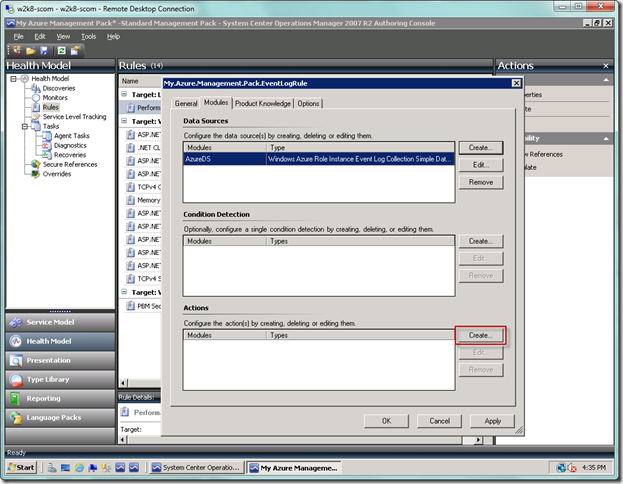
Your screen should now be as seen below. Next select the Create… button in the Actions area at the bottom.
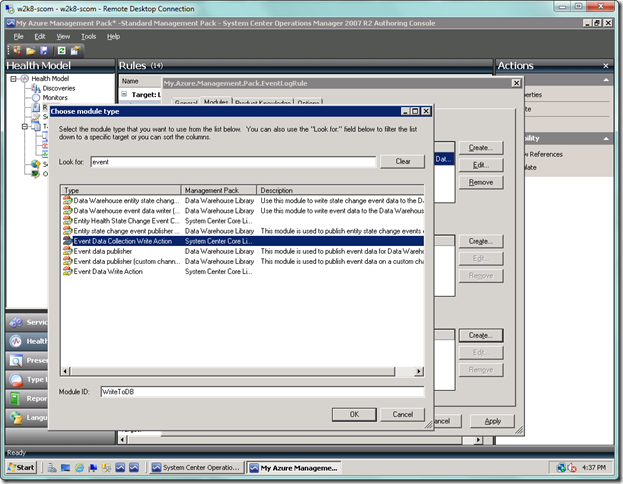
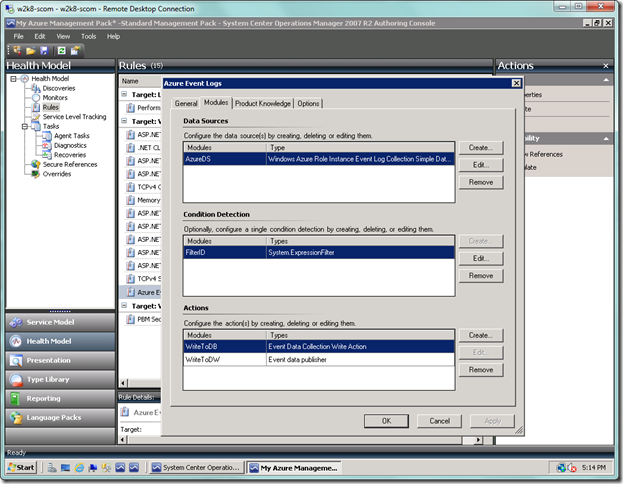
You will now be in the Choose module type dialog. Type “event” in the Look for: textbox in order to narrow your search. Choose Event Data Collection Write Action, which is the action that will write to the SCOM operational store. Then type “WriteToDB” in the Module ID textbox. Click the OK button when done.
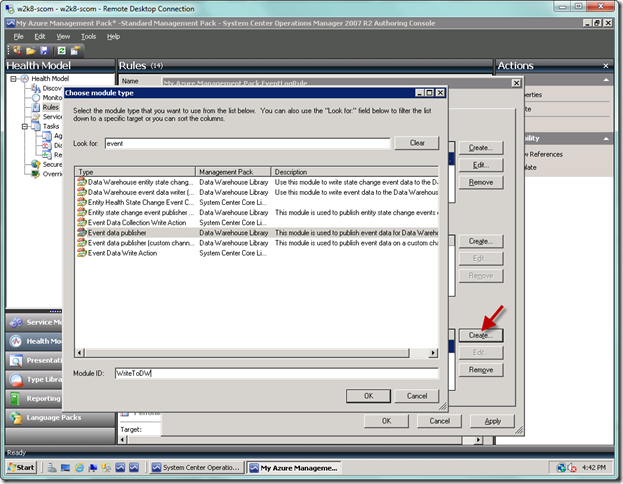
Now click the Create… button again so we can setup up collection to the SCOM data warehouse. This time, select the Event data publisher item and type “WriteToDW” in the Module ID textbox as seen below.
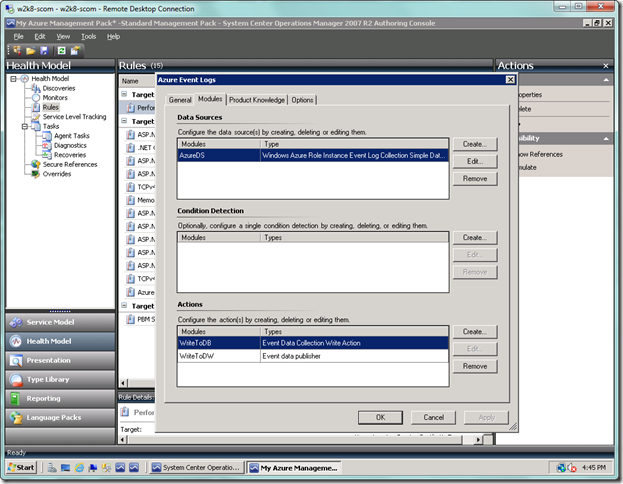
Your screen should now look like below. This is the basic setup, and if you don’t wish to have any filter criteria, then you would accept the dialog from here. Otherwise, you would select the Create… button in the Condition Detection area. Since we will be adding criteria, we will select the button.
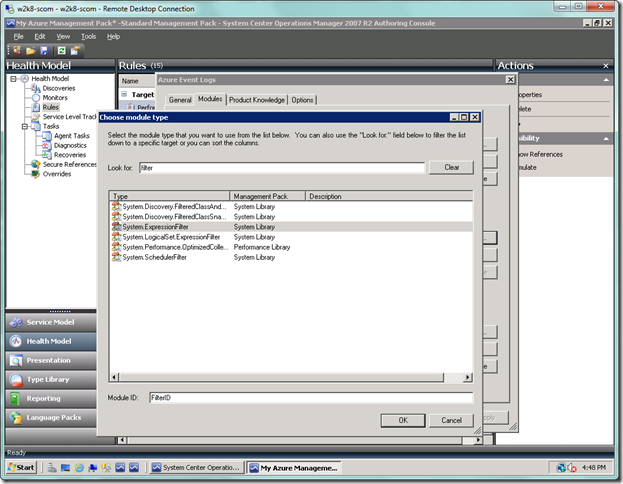
In the Condition Detection dialog, type “filter” into the Look for: textbox to narrow your search. Select the System.ExpressionFilter item, and then type in “FilterID” as the Module ID at the bottom. Select the OK button.
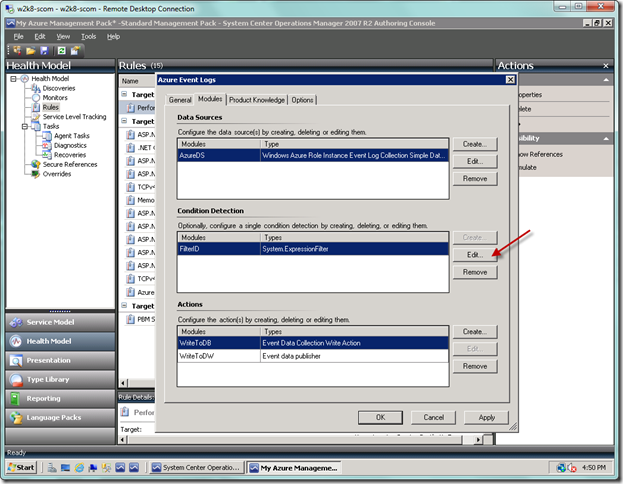
So we look like below now. We’re not done with the filter, so we must now select the Edit… button to configure the filter.
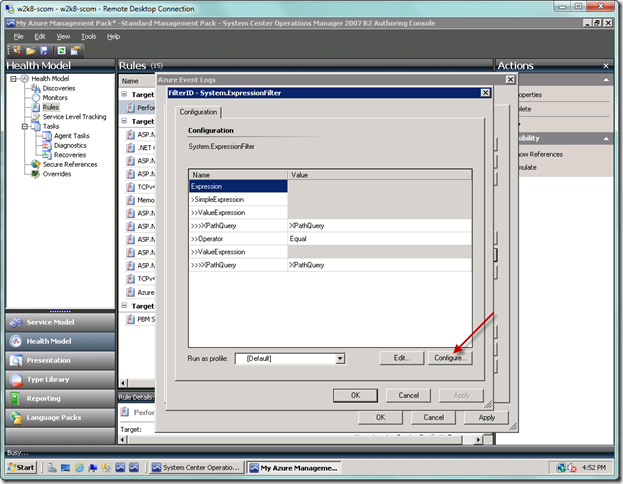
You will now see the filter configuration dialog. Select the Configure… button, which will make your job much easier, unless you really enjoy writing XPath queries.
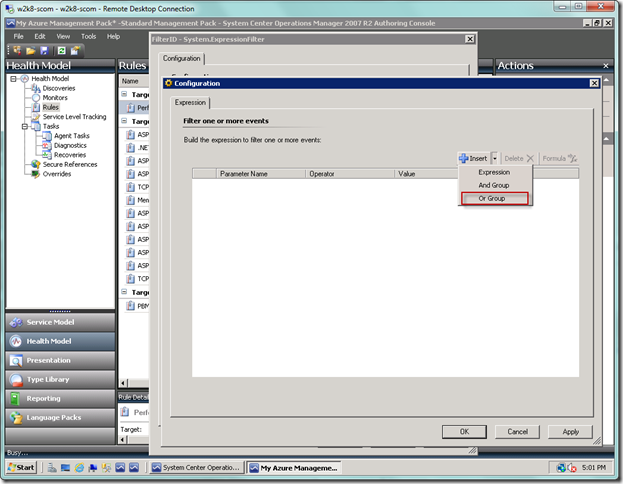
In our case, we will add an OR group so we can filter the rule to only accept the System and Application logs.
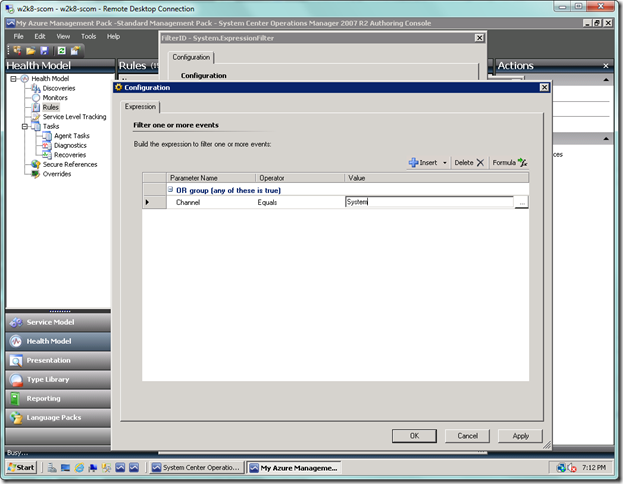
Add your criteria to the OR group. Typical parameters that you can use are below. These and others are documented in the Management Pack Authoring Guide as part of the System Center documentation.
- Channel – name of the event log such as Application or System
- Event Number – select specific event numbers you would like to show (you can filter this in the Event view)
- Publisher Name – source of the event (you can filter this in the Event view)
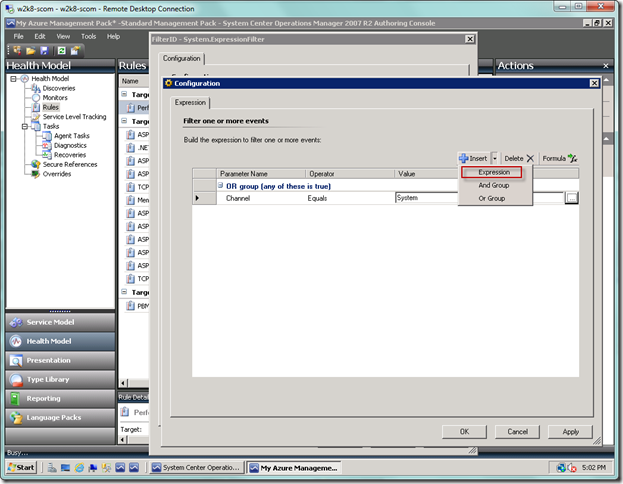
So now go ahead and add your first filter condition.
Using the Expression button will add another condition.
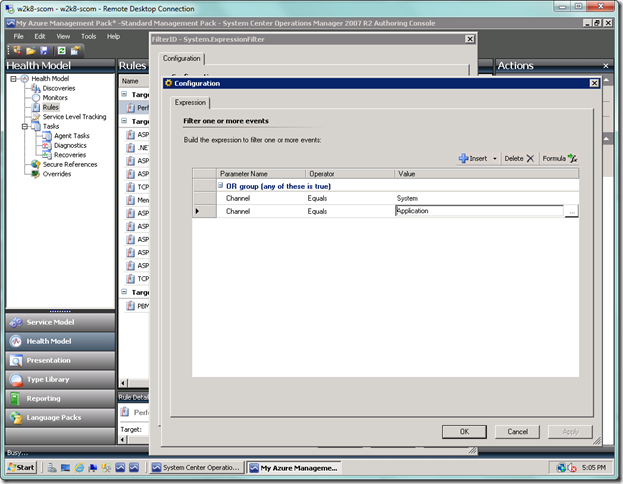
Now fill in your remaining conditions, if you have any. I have my filter set to only pull from the System and Application event logs. Select OK when you’re done.
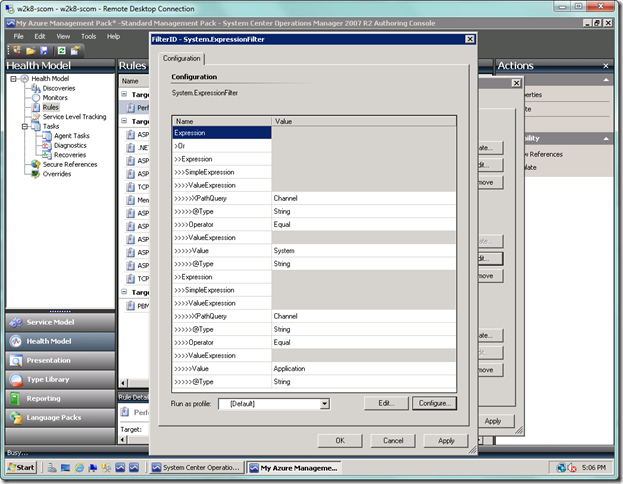
Now you see the final expression. Select OK.
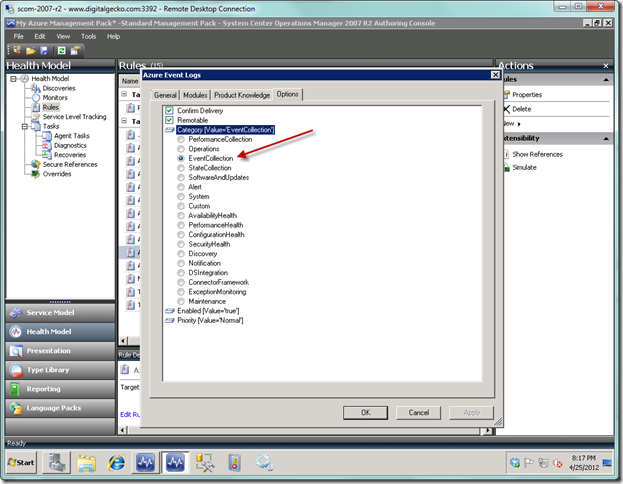
Last, but not least, we need to set the category for the rule to EventCollection in the Options tab. The primary reason for this is if we want to be able to filter on the log name in an Event view (such as if you want Application and System events in one view and Trace logs in another view). If you don’t do this, then your rule won’t show up in the “generated by specific rules” condition in the properties page for your Event view, and thus you won’t be able to select it. So do set the category as seen below.
And now you have your final event rule ready to go.
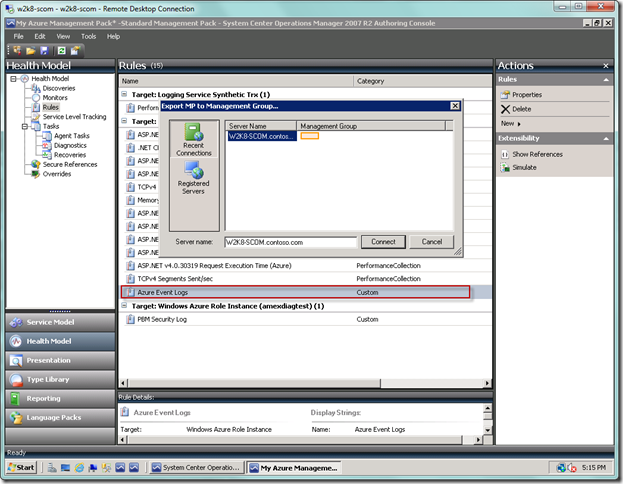
We’re done creating the rule in the Authoring Console. Let’s now go ahead and export the management pack back to the management group (from Tools | Export MP to Management Group… ).
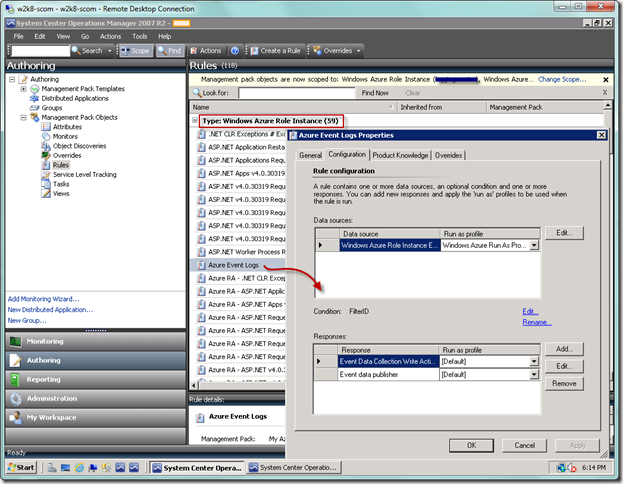
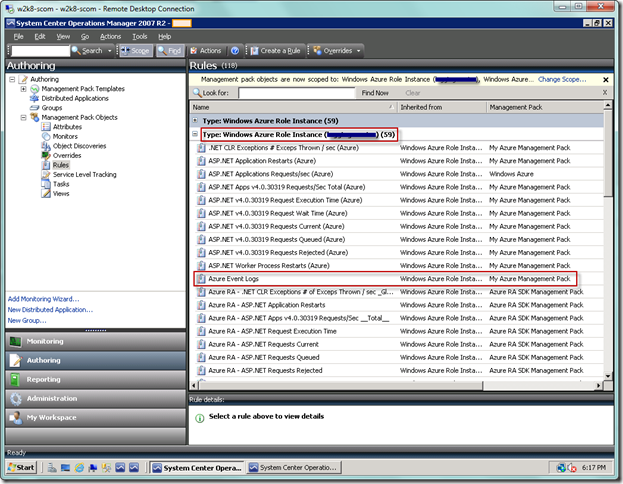
Now let’s head back to the Operations Console. Once there, go to the Authoring view and select the Rules node. Locate your event collection rule in the Windows Azure Role Instance type.
Click the Edit… button in the middle of the dialog and verify the filter criteria. Click OK to leave the dialog, and then close the underlying rule dialog.
You can next scroll down to any individual role instance and see the event collection rule is there as well.
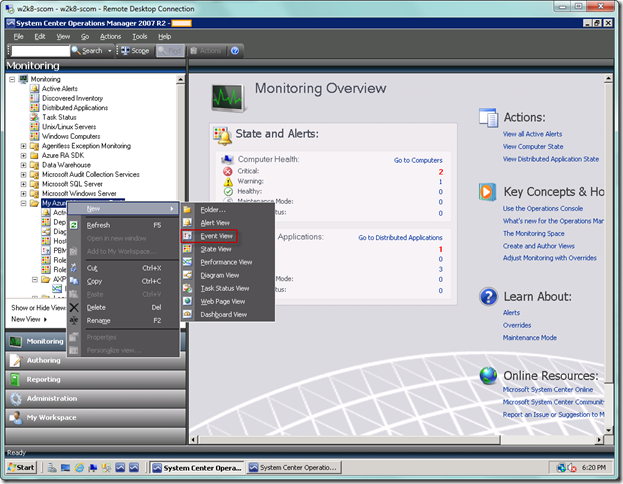
Let’s now go to the Monitoring view. Right-click on the management pack where you added the rule. Select New | Event View, as seen below.
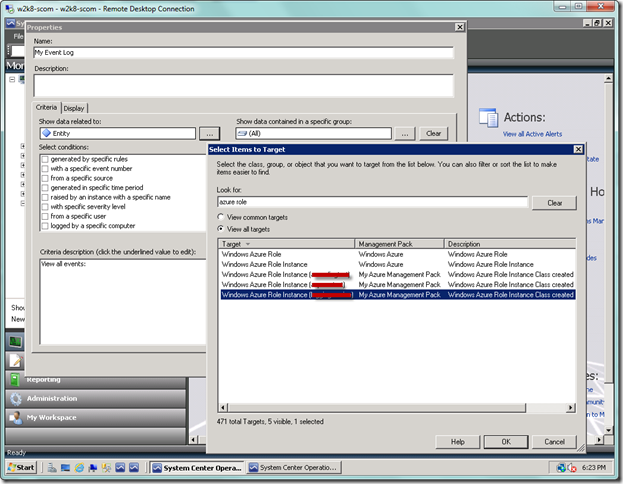
Type in a name for your event log, and then select the ellipsis (…) after the Show data related to: label with Entity selected by default. From the Select Items to Target dialogue, find your role instance, select it, and then select OK. From the original dialog, select OK.
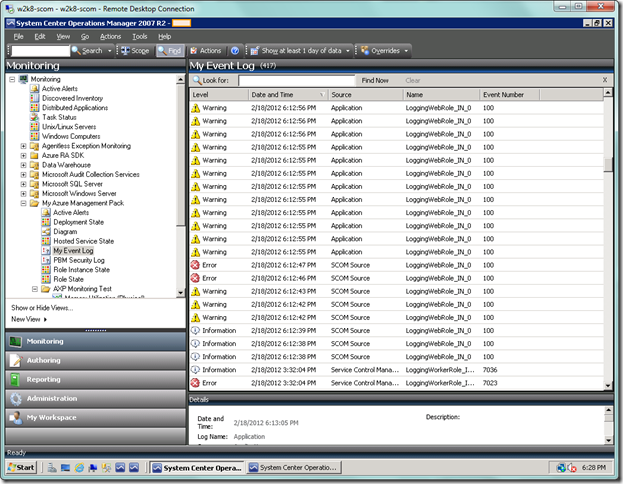
If you don’t immediately see the events pouring in, please give SCOM time. Patience is a virtue with SCOM when it comes to data collection. You should use a tool such as the Cerebrata Azure Diagnostics Manager to verify that your events are actually being written to Windows Azure storage for this application that you are monitoring.
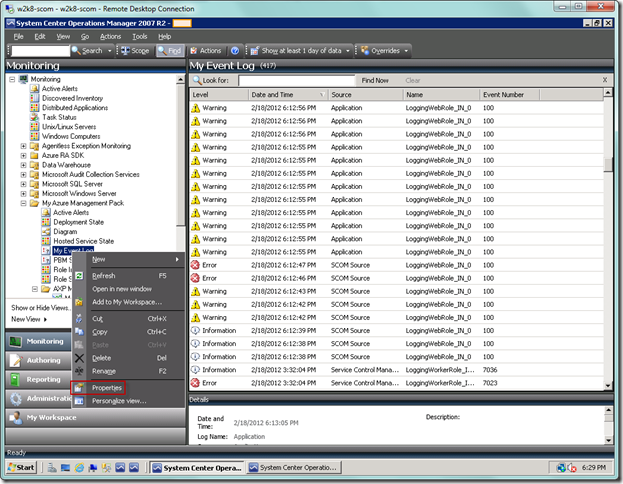
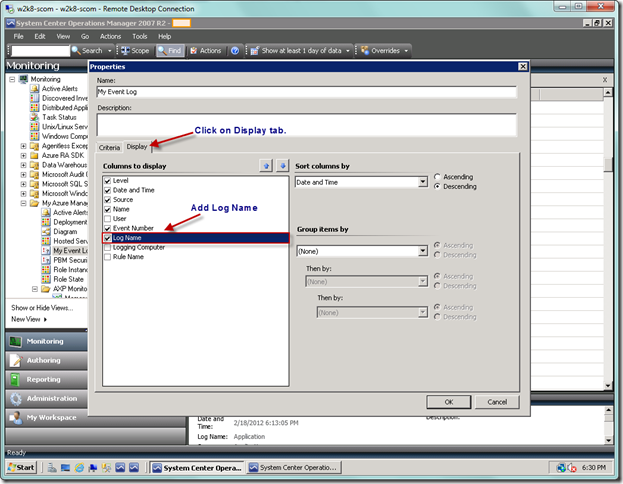
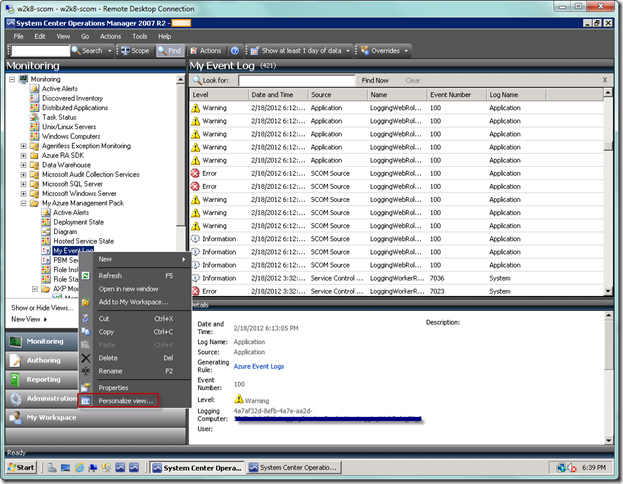
If you want to add additional columns, you can just get properties on your event view, as seen below.
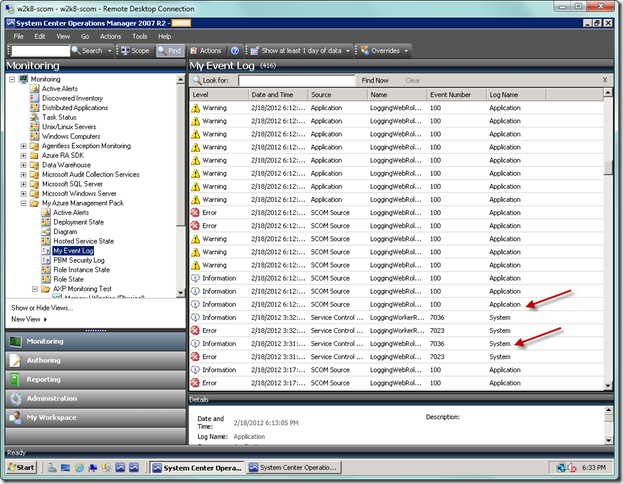
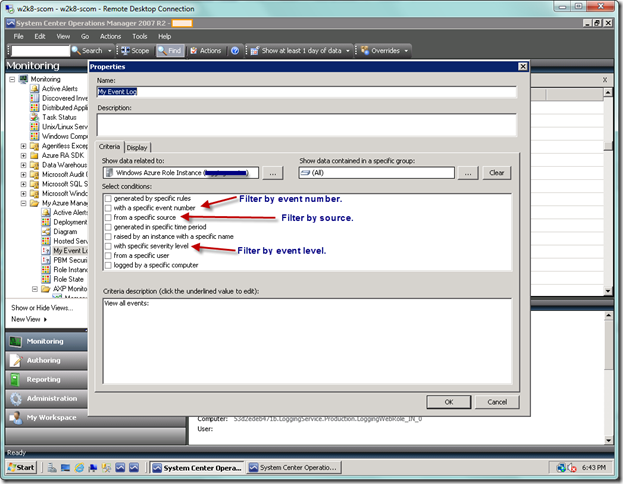
Select the Display tab and add the columns you want. I always add the log name.
As you can see, we’re capturing both Application and System logs.
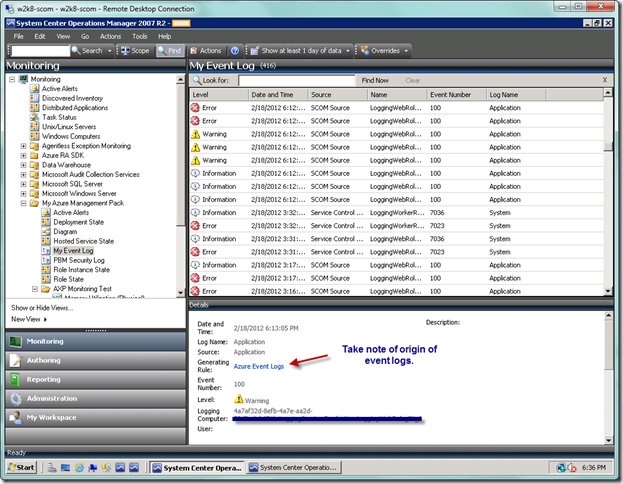
Now let’s take note of where the Event view gets the event logs from. Based on our target, it looks to see if the target is collecting event logs, and thus picks up the logs from the available rule. I haven’t tried writing multiple event rules to see if they show up also, but I suspect if you have multiple rules then you have conditions that collect different event logs or different variations of actual events.
If you want to further filter on certain columns without affecting the rule itself, you can just go into the properties page of the view and select what you would like to filter on.
As seen below, I have pointed out a couple of possible selections for filtering. As I wrote earlier, if you want to filter by the actual log name (e.g., Application or System), you can go back and change the filter of your individual role instance that inherited from the base role instance event collection rule.
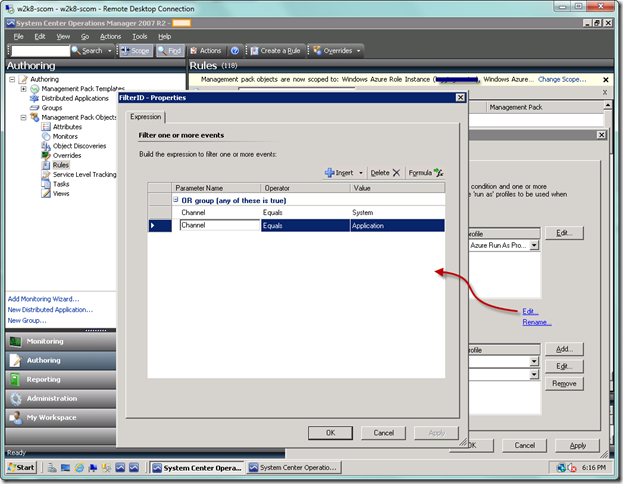
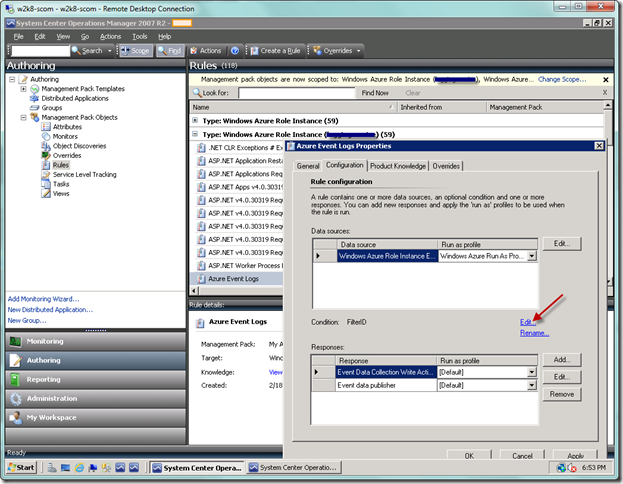
In order to change the filter you would go back to Rules in the Authoring view, open the event rule, and select the Edit… link in the Condition section as seen below.
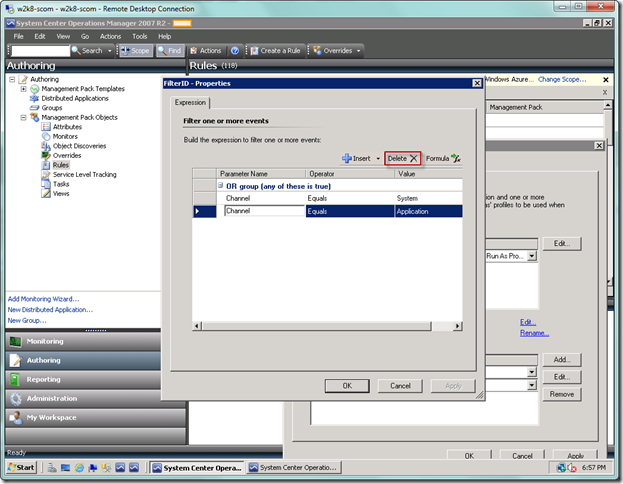
From the property page, you would just modify the condition as desired. As noted above, this change will be propagated to the base role instance event rule as well as all other role instances. So again, you may find this is not desirable for you and want to create the event rules on an individual application (role instance) basis.
That’s it. Good luck and let me know if you have any questions or issues. Next time I will blog on setting up Service Level Tracking, and I will eventually get around to SCOM 2012 also!
