Getting Started on Manual Testing With Microsoft Test Manager 2010
The Microsoft Test Manager 2010 is a new manual testing tool that integrates fully with Team Foundation Server 2010. This tool is designed for the Test professional, and integrates the management of test plans along with their test cases into the full development lifecycle of a Team Foundation team project. It delivers another degree of traceability in your projects through the tracking of test cases and the results that flow from the running of test cases. You can even generate a bug directly against a test result. Visibility is increased because results are reflected in reports that provide test status along with work progress for each requirement. If you are using TFS 2010 and are serious about effectively tracking defects throughout your project, you should take a hard look at Test Manager 2010 to determine if it meets your needs.
This walkthrough assumes that you have some familiarity with work items in TFS 2010, such as User Stories/Requirements, Bugs, and Tasks. I will be posting a later blog on use of hierarchical work items in terms of effective work item relationships. I will also consider following up with a getting started blog on Automated testing, as I know there is a lot of interest in this area.
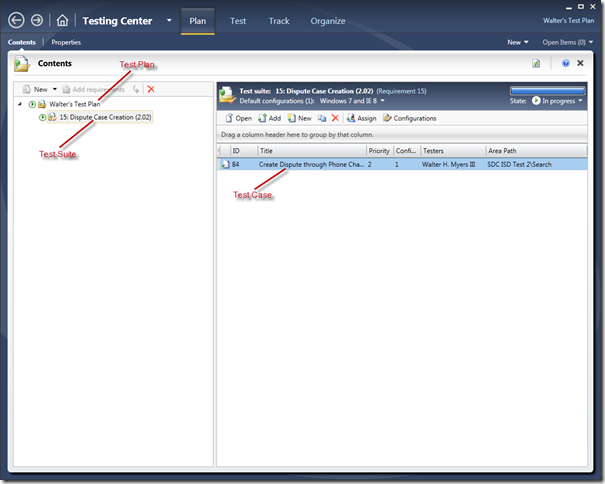
From the perspective of Test Manager, we have a three-layer hierarchy as follows:
- Test Plan – you begin with Test Manager by creating a test plan
- Test Suite – within each test plan, you may have multiple test suites
- Test Case – each test suite is composed of multiple test cases
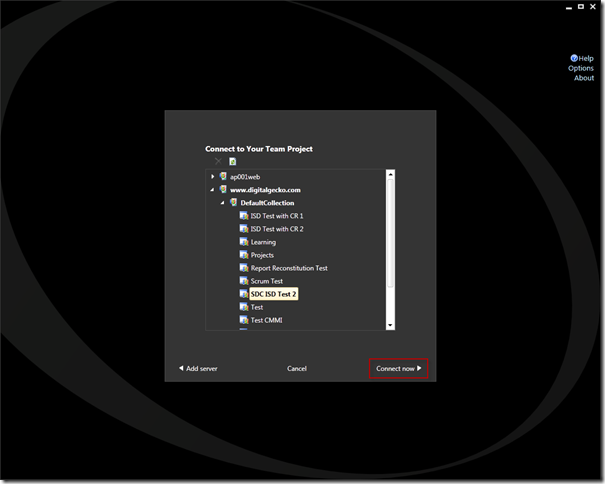
The first time you launch Test Manager, you will have to point it to the TFS team project you would like to work with, as this project will be needed for Test Manager queries, and is where work items generated by Test Manager will be stored. Of course, work items generated by Test Manager will be available to the team members using Visual Studio 2010 and Team System Web Access. I selected my desired project and selected “Connect now,” as seen below.
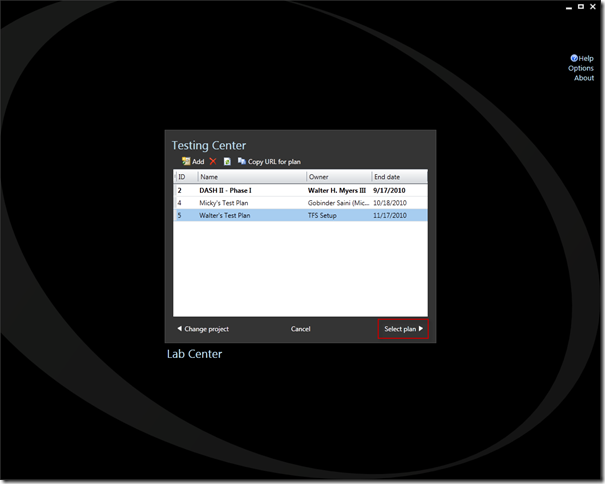
Once you have selected your team project, you will see the list of current test plans (note that I have three test plans, and will select the test plan named “Walter’s Test Plan” that I just created):
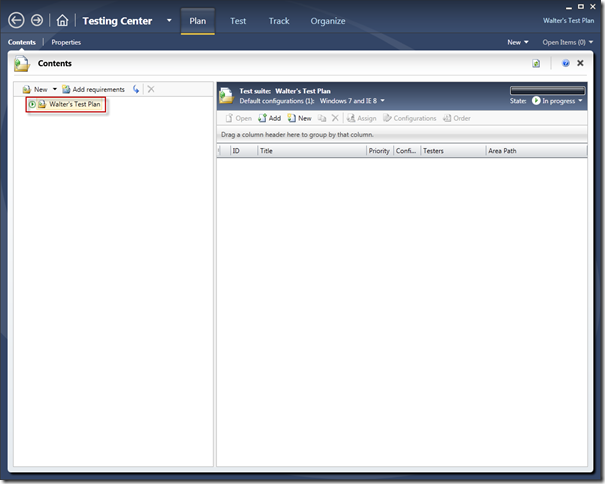
When you select a plan, you are taken to the Testing Center as seen below, defaulting on the uppermost Plan tab and the lower Contents pane. Your test plan is the topmost node in left-hand pane, which will have test suites as children. On the right-hand side are the test cases that comprise the selected test suite. In order to add test suites, you have the following options:
- Create a new, blank suite
- Create a new, query-based suite which will allow you to select one or more existing test cases in TFS
- Create a new suite based on one or more existing requirements in TFS
- Copy test suites from another plan (the curved arrow button)
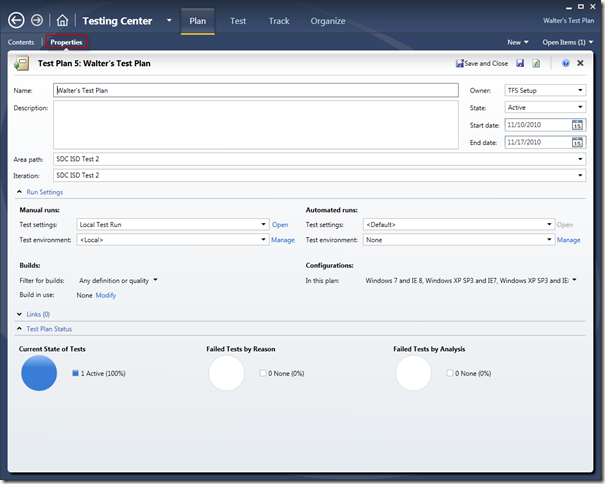
The first order of business is to set specific properties on your test plan, by selecting the Properties pane as seen below. On this tab you can select the Area Path or Iteration for your team project, assign what build you will for the test plan, specify different test configurations, and see the current status of test runs. Note that I have setup the following configurations: Windows 7 and IE 8, Windows XP SP3 and IE7, and Windows XP SP3 and IE8. These are the most common configurations, so we will want our tests to pass in all three environments. From the Configurations dropdown, you can also manage your configurations.
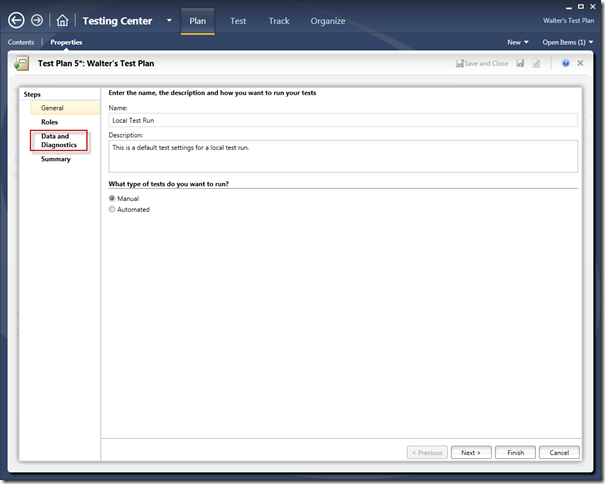
If your “Test settings” dropdown is currently <default>, then select “Local Test Run.” Afterwards, click the “Open” link next to the dropdown, which will yield the Test Settings window seen below. Click on the “Data and Diagnostics” link.
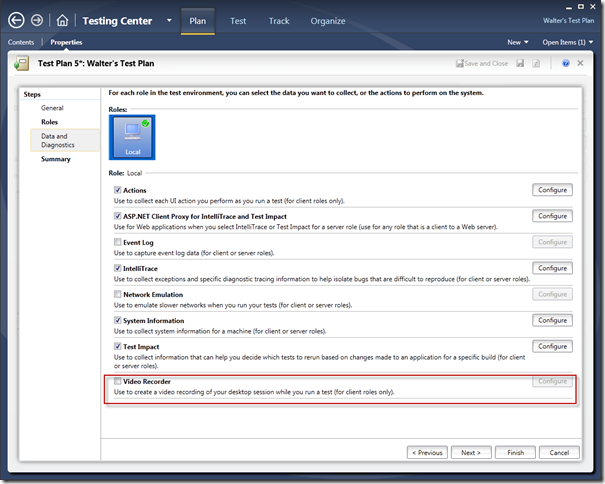
You will now see options for capturing information during the test that will be helpful when creating a bug. If you want a video recording of your desktop session while you run a test (e.g., you may want to record a bug repro), you can choose the Video Recorder option. Use this judiciously as the .wmv files can get big. Obviously, they won’t work well over a slow link.
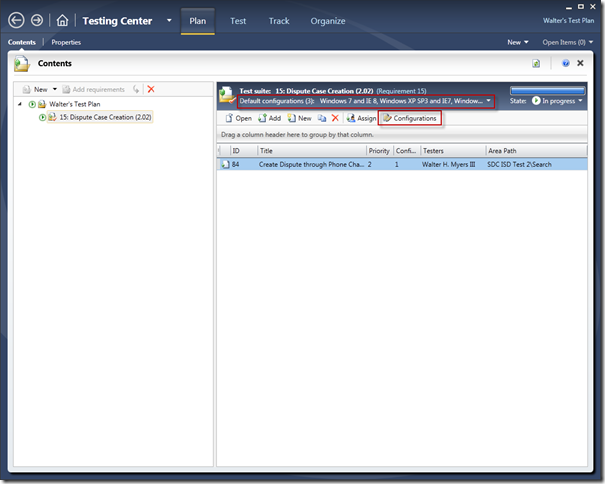
Go ahead and make your desired changes or cancel out of the Test settings window, and let’s take a look at configurations in the Contents pane. We have the Default Configurations dropdown, which in this case at the test suite level is inheriting default configurations to be tested from the parent (which is the test plan). Still, we must select the configurations we actually will perform in the test run for a given test case. So at the level of the test case, we can select the configurations that are applicable to this test case.
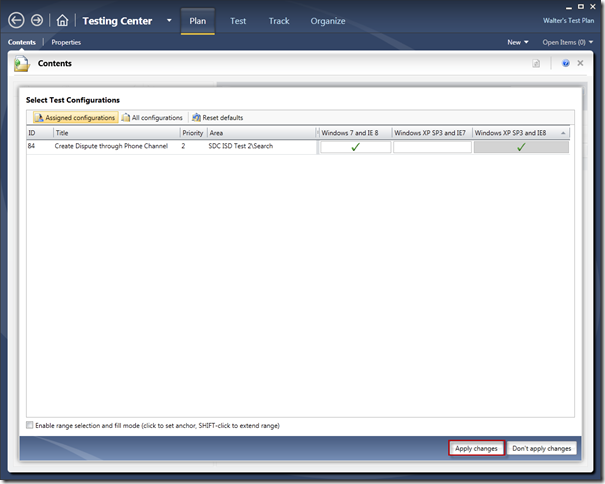
I have selected the Configurations button, which takes me to the following window, where I have selected two configurations to test for this test case, as seen below. You will see this reflected later during the test run.
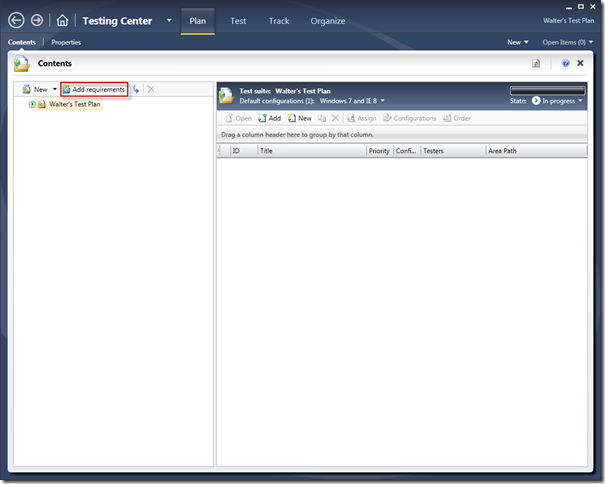
I went ahead and selected the “Apply changes” button, which takes us back to the Contents pane, where we will add a new test suite based on existing requirements. Again, this is just one way of creating new test suites. We will now click the “Add requirements” button, as seen below.
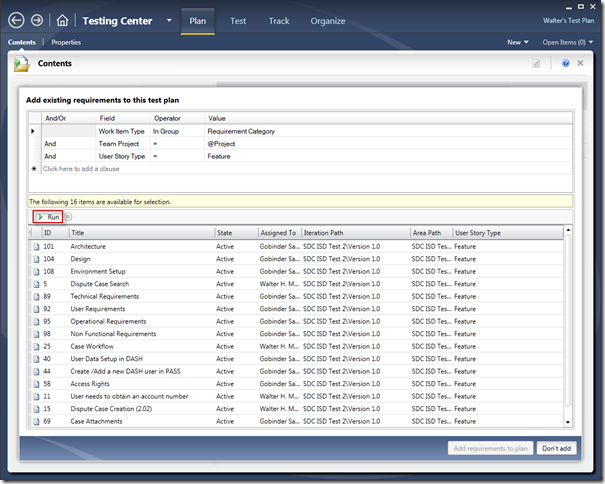
You will now see the query window that will load all requirements in this team project, as seen below. You would click the “Run” button to execute the query. (Note that in my query, I have modified the query to only return User Stories that have been marked as Features. This is because I’m using a modified MSF Agile 5.0 process template that implements a three-tier hierarchy from requirement to task. Specifically, my hierarchy is Feature – Capability – Task. You can find out all the details and download the process template at my blog post here.
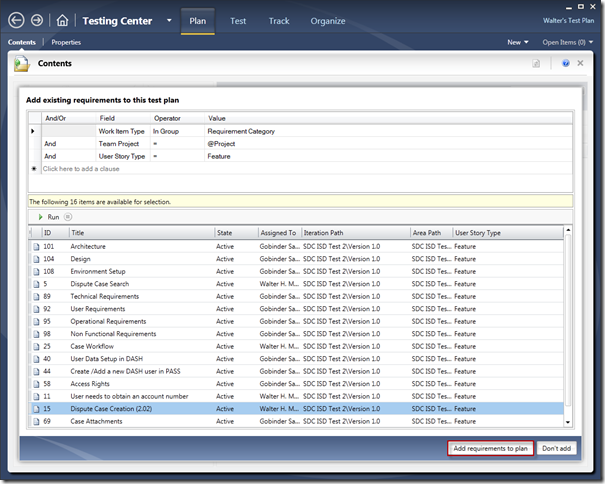
Next, you can select one or more requirements to add to the plan, and then select the “Add requirements to plan” button.
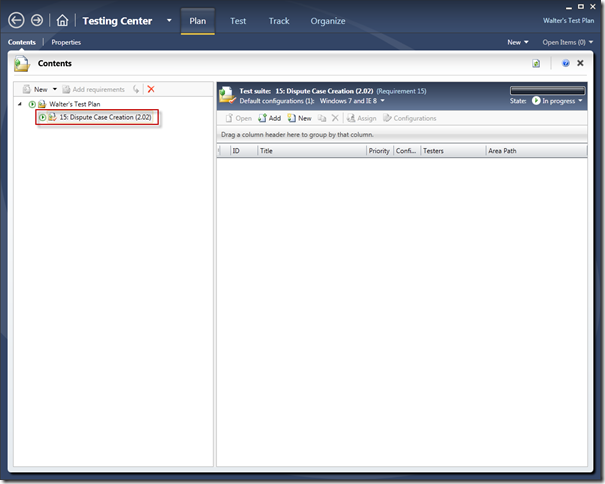
Now we have a new test suite based on a specific requirement, as seen below, and we can begin creating new test cases or incorporating existing test cases into this suite using the right-hand pane. Had I selected multiple requirements, each would have a corresponding test suite in the list below.
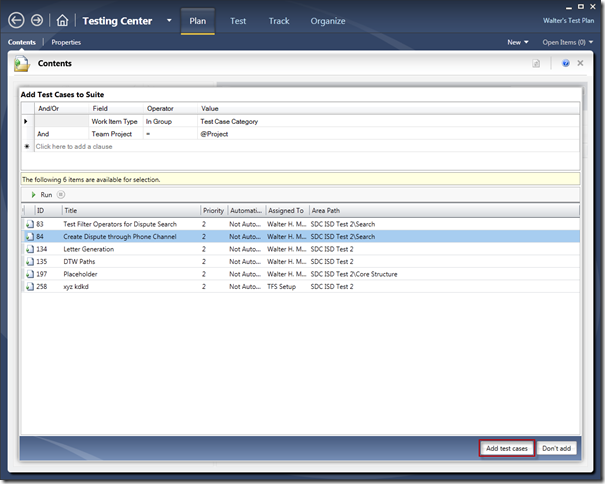
I have already created a test case, so instead of creating a new one, I will select the Add button in the right hand pane, which will take me to the query window as seen below. This window will allow you to select one or more existing test cases. I went ahead and ran the query, selected one, and selected the “Add test cases” button.
So now we have our test plan, test suite, and test case.
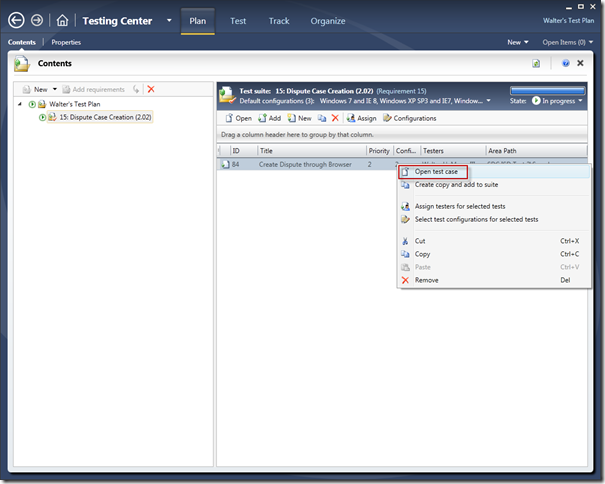
We can now open the test case by double-clicking or performing a right-click and selecting the “Open test case” menu option, as seen below.
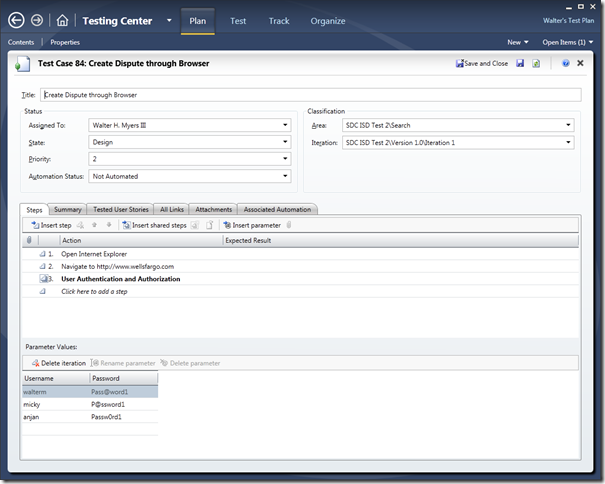
Below is the test case, which in this case has a Shared Step with parameter values (Shared Steps is just one other work item type in TFS 2010). You can share steps between manual test cases by creating shared steps. For example, the test steps to log on to your application under test might have to be run in several test cases. By sharing the steps, you can just maintain changes in the shared steps only. You can get more information on shared steps from the MSDN library online here. The parameter values below driven by the shared step represent the number of iterations you will run, which in this case is three iterations.
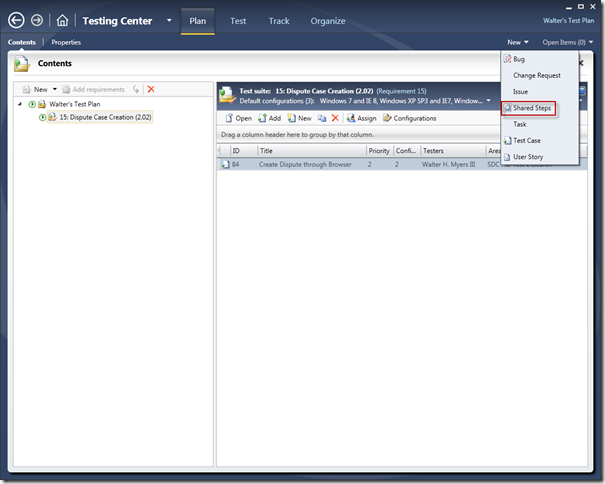
Let’s see how we would create a shared step. From the New dropdown in the upper right-hand corner, we would selected the Shared Steps menu option, as seen below.
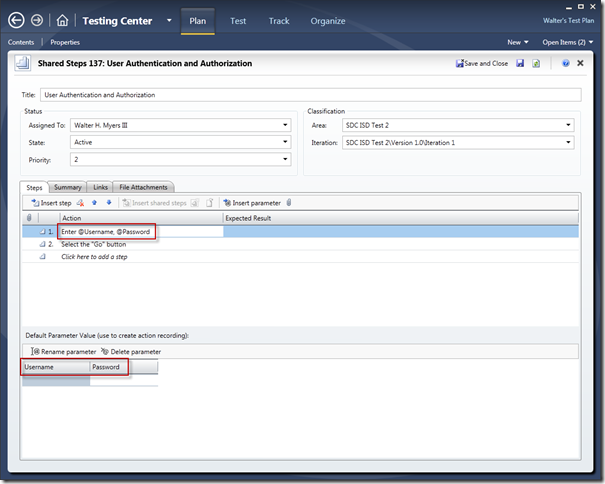
So here is the shared step I have created below, which is a simple two-part step of entering user authentication credentials and selecting the “Go” button. The @ sign allows us to create iteration-specific variables to be used during the manual test pass. In this case we have two variables, Username and Password. I could put the actual values in the table below within the shared step, or put them in the test case that is using this shared step. In this case, I will put the iteration variables in the test case (as seen above).
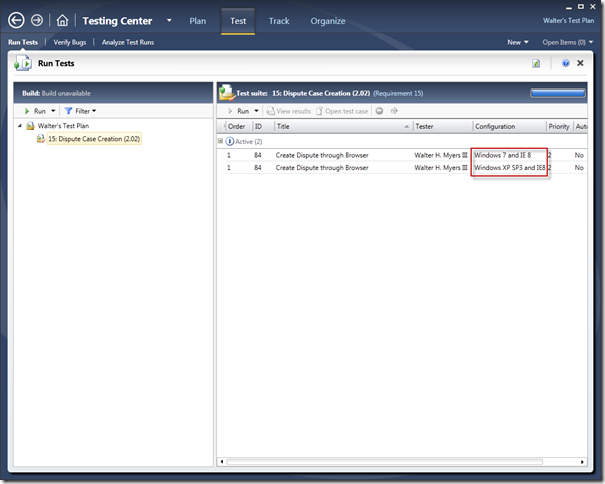
Now we will close the shared step, and then close the test case. We will next select the Test tab at the top of the window, which will take us to the Run Tests pane. We see below that we have two test runs for the same test case because we have two different configurations that were selected. In this case, for the test case must be run in Windows 7 with IE8 and Windows XP SP3 and IE8.
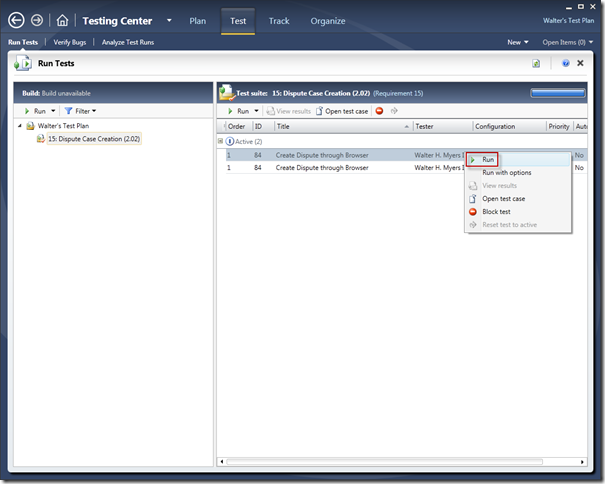
We will now right-click on the test case for the Windows 7 and IE8 configuration, and select the “Run” option in the menu.
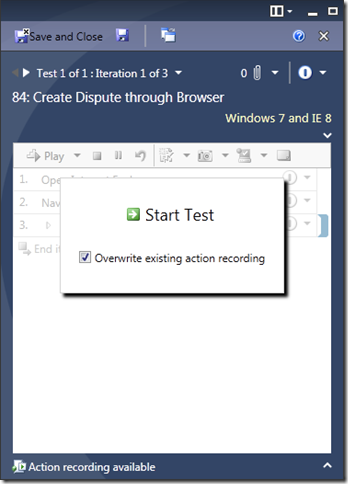
The Test Manager is closed and the Test Runner is launched. Below is the Test Runner at the beginning of our test. The existing action recording associated with this test case will be overwritten (since I have run this test before), beginning with Iteration 1 of 3.
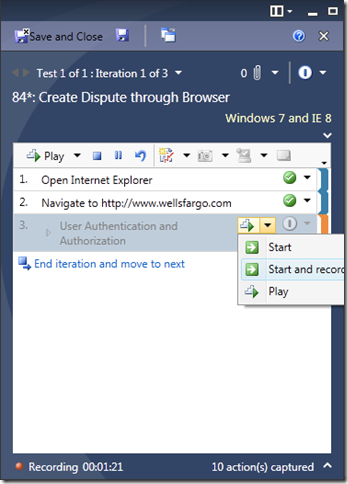
We now follow the steps in Iteration 1, as shown below, checking off Pass/Fail for each test step. When we get to the Shared Step, we will record this step for subsequent iterations by selecting “Start and Record.” You must select this if you want to data bind fields in the Shared Step for later Fast Forward.
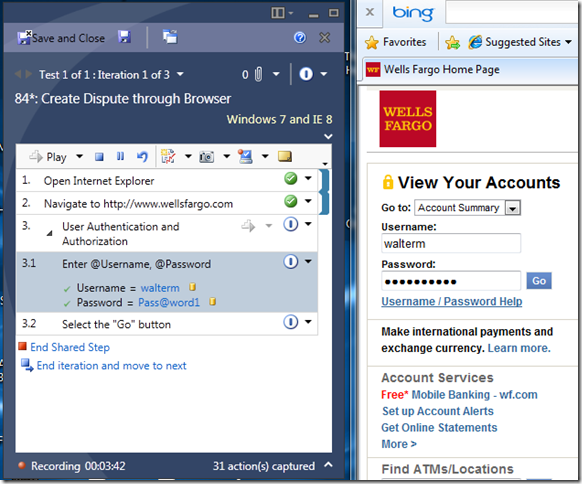
After we select “Start and Record” for the shared step, when I click in the Username field of the browser, it begins recording in this window and places a “Currently Recording” icon in the upper right-hand corner of the browser window. Once I type my values in the Username and Password fields, in that order, the Test Runner has now data bound itself to those fields for subsequent “Fast Forward” iterations in this test run. Note the database icons that appear after I have tabbed out of the mapped fields, indicating the data binding has been successful.
When recording the Test Runner will provide a handy little graphic to the far right on the title bar of the application whose actions it is recording. The graphic looks like this:
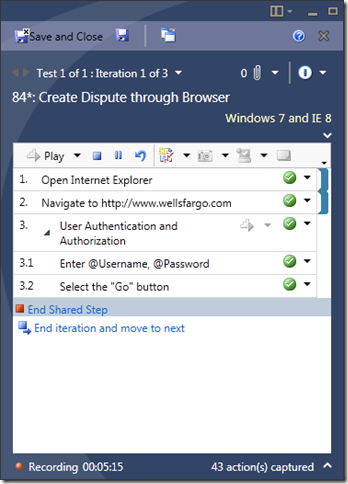
Okay, so I have now selected that everything has passed in this iteration, and then selected the “End Shared Step” as well as “End iteration and move to next” links as seen below.
After you click the “End iteration and move to next” button, you will see the dialog below. Go ahead and overwrite the existing recording. What this means is that this particular shared step has been recorded and is now data bound to the browser page on whose actions we just you recorded. We can now take advantage of Fast Forward, which we will do next in Iteration 2.
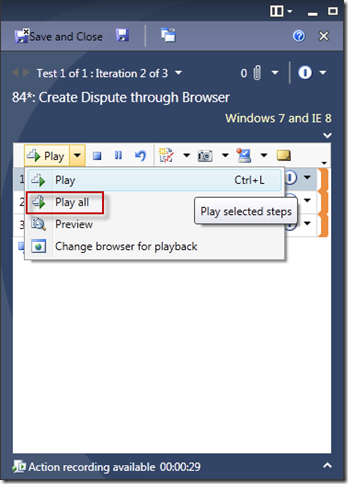
Now the Test Runner takes me to Iteration 2, and I can now use the “Play” dropdown to select the “Play all” button, which implements the Fast Forward feature. My actions recorded in Iteration 1 are played back, and all I have to do is to select Pass/Fail for each step in the test iteration. Since all went well, I then manually selected that each step has passed:
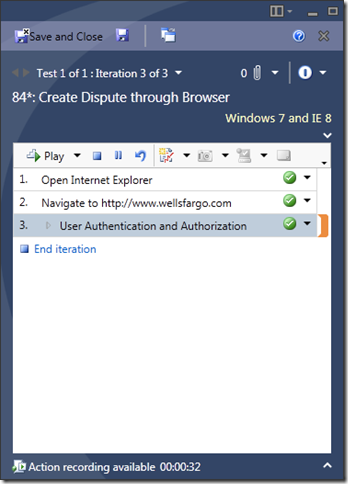
We end this iteration and then perform the same “Play all” Fast Forward process for Iteration 3, and select the “End iteration” button to finish the test run:
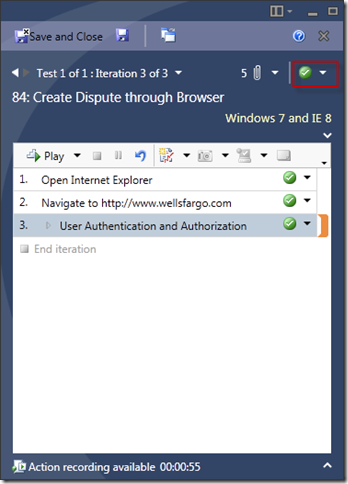
After selecting “End iteration,” the Test Runner automatically selects the “Pass” dropdown in the upper right-hand corner since all steps have passed in all iterations.
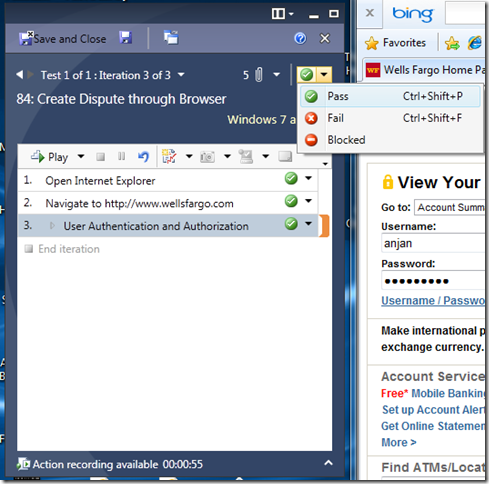
Note that you can select the Pass/Fail drop down and select otherwise, as seen below.
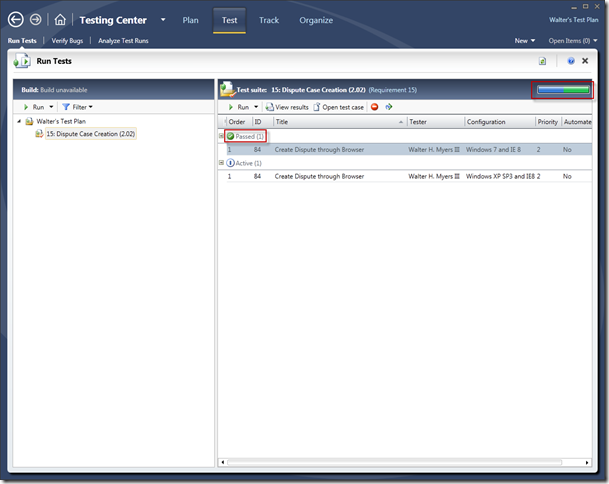
You would then select the “Save and Close” button above, which will take you back to Test Manager, where you will now see your test case is marked as “Passed.” Also note that our status bar in the upper right-hand corner of the pane shows that we are 50% complete in our testing (blue indicates Active, and green indicates Passed).
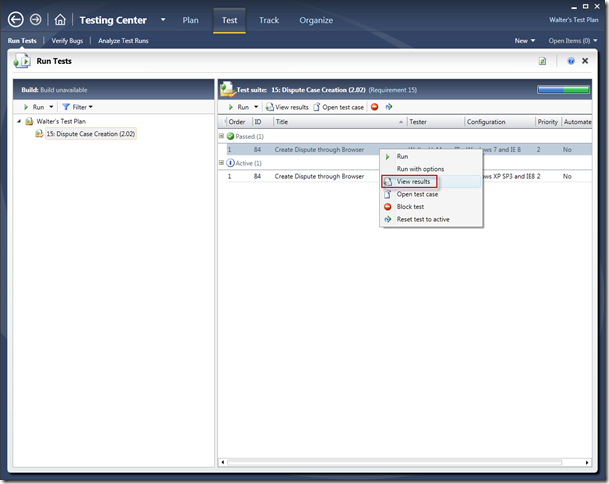
You can now see the results of the test run by right-clicking the Test Case and selecting the “View results” menu option.
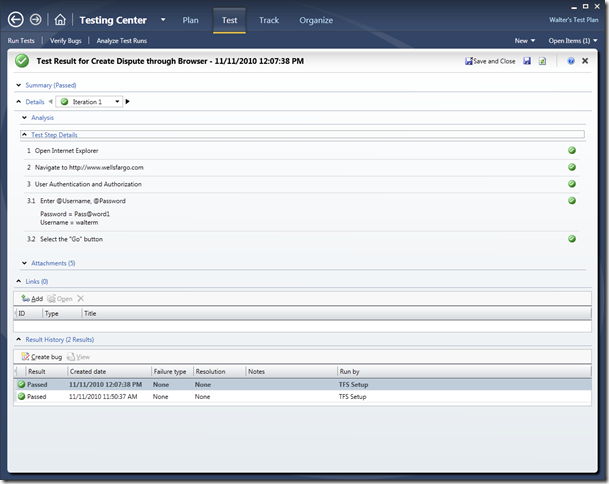
This yields the following test result window, where you can see the results of each iteration, test step details, attachments, and test case result history.
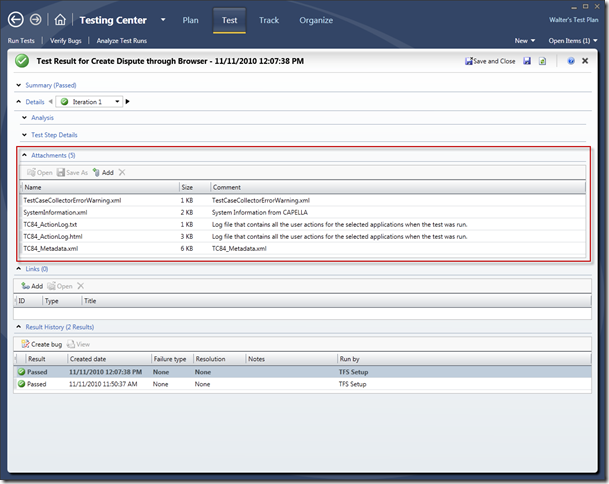
We can collapse the Test Step Details section, and expand the Attachments section which shows diagnostic files generated by the Test Runner, as seen below:
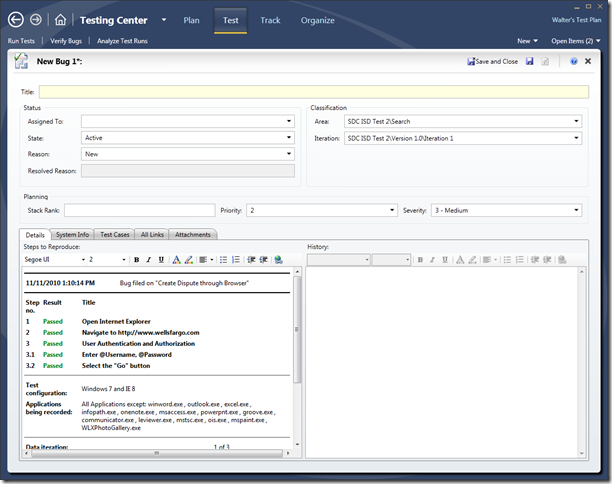
We didn’t have a bug, but for your edification, you can now create a bug directly from this test result by selecting the “Create bug” button, yielding the following window below. This is real coolness.
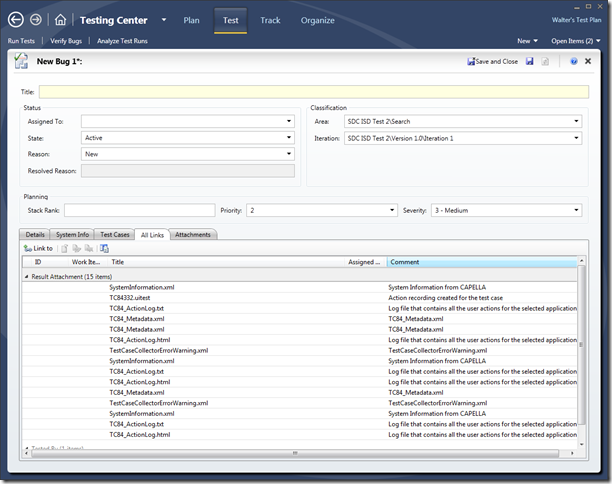
If you select the “All Links” tab in the Bug, you will see the attachments from the test run above are included in the bug, providing the developer with a wealth of diagnostic information to help with investigation of the bug (per above, this can also include a video recording of the test run).
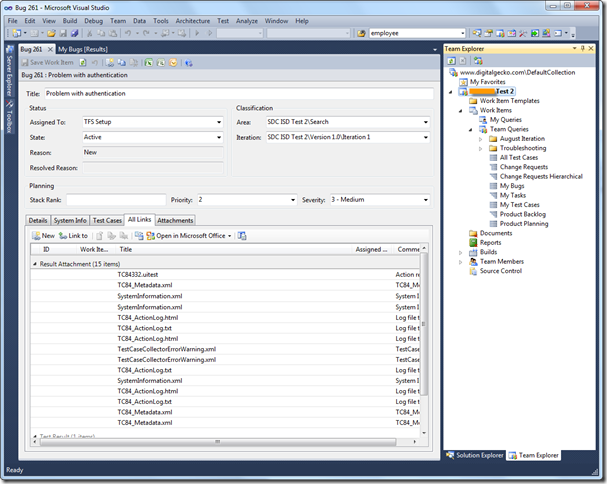
Once the bug is filled out and saved, a developer can then query on bugs assigned to them and find them in Visual Studio 2010.
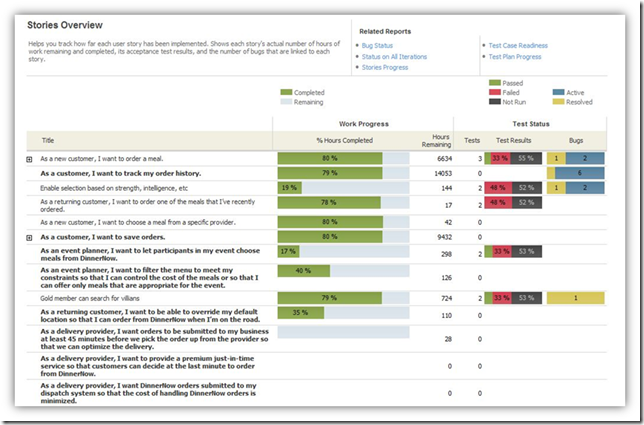
From a reporting perspective, you can see below what you gain from the integration of Test Manager 2010. This is the Stories Overview report, which shows, for each requirement, its work progress and test status that includes bugs reported against the requirement. You have an excellent visual in this one report to tell you overall how your project is tracking.
That’s it for our adventure through Microsoft Test Manager 2010. Hope this helps to get you going. This is a great tool with excellent TFS 2010 integration that will make managing test plans much less painful in a TFS 2010 environment and will provide full visibility into test progress as well through reporting.

![SNAGHTML8be420c[6] SNAGHTML8be420c[6]](https://msdntnarchive.blob.core.windows.net/media/MSDNBlogsFS/prod.evol.blogs.msdn.com/CommunityServer.Blogs.Components.WeblogFiles/00/00/00/72/23/metablogapi/0044.SNAGHTML8be420c6_thumb_31B6122F.png)
