
Give Your Crashes a Context through Logs Attachments
This is a guest post by Jean-Marie Alfonsi, Freelance Software Architect.
At the dawn of the app era, crash reporting was a dull and heavy work. You needed to manually retrieve your crash from your smartphone system, put some context in it and then send it to your custom web service. Being in the golden age of apps, we are now pretty spoiled with various ecosystems and continuous integration platforms, as they do all the heavy lifting for us. In terms of features and ease of use, Visual Studio App Center is one of the top players for app DevOps and is a must-have in a Xamarin environment. It does a tremendous job regarding crashes investigation, with a slick user interface.
Attachments: An App Center Diagnostics Underrated Feature
App Center offers some great diagnostics tools to track down the cause of our apps crashes. You probably know some of them:
- Version tracking
- Grouping
- Threads and events tracking
- Exception stack
While the usefulness of these listed features is fairly- obvious, I would like to shed a light on a more underrated feature: Attachments.
Some Crashes are Hard to Figure Out
You have probably already found yourself in a situation where a stack trace is not enough. For instance, when a UI exception is raised, your stack trace could be cut and you won’t be able to link it to a cause.
Let’s have a look at this exception:
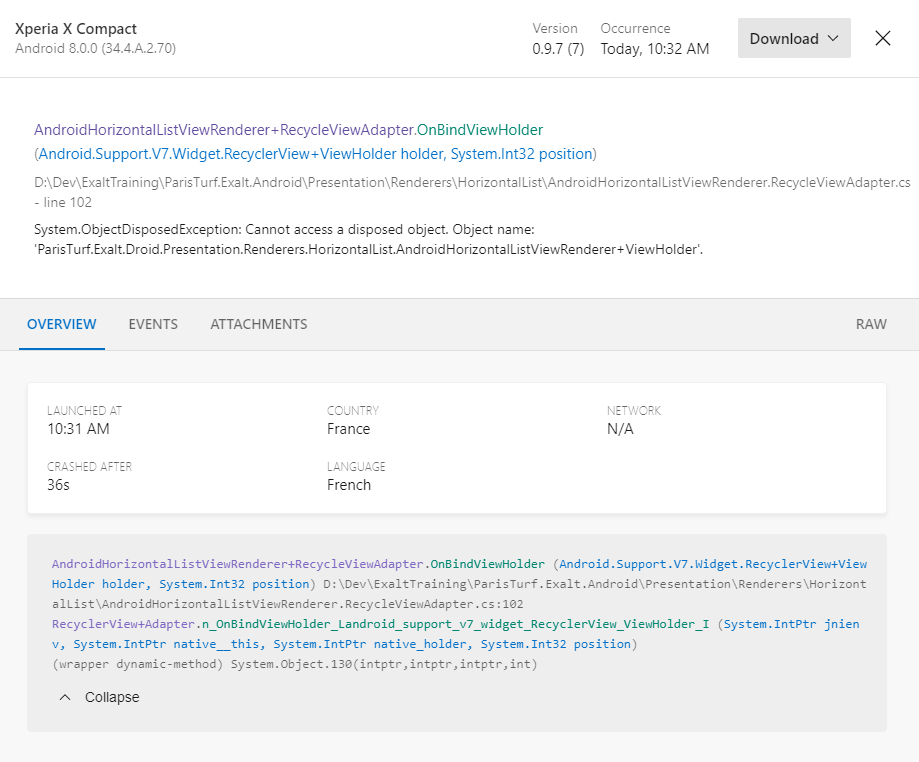
How do we reproduce it with just the stack trace? We don’t know what business code triggered this crash. We hardly know it came from the “`RecyclerView“` in a “`HorizontalList“`, and we may have several of them in our app, toughening our investigation.
We can see we are lacking some context here:
- What screen was displayed when the crash occurred?
- What actions the user did before
So how could we add context to our crash?
Using Events as Context?
One could say that events would bring some inputs to where the user was when the crashes occurred. However, events are used primarily to track user actions. As an example, you will know that the user has tapped on a button and arrived on this screen when the exception was raised. But it tells you nothing about the state of your application:
- Did our device lose connection to our server?
- Did our business code end in a faulty state (due to a business exception or remote exception)?
- What kind of elements was displayed in this screen?
In our example, our “`HorizontalList“` is bound to a sequence of items. It would have been great to know how many items successfully loaded into our list…
Also, events are primarily meant for analytics, not for debugging. Analytics are used by the marketing & product teams to have a better understanding of the app usage. You shouldn’t really mix debug info and analytics data as they try to reach two different goals.
So let me rephrase: what could give us the clean and rich context we need?
The Lost Art of Logging
Logging is Underrated
Nowadays, I am shocked by the small amount of love logging receives from developers. In one of my latest experience, when I asked why there weren’t any logs in the app, a colleague answered that thanks to crash reporting and advanced debugging tools, it’s now obsolete.
I strongly disagree.
A good logging experience will save you tons of debugging time, and help you think about the prerequisites and the postconditions of your methods. It will help you keep an eye on your app state while you’re testing.
How, What and Where to Log
I won’t go too much into detail about the what and where to log because it’s a well-covered topic. But we can start saying that you should use several severity levels (debug, info, warn, error, …) for your log messages, and use them accordingly to your deployment environment.
You should only log “debug” messages when you are in your development environment, to quickly debug invalid states. You will exclude messages of this severity when you are in production (with simple preprocessor directives) to keep your log light and readable.
For standard “info” messages, the beginning of public methods are good candidates, like entry point of your different layers (for example: services, repository, REST calls, …). But also your UI logic (ViewModels in MVVM,Controllers in MVC).
You could choose to log only the input arguments of those methods since the return arguments will be the input arguments of the next one 🙂. More resources on the subject:
https://www.codeproject.com/Articles/42354/The-Art-of-Logging https://spin.atomicobject.com/2015/07/02/fight-logging-entropy/ https://medium.com/@chadpav/thoughts-on-creating-a-good-logging-strategy-ios-example-f0ea1ea332f2
For the how part, there are a lot of logging frameworks available to choose from.
Since I’m in Xamarin world, I have to choose between Xamarin compatible logging frameworks. Basically, you will have to choose between structured logging (serilog) vs flat logging (metrolog, Nlog, XLog,…). It really depends on your needs. I tend to stick to flat logging because it’s far less resource-consuming (structured logging will serialize your data). But structured logging could be ok too, you just have to weigh the features versus the performance. However, we need to store our logs on the filesystem, and Serilog doesn’t seem to have a sink for Xamarin platforms file systems. For the rest of the article I will use Metrolog, the most used logging framework with Xamarin. Moreover, it comes with a nice simple zip feature, and we’ll see why it’s making things even easier for us.
App Center Brings Logs and Crash Together
The Idea
Wouldn’t be nice to have all our application logs as a context of our crashes? Thanks to the underrated Attachments feature of App Center we can have that. The idea is simply to keep our log in a file. When a crash occurs, we zip the logs and attach them to the crash. The zipped log size will then be really small and we can have several hours of log to understand what really happened. We need to persist our logs because the crash uploading will begin at the next launch of our app.
The Magic
But how can we achieve that? Well it’s dead simple, with just the following lines:
[sourcecode language="csharp"]
Crashes.GetErrorAttachments = report => { var compressedLogs = LoggerFactory.GetCompressedLogs(); return new[] { ErrorAttachmentLog.AttachmentWithBinary(compressedLogs.ToArray(), “logs.zip”, “application/x-zip-compressed”), }; };
public static MemoryStream GetCompressedLogs() { Stream compressedLogs = null; Task.Run(async () => compressedLogs = await _logManager.GetCompressedLogs()).Wait(); return (MemoryStream)compressedLogs; }
[/sourcecode]
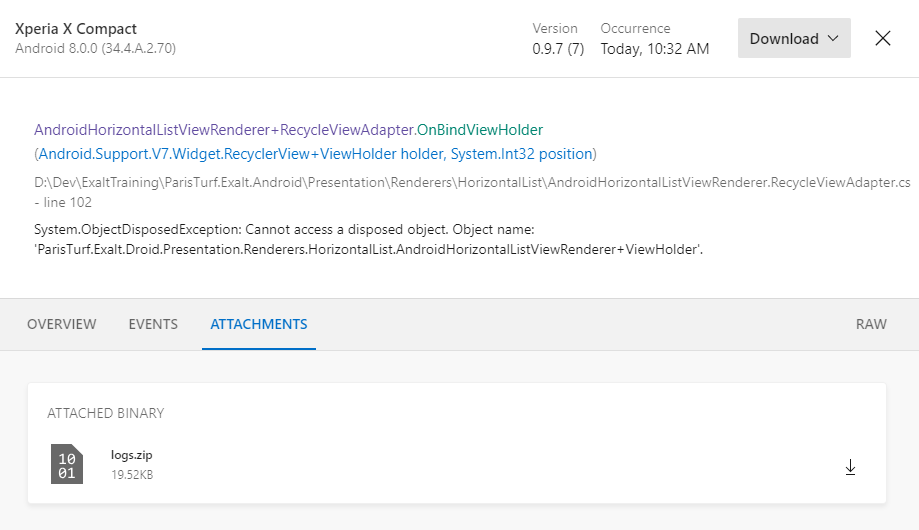
The “`ILogManager“` interface of Metrolog provide us a zip method, we just have to make the async method sync to fit into the app center workflow. We can now go back to our App Center crash section and retrieve our attached logs:
The Resolution
But what about our mysterious UI Exception? Let’s find out what the attached log is telling us…

First, we must spot the line where the crash occurred. It’s pretty simple: it would be the last line before the last start of the app. Obviously, the App Center SDK cannot send the report as soon as a crash happens, it waits for the next launch of the app. In our example it’s line 429. Now for the analysis part.
Second, we discover that we were on the “`ComparaisonView“`, in landscape mode when the crash occurred. Then, we can see that the “`HorizontalListView“` successfully instantiated the cells for indexes 0, 1 and 2, and then crashed. We have now much more information to reproduce the crash and discover this incredibly sneaky bug:
[sourcecode language=”csharp”]
if(index==3) { throw new ObjectDisposedException(); }
[/sourcecode]
All You Need is Log
I hope this post helped renewed your love for logging. It’s such a useful part of software development, don’t underestimate it. Logging will help you debug your apps quickly, check your app state while testing it, and of course, allow you to add meaningful context to your crash reports through the App Center Attachments feature (and you won’t mess with the analytics keeping everyone happy). Log is all you need.

Jean-Marie Alfonsi is a freelance software architect with 15+ years of experience. Lately he’s focusing primary on Xamarin, sharing some experiences through www.sharpnado.com and open source components on Github . Before that, he endorsed multiple roles: SOA architect (aka micro services), Scrum master, Windows Forms and WPF developer, database administrator, antivirus analyst.
 Light
Light Dark
Dark