Monitoring apps in the wild with Visual Studio Online Application Insights
We don’t like double posting content usually, however as I wrote the article ( https://t.co/f8HhewlWu9 ) I feel somewhat justified re-posting out to our own blog…
Sometimes in my learning I come across a killer book that will really resonate, and for me one such book was The Lean Start-up by Eric Reis which completely revolutionised the way that I like to approach my development and made me focus on the importance of the Build-Measure-Learn cycle.
For me the Build-Measure-Learn cycle represents a lot of what modern day application development is about. You simply put something out there, look to measure usage and apply learnings to enable you to focus your changes to support your users achieving their goals.
But how do we learn about our applications? How do we support this important Build-Measure-Learn cycle and gain insights into the applications we put out into the wild?
In the Visual Studio family of tools we have for a long time been building tools that help our customers build applications, however the measure and learn stages were an area left unaided, leaving developers to implement their own ways of measurement and instrumentation in which they could learn from. Recently however that has changed with Visual Studio Online Application Insights, which serves to monitor and centrally collate information about production applications and services so that we can gain insights that may have been difficult to obtain in the past.
Application Insights has 3 key areas that help analyse applications:
- Availability – Measure an applications availability from a series of global locations. This could be a simple ping test of an endpoint, or a more complex test (Web Test) that travels through logical key scenarios of an application end-to-end.
- Application Performance Monitoring – Monitor an application looking for key events, such as exceptions, performance issues or memory events that can alert us to problems prior to our customers reporting them to us.
- Usage Telemetry – Gain insight into an applications usage; see how our users engage with our applications, what platforms, browsers or devices they use? How often they revisit and how engaged are they when they are in the application?
Application Insights works with different application types including both Java and .NET server apps, client side JavaScript or deployed clients such as Windows Phone or Store applications. Application Insights is a service currently in public preview provided through Visual Studio Online (sign-up at https://www.visual studio.com and request an Application Insight voucher code).
Front and centre to the service is a customizable dashboard allowing you to select a range of charts and metrics for your application, each of which can be drilled into for further detail or can have email alerts setup against customizable threshold values.
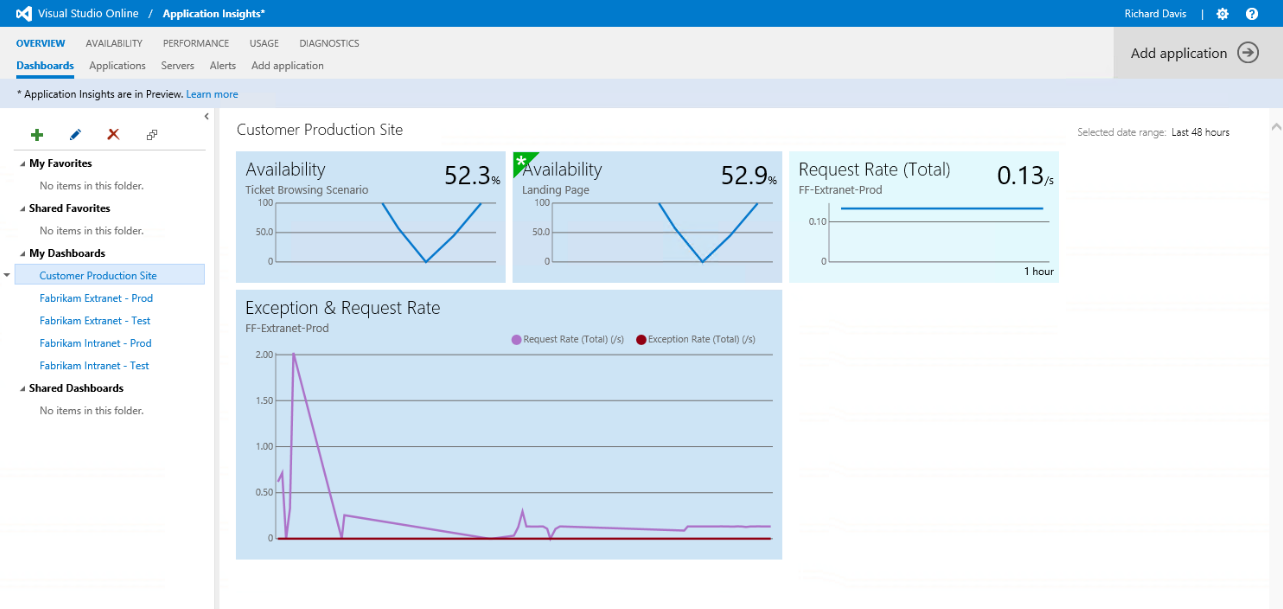
Visual Studio Application Insights - Dashboard
Availability monitoring with Application Insights
The availability monitoring in Application Insights enables applications to be tested from an outside-in perspective to get a view of availability. With this kind of monitoring, an endpoint will be automatically accessed from up to 16 global locations measuring success or failure and the speed of responses.
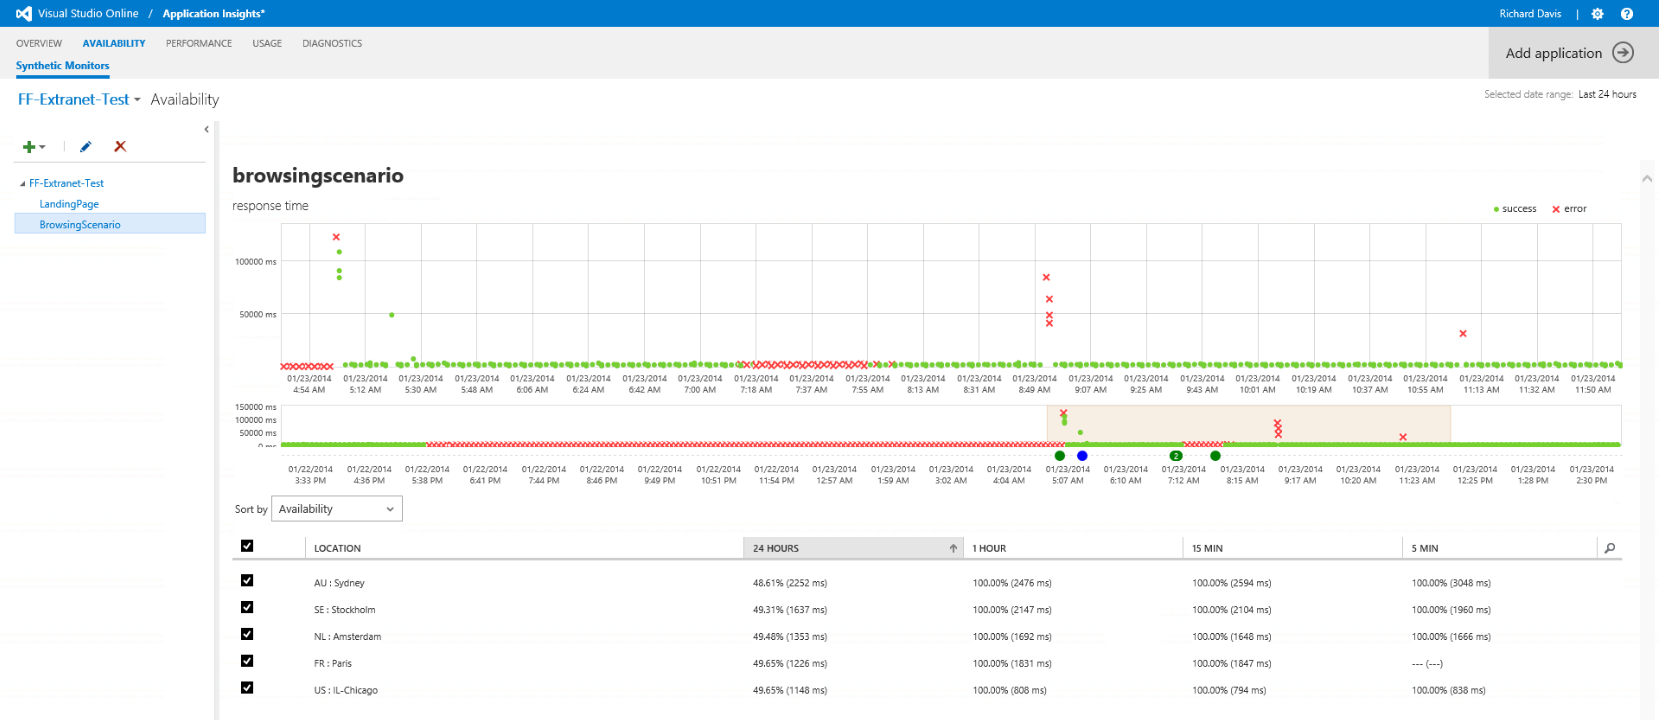
Visual Studio Application Insights - Availability
The outside-in monitoring has two modes of operation. The most simple of these modes is simple ping test of a single endpoint, or alternatively a more in-depth multi-step test is available that utilises the same HTTP protocol level web tests made available in Visual Studio Web Performance Tests. Completing a multi-step test enables Application Insights to test end-to-end key scenarios in our applications, measuring success or failure and measuring response times of our application from a series of global locations. Should a failure be noted as part of a multi-step test we can see granular detail of the step failing which can be viewed in the browser or opened directly in Visual Studio.
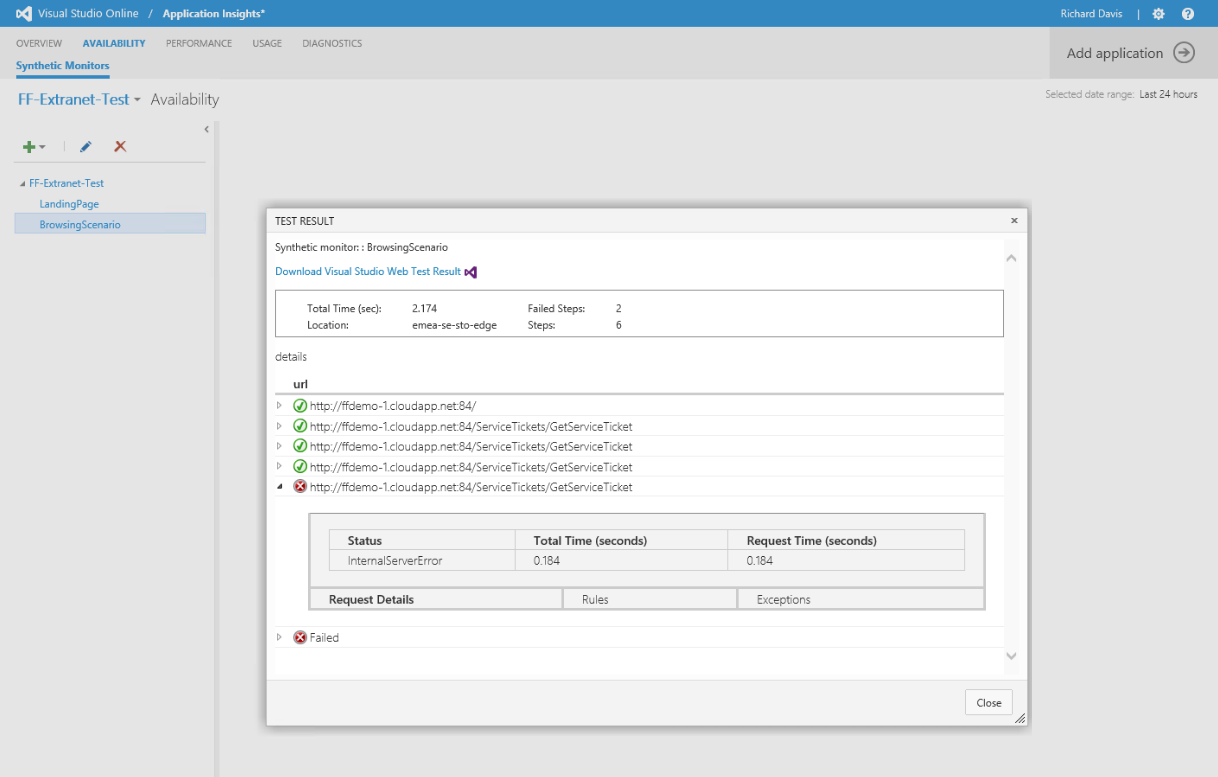
Visual Studio Application Insights – Global Availability with a Web Test
Application Performance Monitoring with Application Insights
The monitoring functions of Application Insights provides Application Performance Monitoring capabilities to your applications via an agent that needs to be deployed and sit alongside your applications. The agent functions to capture key metrics around your application and then centrally collate these metrics back to Visual Studio Online.
The agent that sits behind these capabilities is the Microsoft Monitoring Agent (MMA) that is also used for monitoring applications with Microsoft System Center. The agent can monitor .NET, Native and Java applications providing a mechanism to monitor for application exceptions, performance or memory events.
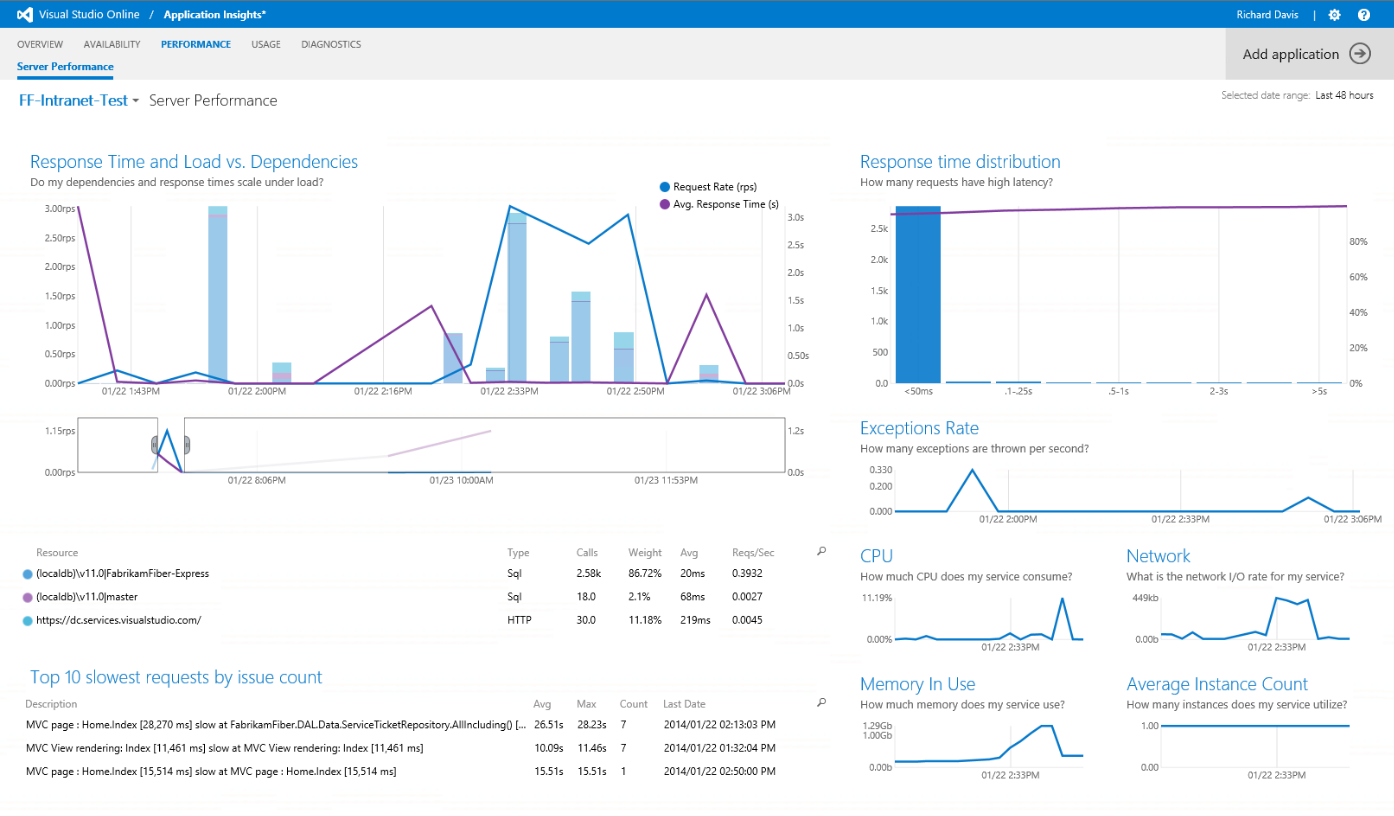
Visual Studio Application Insights – Server Performance Metrics
As a central hub for all our monitored servers, Application Insights provides consolidated, detailed reporting and analysis of how our applications are performing and the rates of exceptions raised or performance and memory events where thresholds are exceeded.
Where Application Insights and the MMA provides additional insights is in the instance where it notes an exception or performance/memory event it will log additional details such as IntelliTrace logs to pinpoint exception locations or IntelliTrace performance counters that demonstrate the hot path for our slow running requests. Similarly for memory events a base-lined memory dump comparison is logged, each of these scenarios allowing familiar Visual Studio IntelliTrace or Memory Comparison tooling to be used for deep analysis.
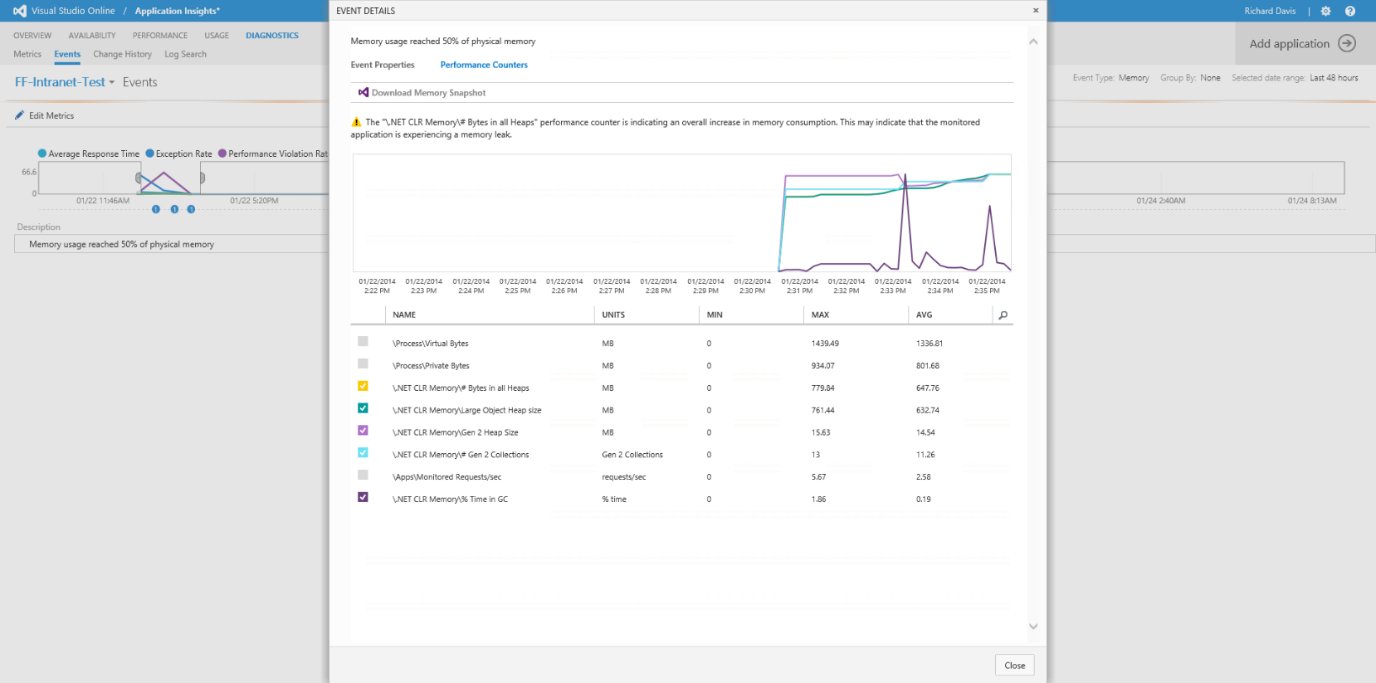
Visual Studio Application Insights – Memory Event
Usage Telemetry with Application Insights
Usage telemetry data is one of the key features that enables us to learn about our applications, and it is this feature that most strongly assists my developments with the Build-Measure-Learn cycle. With usage data, Application Insights enables a user to be profiled as they work with my applications and services. This usage data again will be centrally collected into Visual Studio Online giving me access to a host of information about my users that I may not have been aware of in the past.
At a simple level I can get details about my users environments. What operating system do they use? What Browser? What Device? I can even tell what resolution they are viewing at. This information helps me start to learn about my users and their preferences, but also starts to give me information around where I should concentrate my development and test efforts whether that be to support the masses, an emerging group, or an environment that I had not considered in the past. There is much more I can learn too including information such as my users geography or what language they use.
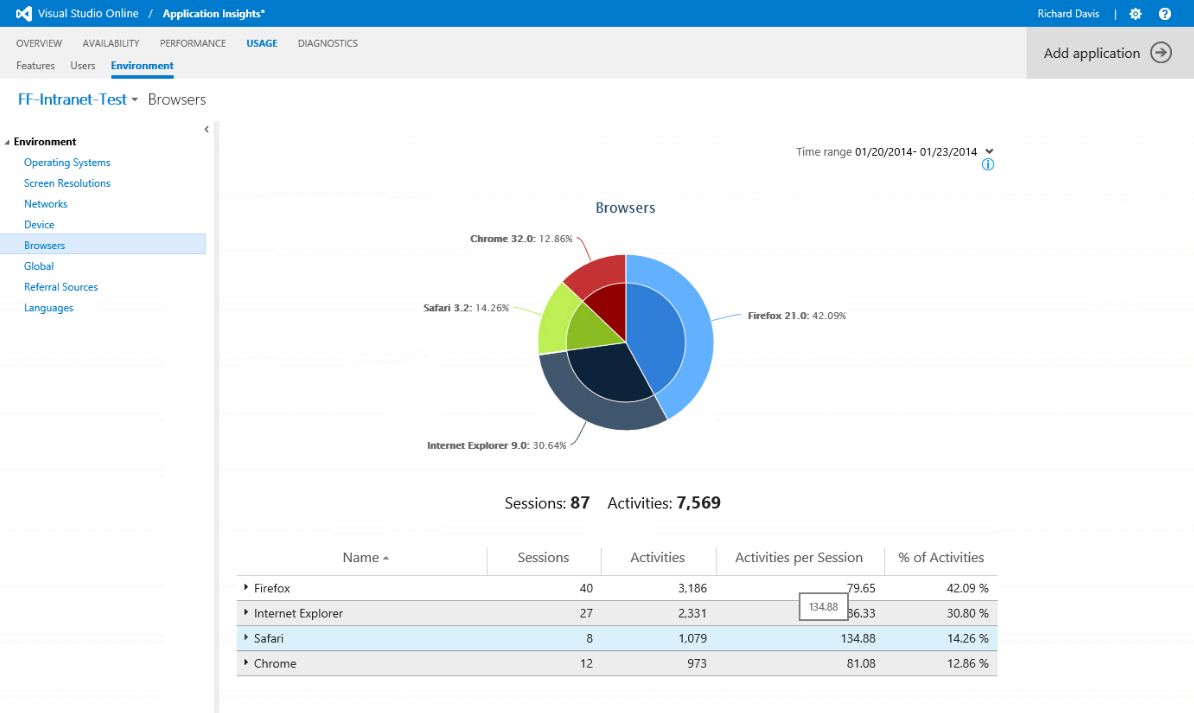
Visual Studio Application Insights – Browser Usage Data
One of the areas I find particularly interesting is the referral site details, helping me see where my users may have found my application from. Is this from direct links? from search engines or maybe another route like a marketing campaign that I wish to gauge the effectiveness of. These referral statistics give me insight I may not previously have had to hand.
Further to these sorts of statistics the usage telemetry goes further into profiling my users, and their engagement level. How long do they spend in my application? How long before they come back? How many of my users are ones I’ve seen before? Once again these sorts of statistics help me understand my users further and to try and make application changes to drive up these interaction numbers to control my engagement level.
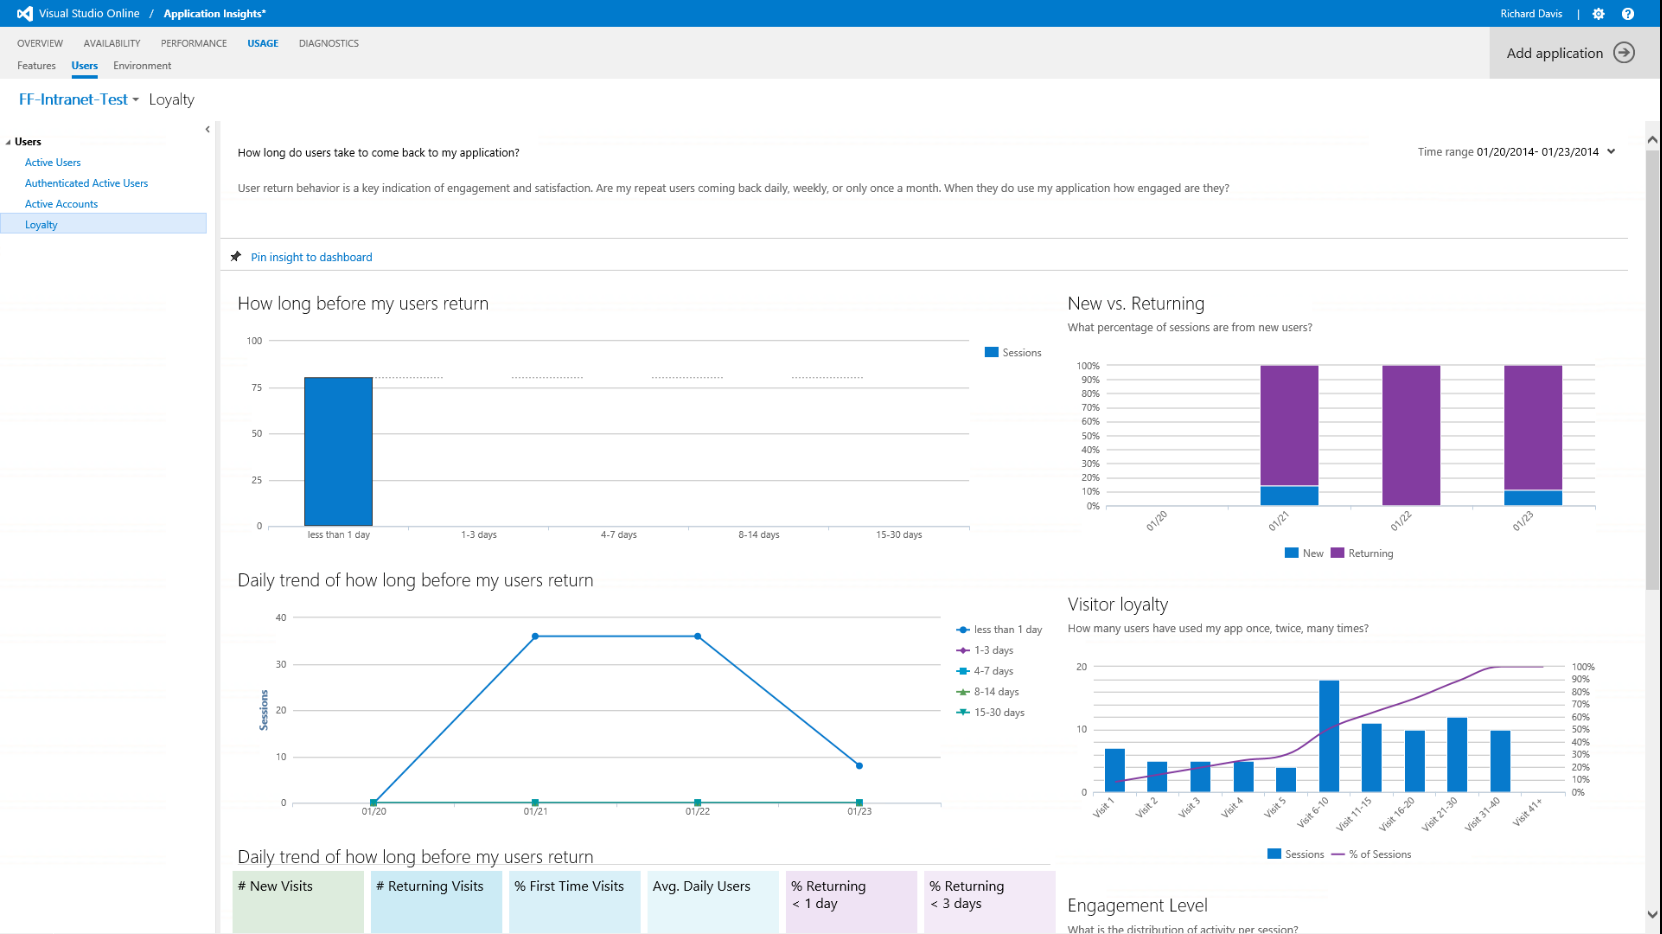
Visual Studio Application Insights – User Loyalty Data
The part that I particularly like to support my Build-Measure-Learn cycle is the ability within Application Insight usage telemetry to write custom events information that I can log on a per page or per event basis that can fuel a number of scenarios that help me deliver a solution that best meets the needs of my users. Some examples where this can be useful:
- Measured user journeys – Looking at an end-to-end process that I expect a user to travel through to accomplish a goal I can now measure at which point users get to and where users drop out. This helps me learn areas in my application that I need to improve to get users to the next application stage.
- A/B testing – In areas of my applications I can write a number of variants of an application feature that I can selectively use with my users. I can measure the features usage and understand the preferable long term choice for all my users.
- Early adopters – In my applications I can take a small group of early adopters that I can deliver a new set of features to. I can measure the success and iterate my changes to these features with my trusted group of adopters monitored by Application Insights before I expand to a wider audience of users.
In all of these cases I can now supplement my conversations with users with rich analytical information that I know is based on real usage of my applications and services.
Getting Started with Application Insights
If you’re interested in Application Insights and want to start using it to monitor and learn from you applications usage then the setup steps are very simple. First you’ll need a Visual Studio Online account (https://www.visualstudio.com/) following the link to get signed up to Application Insights on the homepage to your Visual Studio Online account (https://<youraccount>.visualstudio.com/). Once Application Insights is enabled for your account simply select the “Add Application” button that has comprehensive wizards with video examples of how to get setup depending on if your code is client or server based, on a device or in a datacentre or cloud based application. Further tutorial videos can be found online at: https://channel9.msdn.com/Series/Application-Insights-for-Visual-Studio-Online.